
Stocks & Equities
Thursday morning, Treasury Secretary Steven Mnuchin told CNBC that we could expect “significant” tax reform by August, including tax cuts for middle-income Americans and corporations. Like clockwork, the major stock indices rallied to all-time highs in intraday trading. As of yesterday, the Dow Jones Industrial Average has closed at record highs for the past nine days, and it wouldn’t surprise me if this gets stretched out to 10 days—or longer.

Investors aren’t the only ones jumping on the couch with joy, however. American consumers are expressing levels of confidence we haven’t seen in years, suggesting 2017 could be a banner year for retailers, who already saw a phenomenal year-over-year sales increase of 5.6 percent in January. This, of course, bodes well for the U.S. economy going forward, as consumer spending makes up an estimated 70 percent of the country’s economic activity.
Beside a host of positive economic data—low unemployment, strong household income growth—recent consumer polls and surveys show Americans feel confident about their financial prospects in the coming year and are ready to start splurging.
Consumer Exuberance at 13-Year High
The closely watched University of Michigan Consumer Sentiment Index raced up to a 13-year high in January, posting a final reading of 98.5. There’s little doubt that much of this exuberance stemmed from President Donald Trump’s pledges to cut and simplify taxes and deregulate businesses. Although the index cooled to 95.7 in February, this still bodes very well for retailers.

On Surer Financial Footing
According to McKinsey & Company’s recent Consumer Sentiment Survey, conducted online in September, more American consumers expressed feelings of stronger financial security than at any time in the past eight years. When asked if they were living paycheck to paycheck, for instance, less than a quarter said yes, compared to more than half of respondents who answered in the affirmative in 2009. In addition, fewer U.S. consumers said they were using money-saving strategies such as using coupons and loyalty cards or waiting for a sale before making a big-ticket purchase.

U.S. Among the Most Confident Countries
In the fourth quarter of 2016, American consumers were the world’s third-most confident consumers, according to Nielsen’s just-released Consumer Confidence Report. The country moved up an amazing 17 points during the three-month period, the most of any country in the 63-country survey. It was also one of only two countries representing Europe or the Americas to appear in the top 10, the other being Demark at number nine. By all measures, Americans were optimistic about the coming year. Six in 10 said now was a good time to buy the things they wanted, and intentions to spend on vacations rose 11 percent. Meanwhile, recessionary fears dropped dramatically.
| Score | Country | Change from Previous Quarter | |
|---|---|---|---|
| 136 |  |
India | +3 |
| 132 |  |
Philippines | 0 |
| 123 |  |
United States | +17 |
| 120 |  |
Indonesia | -2 |
| 112 |  |
Vietnam | +5 |
| 110 |  |
Thailand | +2 |
| 108 |  |
United Arab Emirates | 0 |
| 108 |  |
China | +2 |
| 107 |  |
Denmark | 0 |
| 106 |  |
Pakistan | +5 |
Before moving on, I must say that it’s incredible to see India retain the number one spot for the eighth consecutive quarter, despite the effects of Prime Minister Narendra Modi’s demonetization scheme in November.
Strong Retail Sales Expected… With a Caveat
All of this renewed optimism will translate, hopefully, into stronger retail sales. The National Retail Federation (NRF) projected 2017 sales, excluding automobiles, fuel and restaurants, to grow between 3.7 percent and 4.2 percent from 2016. This would put growth above the 10-year average of 2.9 percent and make it the best year since 2012.

The NRF tempered this enthusiasm, however, by pointing out the risks of Trump’s protectionist agenda, writing that “lawmakers should take note and stand firm against any policies, rules or regulations that would increase the cost of everyday goods for American consumers.”
This attitude was echoed by Walmart CFO Brett Biggs, who told reporters this week that he was most concerned about Trump and House Republicans’ plan for a border adjustment tax.
“Clearly anything that would potentially raise prices for our customers in the U.S. is a concern for us,” Biggs said, according to Business Insider.
This week, Trump met with eight retail CEOs, whose companies represent a combined $270 billion in sales in 2016. Two of these CEOs in particular, Target’s Brian Cornell and Best Buy’s Hubert Joly, voiced their strong opposition to a border tax, as it could significantly raise prices and dampen consumers’ feel-good mood.
With that said, I hope President Trump will make the right decision for American businesses and consumers, with respect to trade. Enthusiasm right now seems to be riding predominantly on tax reform and deregulation, and it’s at risk of being derailed by higher taxes at the border.
All opinions expressed and data provided are subject to change without notice. Some of these opinions may not be appropriate to every investor. By clicking the link(s) above, you will be directed to a third-party website(s). U.S. Global Investors does not endorse all information supplied by this/these website(s) and is not responsible for its/their content.
The Dow Jones Industrial Average is a price-weighted average of 30 blue chip stocks that are generally leaders in their industry.
The University of Michigan Confidence Index is a survey of consumer confidence conducted by the University of Michigan. The report, released on the tenth of each month, gives a snapshot of whether or not consumers are willing to spend money.
The online Consumer Sentiment Survey was in the field from September 3 to 27, 2015, and garnered responses from at least 1,000 consumers in each of 21 countries, plus another 1,000 consumers across the Middle East and 250 consumers in Taiwan. Because the survey was administered online, the sample largely reflects the characteristics of the typical online population—younger, urban, and more affluent.
The Nielsen Global Consumer Confidence Survey is an online survey of more than 30,000 respondents across countries in Africa, Asia-Pacific, Europe, Latin America, the Middle East and North America. It uses age and gender quotas to ensure the results are representative of Internet users. Scores above 100 indicate optimism.
Holdings may change daily. Holdings are reported as of the most recent quarter-end. None of the securities mentioned in the article were held by any accounts managed by U.S. Global Investors as of 12/31/2016.

Anytime the Dow makes a new high you can be reasonably assured of hearing the B-word bounced around in the media. Memories of the last bubble are still vivid and painful enough to trigger flashbacks of the bubble’s collapse. It’s only natural then that investors fear a return of irrational exuberance. Despite these fears, the evidence of a newly formed bubble is surprisingly lacking, as we’ll uncover here.
Asset manager Jeremy Grantham famously defined a bubble as any asset whose price has moved at least two standard deviations above its longer-term statistical mean, or norm. This definition is too rigid, however, and can sometimes be misapplied to see bubbles where none actually exist. Markets can sometimes exceed the 2 standard deviation rule in non-bubble environments, as when the utilities sector last year experienced a 3 standard deviation event.
This definition also is overly reliant on statistics and is lacking in the psychology department. Investor psychology, after all, is a primary driving force of the pricing mechanism in all free markets. What Grantham’s 2 standard deviation event rule fails to consider is that if a market experiences a record-breaking and sustained run-up, it can sometimes occur without widespread participation by small traders and investors. And without large scale participation among retail traders the psychology of a bubble is lacking, i.e. there is no bubble.
The latest rally in the major stock market averages has once again fueled talk of a mania for equities in the popular press. As discussed in previous commentaries, though, there is as yet no evidence of widespread direct participation in the equity market by small investors. Much of the movement behind the rally to new highs is courtesy of institutional activity, with the public participating only indirectly via retirement savings funds. Nowhere to be seen is the incessant preoccupation with day trading, swing trading and stock picking which were symptoms of the last two bubbles.
One explanation for this startling lack of bubble psychology despite the all-time highs in stock prices is the K-wave. Readers of this commentary should be familiar with this most basic of all long-term economic cycles, which answers roughly to the 60-year equity market cycle. The K-wave deflationary descent bottomed in 2014 based on the Kress cycle count. K-waves are often divided into four sections or “seasons” with each section being assigned a season of the year (e.g. winter, spring, summer, fall). The following graph was devised many years ago by P.Q. Wall and does an admirable job of describing the K-wave seasons.

If we assume that K-wave winter season ended in 2014, we’re now in the early phase of K-wave spring. Early spring can easily be confused with winter due to the occasional freeze or snow storm that sometimes happens during the transition period between the two seasons. But as the season progresses the signs of new life and warmth that always accompany spring gradually become more evident. In that same vein, the last couple of years might easily have been confused with winter due to periodic outbursts of deflation in the global economy. Yet we’re starting to see unmistakable signs that K-wave spring has truly sprung, even in the weakest performing foreign markets.
To take one example, China’s stock market is starting to show renewed signs of life after being in a bear market the last two years. China has also recently begun trying to increase its economic growth by providnig plenty of credit. As Dr. Ed Yardeni has observed, “During January, total ‘social financing’ rose by a record $542.3 billion. That’s not on a y/y basis, but rather on a m/m basis! On a y/y basis, social financing totaled $2.7 trillion over the past 12 months through January. Bank loans, which are included in social financing, rose $335.7 billion during January m/m and $1.8 trillion over the past 12 months.”
The emerging markets have experienced a similar rebound along with several euro zone markets. As the U.S. leads the rest of the world out of global recession, there can be no denying that the K-wave is beginning to work its spring-time magic.
The aggressive policy stance by China’s central bank has led to worries that China’s real estate and stock markets may soon experience another bubble. This in turn has added to fears that the U.S. will soon experience another bubble event in the stock market. This need not concern us, however, since painful memories of the credit crisis are still strong enough among central bankers to prevent a bubble from forming, let alone get out of control. Even China’s last taste of an equity market bubble ended prematurely when frightened policy makers quickly tightened money and credit in fear of the consequences.
Now let’s assume for a minute, though, that a bubble was allowed to form in the U.S. equity market this year. Would this be such a bad thing? Considering that the biggest advances in technological progress and development, to say nothing of widespread prosperity, have occurred during bubbles it’s easy to answer that question in the negative. While the naysayers focus on the negative aspects of a bubble’s implosion they neglect to mention that even after the inevitable popping, society is still immeasurably better off than before the bubble began. Indeed, a bubble might be just what is needed to put the U.S. economy back on the right track for vigorous growth.
It should be added that when it comes to economic policy, it’s always best to err on the side of too much growth than on too much austerity. The events in Europe of recent years serve as a stark reminder of this fact. Thus whenever fears of a bubble are discussed, it would do policy makers well to consider that the benefits of a loose monetary policy always outweigh that of a tight one.
Probably the biggest argument used by the bubblemongers right now is the chart of the NASDAQ 100 Index (NDX). This chart can easily be used to justify the fear of an incipient bubble, yet the investor psychology and mass participation factors are curiously missing right now.
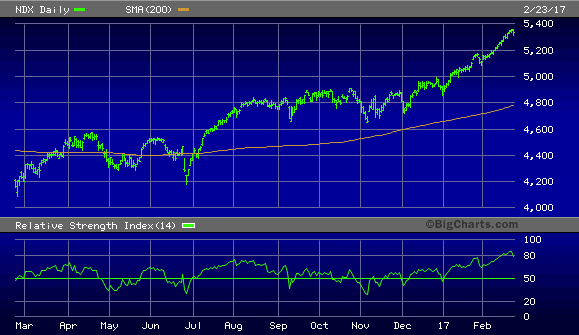
Before we arrive at the bubble stage, we should see increased interest bordering on obsession among small investors as the stock market becomes a primary focus among the masses. As this hasn’t yet happened, the inescapable conclusion is that the long-term bull market hasn’t reached bubble proportions yet and therefore has a ways to go before expiring.
….related: Big Bases: Big Moves in the World Stock Markets
Mastering Moving Averages
The moving average is one of the most versatile of all trading tools and should be a part of every investor’s arsenal. Far more than a simple trend line, it’s a dynamic momentum indicator as well as a means of identifying support and resistance across variable time frames. It can also be used in place of an overbought/oversold oscillator when used in relationship to the price of the stock or ETF you’re trading in.
In my latest book, Mastering Moving Averages, I remove the mystique behind stock and ETF trading and reveal a completely simple and reliable system that allows retail traders to profit from both up and down moves in the market. The trading techniques discussed in the book have been carefully calibrated to match today’s fast-moving and sometimes volatile market environment. If you’re interested in moving average trading techniques, you’ll want to read this book.
Order today and receive an autographed copy along with a copy of the book, The Best Strategies For Momentum Traders. Your order also includes a FREE 1-month trial subscription to the Momentum Strategies Report newsletter: http://www.clifdroke.com/books/masteringma.html

Available Mon- Friday after 6:00 P.M. Eastern, 3:00 Pacific.
DOW + 34 on 200 net advances
NASDAQ COMP – 25 on 600 net declines
SHORT TERM TREND Bullish
INTERMEDIATE TERM Bullish
STOCKS: A rise in oil helped oil stocks and that pushed the Dow to another record high. The rest of the market wasn’t as strong. A weak high tech sector pulled down the NASDAQ.
We are encouraged by some of the comments we’re hearing from the financial talking heads. Many are saying the that market is getting ahead of itself. That’s not the kind of sentiment one tends to hear at significant tops.
GOLD: Gold jumped $17. There seems to be less worry about rate increases and more about global discord. A dropping dollar was also cited.
CHART The Trading Index (TRIN) was above 1.50 at the close (arrow). When it’s this high, the next couple of days tend to be higher. If you’re unfamiliar with TRIN, check the brochure in your introductory material.

BOTTOM LINE: (Trading)
Our intermediate term system is on a buy.
System 7 We are in cash. Stay there for now.
System 8 We are in cash. Stay there for now.
NEWS AND FUNDAMENTALS: Jobless claims were 244,000, in line with expectations. Oil inventories rose 600,000 barrels. Last week they rose 9.5 million. On Friday we get new home sales and consumer sentiment.
INTERESTING STUFF: Although the world is full of suffering, it is also full of the overcoming of it. ——— Helen Keller
TORONTO EXCHANGE: Toronto was down another 49.
BONDS: Bonds had a nice upward surge.
THE REST: The dollar down. Silver was up sharply. Crude oil had a nice bounce upon finding that OPEC members were largely keeping their promises to cut production.
Bonds –Bullish as of Feb. 6.
U.S. dollar -Bullish as of Feb. 9.
Euro — Bullish as of December 2.
Gold —-Bullish as of Feb. 16.
Silver—- Bullish as of Jan. 31.
Crude oil —- Bearish as of Nov. 29.
Toronto Stock Exchange—- Bullish from January 22, 2016
We are on a long term buy signal for the markets of the U.S., Canada, Britain, Germany and France.
|
|
Wed. |
Thu. |
Fri. |
Tue. |
Wed. |
Thu. |
Evaluation |
|
Monetary conditions |
-1 |
-1 |
-1 |
-1 |
-1 |
-1 |
0 |
|
5 day RSI S&P 500 |
94 |
89 |
90 |
93 |
86 |
87 |
– |
|
5 day RSI NASDAQ |
95 |
91 |
93 |
95 |
89 |
67 |
0 |
|
McCl- lAN OSC. |
+65 |
+26 |
-3 |
+49 |
+12 |
+11 |
0
|
|
Composite Gauge |
9 |
10 |
8 |
6 |
8 |
10 |
0 |
|
Comp. Gauge, 5 day m.a. |
7.2 |
7.8 |
8.0 |
7.8 |
8.2 |
8.4 |
0 |
|
CBOE Put Call Ratio |
.83 |
.89 |
.95 |
.82 |
.89 |
.83 |
0 |
|
VIX |
11.97 |
11.76 |
11.49 |
11.57 |
11.74 |
11.71 |
|
|
VIX % change |
+11 |
-2 |
-2 |
+1 |
+1 |
0 |
0 |
|
VIX % change 5 day m.a. |
+1.0 |
+1.6 |
+1.2 |
+1.0 |
+1.8 |
-0.4 |
0 |
|
Adv – Dec 3 day m.a. |
+294 |
+21 |
-96 |
+175 |
+191 |
+354 |
0 |
|
Supply Demand 5 day m.a. |
.85 |
.82 |
.84 |
.89 |
.86 |
.78 |
0 |
|
Trading Index (TRIN) |
.84 |
1.29 |
.86 |
.66 |
1.38 |
1.52 |
0
|
|
S&P 500
|
2349 |
2347 |
2351 |
2365 |
2363 |
2366 |
Plurality -1 |
Monetary conditions (+2 means the Fed is actively dropping rates; +1 means a bias toward easing. 0 means neutral, -1 means a bias toward tightening, -2 means actively raising rates). RSI (30 or below is oversold, 80 or above is overbought). McClellan Oscillator ( minus 100 is oversold. Plus 100 is overbought). Composite Gauge (5 or below is negative, 13 or above is positive). Composite Gauge five day m.a. (8.0 or below is overbought. 13.0 or above is oversold). CBOE Put Call Ratio ( .80 or below is a negative. 1.00 or above is a positive). Volatility Index, VIX (low teens bearish, high twenties bullish), VIX % single day change. + 5 or greater bullish. -5 or less, bearish. VIX % change 5 day m.a. +3.0 or above bullish, -3.0 or below, bearish. Advances minus declines three day m.a.( +500 is bearish. – 500 is bullish). Supply Demand 5 day m.a. (.45 or below is a positive. .80 or above is a negative). Trading Index (TRIN) 1.40 or above bullish. No level for bearish.
No guarantees are made. Traders can and do lose money. The publisher may take positions in recommended securities.

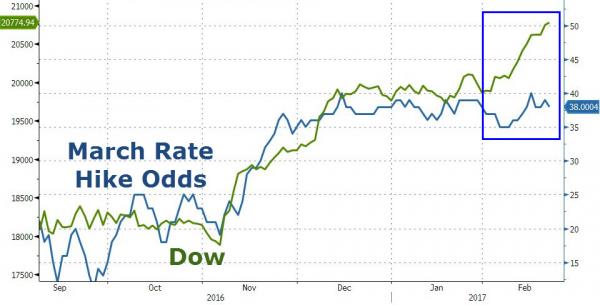
March rate hike odds are unchanged (below 40%) and the yield curve has flattened since The Fed’s February statement (despite heavy jawboning and higher inflation data) and so the Minutes were expected to help ease the markets to not be surprised. And they were...MANY FED OFFICIALS SAW HIKE `FAIRLY SOON’ IF ECONOMY ON TRACK. However, the Minutes also showed ‘balance’ by not proclaiming concern over inflation – *MANY FED VOTERS SAW ONLY MODEST RISK OF SIGNIFICANT INFLATION and FED OFFICIALS SAW DOWNSIDE RISKS FROM FURTHER DOLLAR STRENGTH.
Here is the key excerpt in which the Fed says a rate hike may be needed “fairly soon” if all goes according to plan..

An incredible amount of fraudulent, virtual silver is being created in order to cap price and paint the chart. Will JPM and the rest of The Evil Empire be successful once again in capping price and routing the Specs. The reaction to today’s FOMC minutes may help to determine the outcome.
Again, I can’t stress enough the devious and fraudulent nature of this latest attempt to contain and cap price. The past four days have seen the price of Comex Digital Silver pressing up against the key resistance of $18 and the 200-day moving average near $17.93. See below:

Over this same time period, the Comex Silver Banks led by JPM have increased the total supply of Comex silver contracts by 12,809 contracts. So, while price has been flat, total supply of Comex silver contracts has been increased by 6.5%. THIS is how you cap price and paint the chart!
Imagine for a moment where price would be this morning if total open interest was held flat for the past week. How much higher would price be if sellers of existing contracts needed to be found for the 12,809 contracts of buying pressure? On a larger scale, yes the price of Comex Digital Silver is up $2 year-to-date or about 13%, but how much higher would price be if The Banks hadn’t fraudulently added 44,000 new contracts since December 30?
Why do we always describe this as “fraud”? Two primary reasons:
- The Banks are selling something that they don’t have. Can you enter into a contract to sell a house or a car if you don’t actually own the house or car you are attempting to sell?
- The Banks create this new “silver” from whole cloth without depositing as collateral any additional silver into their Vaults.
Regarding point #2, see below. Note that at the beginning of 2017, total silver within the Comex vaulting structure was 181,903,037 ounces. Total Comex open interest that day was 163,812 contracts. With each contract representing 5,000 ounces of silver, this equates to a virtual exposure of 819,060,000 ounces.
As of last Friday, total open interest had grown to 205,602 contracts or 1,028,010,000 ounces or virtual silver yet the total amount of silver in the Comex vaults was stagnant at 184,088,021 ounces.


So, The Comex Silver Banks have increased the supply of virtual silver by 25% while only increasing the supply of physical silver in the vaults by 2%. This is fraud, this is a scam and this has absolutely ZERO connection to the supply/demand fundamentals of actual physical silver.
And what are The Banks attempting to accomplish in their aggressive efforts to cap price? Two things. First, maintaining price below the 200-day moving average is important in managing future Spec demand for additional Comex paper.

Second and perhaps more important is the chart-painting aspect of keeping price below $18. As you can see on this weekly chart, by capping price here, JPM et al are effectively attempting to paint a massive head-and-shoulder top onto the weekly chart.

So, once again, you must be alert and cautious here. The forces aligned against you in the Comex silver “market” are powerful and these criminals are doing everything in their collective power to rig price in their favor. Will they be successful (again)? That will depend upon a number of factors going forward. For today, at least, you’d be wise to not underestimate the collusive power of The Banks and the fraudulent nature of their paper derivative pricing scheme.
TF

-
I know Mike is a very solid investor and respect his opinions very much. So if he says pay attention to this or that - I will.
~ Dale G.
-
I've started managing my own investments so view Michael's site as a one-stop shop from which to get information and perspectives.
~ Dave E.
-
Michael offers easy reading, honest, common sense information that anyone can use in a practical manner.
~ der_al.
-
A sane voice in a scrambled investment world.
~ Ed R.
Inside Edge Pro Contributors

Greg Weldon

Josef Schachter

Tyler Bollhorn

Ryan Irvine

Paul Beattie

Martin Straith

Patrick Ceresna

Mark Leibovit

James Thorne

Victor Adair