
Stocks & Equities
 Barrons has interviewed Michael Belkin, the man who counsels the largest sovereign wealth funds, hedge funds, pension funds, and institutional money in the world, and his warning may foreshadow a stock market collapse.
For a portion of the interview from Barrons go HERE
….related:

Short term Elliott wave view in DJIA (Dow Jones Industrial Average) suggests that the rally from 1/19 low is unfolding as a 5 waves Elliott wave impulse structure where Minute wave ((i)) ended at 20125.28, Minute wave ((ii)) ended at 19784.7, and Minute wave ((iii)) remains in progress.
Internal of wave ((iii)) is showing an extension and subdivided also as an impulse structure where Minuette wave (i) ended at 20155.3, Minuette wave (ii) ended at 20015.3, Minuette wave (iii) ended at 20639.8 and Minuette wave (iv) ended at 20532.6. Index has broken above Minuette wave (iii) to confirm that wave Minuette wave (v) has started. Up from 20532.6, Subminuette wave (i) of (v) ended at 20747.6, and Subminuette wave (ii) of (v) is proposed complete at 20677.4.
Near term, while dips stay above 20541.2, expect Index to resume higher. We don’t like selling the Index and expect buyers to appear in 3, 7, or 11 swing while Index remains above Minuette wave (iv) at 20532.6. If Index breaks below 20538.7, it can be an indication that Minute wave (iii) has ended, and that Index has started Minute wave (iv) pullback.
DJIA 1 hour chart

Elliott Wave Degree

At Elliottwave-Forecast, we offer 24 hour coverage of 52 instruments from Monday – Friday using Elliott Wave Theory as primary tools of analysis. We provide Elliott Wave chart in 4 different time frames, up to 4 times a day update in 1 hour chart, two live sessions by our expert analysts, 24 hour chat room moderated by our expert analysts, market overview, and much more! With our expert team at your side to provide you with all the timely and accurate analysis, you will never be left in the dark and you can concentrate more on the actual trading and making profits. Check out our 14 day Trial to sample everything we have to offer.

 So where do you see the best opportunities now?
….read the entire interview in The Globe and Mail

 Natural gas prices plunged to their lowest level since November on mild weather in the U.S., which has caused storage levels to decline at a much slower pace than expected.
Contracts for March delivery on the Nymex exchange dipped to $2.63 on February 21, down a third since December. The bearish swing has come after successive EIA reports showing a modest drawdown in gas inventory levels.
Natural gas consumption is seasonal, with spikes in demand occurring in winter months. As such, storage levels build up over the course of the year, especially in the milder months of spring and fall. Then, gas is used up in the winter. The winter of 2016 was the warmest on record, leading to a paltry drawdown in inventories. The result was a cratering of natural gasprices last year as inventories swelled following the end of winter.
Related: Biggest Gasoline Glut In 27 Years Could Crash Oil Markets
The following graph shows the SI/GC ratio versus the S&P500 index beginning in August 1971 when President Nixon severed the final gold backing of the US dollar. Currency in circulation, debt, consumer cost of living, and most prices including gold, silver, crude oil, and the S&P rose in devalued dollar units.
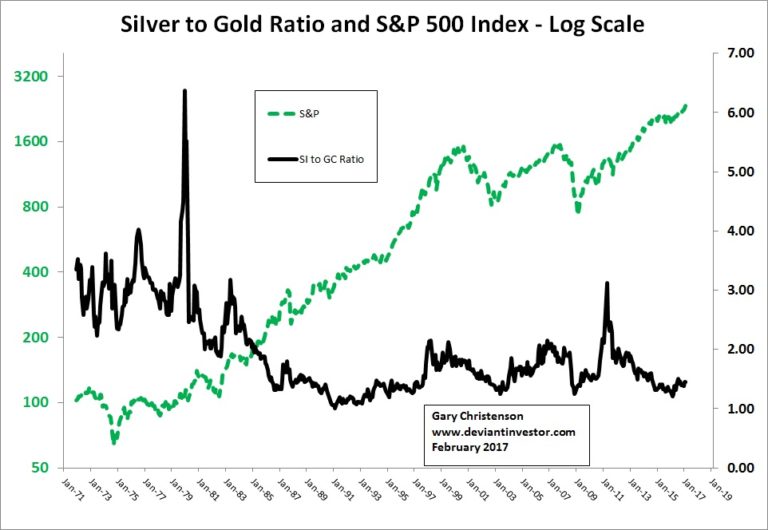
The two lines follow each other over long periods, and diverge during other periods. The next graph shows the same monthly data but smoothed with a ten month moving average. I divided the graph into four sections:
- August 1971 – January 1980. The dollar “floated” lower, silver and gold rose in a parabolic bubble, the economy grew slowly, and “stagflation” was dominant in the United States.
- February 1980 – February 1991. Gold and silver corrected and silver hit a low of $3.51 in February 1991. The S&P moved higher.
- March 1991 – April 2011. Silver rallied from $3.51 to nearly $50.00.
- May 2011 – February 2017. Silver and gold corrected and the S&P rallied.

Statistical Correlation:
These dates are important for silver and gold prices. Examine the statistical correlation (excel calculated) for the SI/GC ratio compared to the S&P500 Index.
- August 1971 – January 1980. Correlation = +0.28
- February 1980 – February 1991. Correlation = -0.79
- March 1991 – April 2011. Correlation = +0.91
- May 2011 – February 2017. Correlation = -0.93
These are interesting positive and negative correlations! How are these periods similar and different?
- Stagflation: The 1970s was the decade of “stagflation.” Interest rates and commodity prices rose, the nation was deeply divided politically, and the S&P was mostly flat. It was a difficult time for most Americans as debt and prices increased while incomes slowly followed. American prestige declined. 2017 – 2025 could be a repeat of the 1970s.
- Correction: The correction period saw the collapse of gold and silver prices and a bull market in stocks.
- Rally phase: Almost all markets rallied when measured in devalued dollar units. Gold set a new all-time high (August 2011) and silver approached its 1980 bubble high. Central banks exercised more control over markets, engaged in monetary nonsense such as QE, near zero interest rates, direct purchase of equities, trillions of dollars in swaps, guarantees, taxpayer funded bail-outs, and policies that supported a “no banker left behind” mentality.
- Levitation phase: Central bankers panicked and forced interest rates down to negative yields in Europe and Japan, purchased equities and ETFs, levitated stock and bond markets and created all-time highs in stock indices. Gold and silver dropped 40 – 70% while China, India, Russia and Turkey purchased massive quantities of gold bullion in the west, refined it into kilo bars, and shipped it to Asia.
WHAT CHANGED DURING THE LEVITATION PHASE BETWEEN MID-2011 AND TODAY?
- U. S. national debt increased by $5.6 trillion, about 39%. (Borrow and spend and spend and spend…)
- U. S. student loans increased by $0.60 trillion, about 70%. (Let the defaults begin.)
- U. S. auto loans increased by $0.3 trillion, about 40%. (More defaults coming.)
- U. S. corporate debt increased by $1.5 trillion, about 125%. (Buy back stocks to boost CEO compensation.)
- The Federal Reserve balance sheet increased by $1.8 trillion. (Buy toxic debt with “funny money” and make the debt disappear.)
- The S&P 500 Index increased by 1,000 points, about 74%. (Levitation works. Too bad about employment, good jobs, pension plans, savers, small businesses and middle America…)
- Silver dropped from nearly $50 in April 2011 to about $18 in February 2017, down about 63%. (A rally too far and too fast followed by a deep correction.)
- Gold dropped from over $1,900 in August 2011 to about $1,240 in February 2017, down about 36%. (Don’t let gold reach $2000 and fantasize all is well in central banker land. Read “Fed Up.”)
- The silver to gold ratio declined. The next major moves should be rallies in silver and gold, a correction in the S&P 500, weak growth and a repeat of stagflation.
SUMMARY:
BUSINESS AS USUAL: The U. S. government borrowed and spent and the Federal Reserve bailed out the largest banks. Students, auto owners, and corporations increased their debt loads, and newly “borrowed into existence” dollars levitated the stock and bond markets. Debt enlarged, fiscal and monetary nonsense prevailed, banker bonuses increased, pension plans were crippled and savers were hurt by near-zero interest rates.
BONDS TURNED DOWN: Bonds turned down last July and stocks could correct at any time. Trillions of digital dollars could disappear in days if stock and bond markets collapse, but the debts will remain.
Regardless of how quickly and harshly the fiat currency, bond, and stock bubbles collapse, gold and silver will remain real money and valuable.
“I view gold as the primary global currency.”
Alan Greenspan
THE UNITED STATES IN EARLY 2017:
Equities sell for all-time highs and at historically high valuations by many measures. Bonds have probably entered a bear market, like the 1970s. Equities trade in the zone where we should expect a correction or crash even though central banks are blowing bubbles and levitating markets via direct purchases and ever increasing debt.
Interest rates bottomed in July-August 2016 and probably finished a 35 year bull market. Rising interest rates will hurt government finances, real estate purchases, derivatives, corporate stock buy-backs and central bank credibility. Remember the 2008 crisis and read Charles Hugh Smith regarding a “Shrinking Pie.”
Silver, gold, and their mining stocks turned upward after their December 2015 lows. New all-time highs lie ahead.
THE RETURN OF STAGFLATION:
- Expect higher interest rates, lower stock prices and more political turmoil. Debt ceiling debates, increased military spending, more wars, tax increases, token budget cuts, and other issues such as the dreaded transgender bathroom controversy will occupy our leaders.
- Expect aggressive national participation in the “blame game.” Blame will be directed toward Russia, China, ISIS, Trump and Obama.
- Expect the S&P 500 Index and the Dow Jones Industrial Average to correct and possibly crash toward normal valuations.
- Expect the economy to grow slowly or decline due to overwhelming debt. A weak economy + higher prices = Stagflation!
- Expect a vicious repeat of the “stagflation” of the 1970s but with prices rising far more rapidly than incomes, except for the top 1%.
- Expect silver, gold, mining stocks and the silver to gold ratio to rise rapidly in 2017 and 2018.
- Expect melting snowflakes in late spring and summer.
Gary Christenson
The Deviant Investor


-
I know Mike is a very solid investor and respect his opinions very much. So if he says pay attention to this or that - I will.
~ Dale G.
-
I've started managing my own investments so view Michael's site as a one-stop shop from which to get information and perspectives.
~ Dave E.
-
Michael offers easy reading, honest, common sense information that anyone can use in a practical manner.
~ der_al.
-
A sane voice in a scrambled investment world.
~ Ed R.
Inside Edge Pro Contributors

Greg Weldon

Josef Schachter

Tyler Bollhorn

Ryan Irvine

Paul Beattie

Martin Straith

Patrick Ceresna

Mark Leibovit

James Thorne

Victor Adair