
Personal Finance
 Canadians pay some of the highest mutual fund fees in the world
- The opportunity cost of investment fees impact your portfolio
- Small fee reductions can mean big portfolio growth
Cage match: how do your mutual funds perform?
Let’s look at two different funds invested in the same securities, returning an average of 6% per year before management fees. For the purposes of these calculations, we will be using the mutual fund fee calculator from GetSmarterAboutMoney.ca.
If you start with a portfolio of $100,000 and contribute $10,000 a year, how much does the higher fee fund cost you over 25 years?
|
Fund #1 |
Fund #2 |
|
|
Initial investment |
$100,000 |
$100,000 |
|
Annual investment |
$10,000 |
$10,000 |
|
Average return before management fee |
6% |
6% |
|
Management fee |
2.42% per year |
0.77% per year |
|
Average return after management fee |
3.58% per year |
5.23% per year |
|
Total after 25 years |
$624,603.50 |
$840,363.04 |
Investing in the fund with the lower fee means your portfolio is almost a quarter of a million dollars larger than it would be if it was invested with the fund with a larger fee. The same amount invested; the difference in returns is an incredible $215,759.54.

 Gold is setting up for a historic rally based on my analysis. Recent news provides further evidence that the Precious Metals and Currencies are in for a wild ride. Just this week, news that China’s reserves fell below $3 Trillion as well as the implications that the fall to near $2T in reserves could happen before the end of 2017. Additionally, we have recent news that the EU may be under further strain with regards to Greece, the IMF and debt. The accumulation of Precious Metals should be on everyone’s mind as well as the potential for a breakout rally.
Based on my analysis, I would estimate that near June or July 2017, Gold will be near $1315 ~ $1341 (+13% from recent lows). This level correlates to a Fibonacci frequency that has been in place for over 3 years now. A second Fibonacci frequency rate would put the project advancement levels, possibly closer to October/November 2017, near $1421 (+21% from recent lows). After these levels are reached, I expect a pullback to near $1261 if the Gold rally ends near $1315~1341 or to near $1308~1309 if the Gold rally ends near $1421. This pullback would setup a massive next wave rally to $1585 or $1731. So, if you need confirmation of this move, just wait for any rally to end above $1315, then wait for a pullback below $1280 or $1315 and BUY.
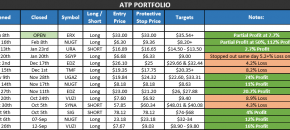
Subscribers and followers of my work profited handsomely this month locking a 112% profit with NUGT ETF with my service at ActiveTradingPartners.

 On Monday I had the opportunity to attend a conference at Goldman Sachs’ Dallas office. Among the dozens of money managers and investors who attended, a combined $1 trillion in assets was represented. The speakers were numerous, from famed economist Jan Hatzius, Goldman’s head of global economics, to Jeff Currie, global head of commodities research. Everyone was exceedingly smart and articulate, and I left the conference feeling recharged with much to think about.
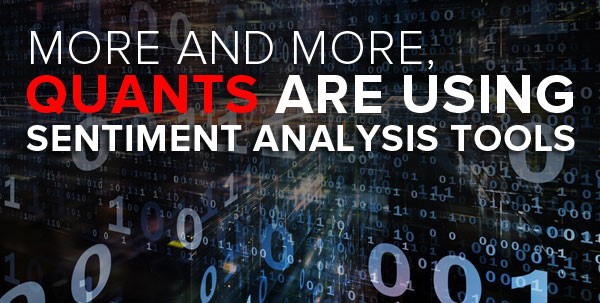
One of the most fascinating takeaways was Goldman’s increased use of sentiment analysis tools. Basically what this means is sophisticated software trawls the internet in real time for public attitudes and opinions on companies, products, sectors, industries, countries—you name it. Sources can include press releases, news stories, earnings calls, blogs, social media and more. All of this data is gathered and analyzed, giving quants and other highly sophisticated investors a better idea of where tomorrow’s opportunities lie.
We have experience gauging sentiment using platforms designed by Meltwater and ScribbleLive, and I was pleased to see our efforts validated.
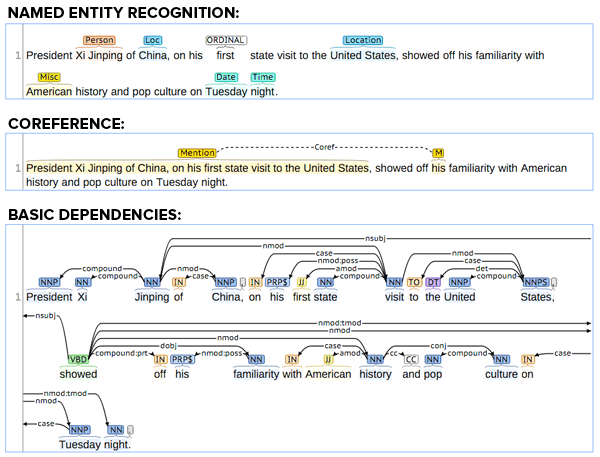
Goldman’s preferred system is Stanford’s CoreNLP, which is able to break down and analyze sentences in a number of different ways (and different languages to boot). Below is just a sampling of what the process looks like.
This strategy has been working well, Goldman said, and investors and managers plan to continue practicing it.
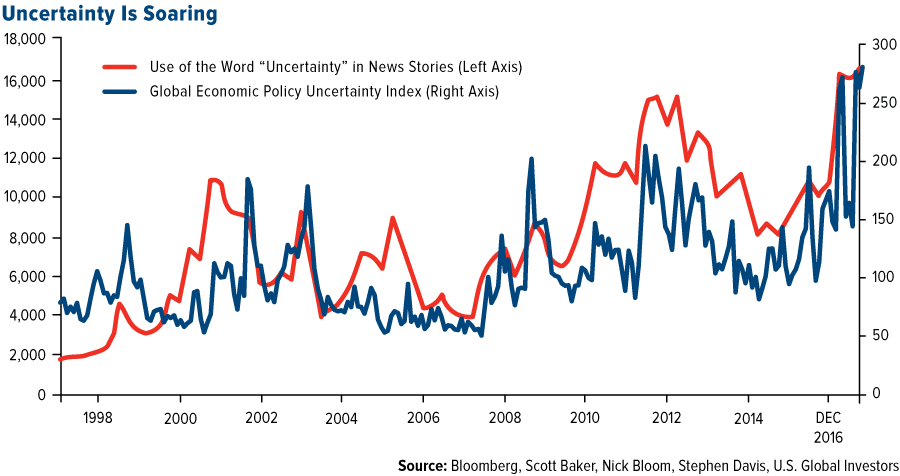
As I said, we take sentiment very seriously. In last week’s Investor Alert, we made note of the fact that the media’s use of the word “uncertainty” has soared to a record high since the November election. This is in line with recent movements in the Global Economic Policy Uncertainty Index, which is also now at all-time highs following Donald Trump’s election and Brexit in the U.K.
Goldman Bullish On Commodities
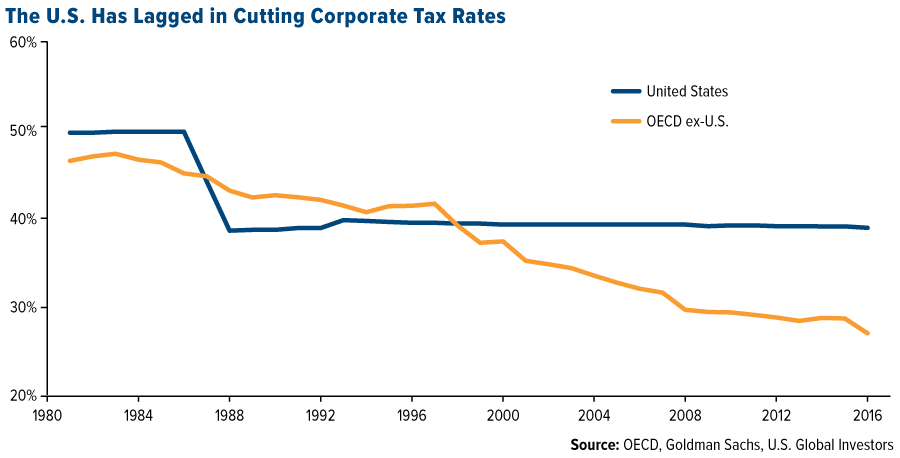
At the same time, small business optimism in the U.S., as measured by the National Federation of Independent Business (NFIB), soared to a 12-year high on the back of Trump’s election. At 105.8, its December reading was up a phenomenal five standard deviations. Much of this optimism was driven by Trump’s pledge to roll back regulations and lower corporate taxes, a point I’ve made several times already. Goldman echoed this thought, arguing the U.S. is behind the curve on cutting corporate taxes, compared to the average rate of the 35-member Organization for Economic Cooperation and Development (OECD).
 Using its sentiment analysis tools, however, Goldman managed to come to these conclusions as early as November—which is the same month the investment bank turned bullish on commodities for the first time in four years.
Goldman’s line of reasoning? When business optimism goes up, capital expenditure (capex) also goes up, and when capex goes up, commodities tend to follow. I should add that the bank has historically been neutral on commodities, recommending an overweight position only four times in the last 20 years. So when it does become bullish, investors should pay attention.
Look At The Timing
But there’s more to the commodity investment case than sentiment. The timing looks ideal as well.
Below, take a look at the output gap, which measures the difference between an economy’s actual manufacturing output and its potential output. When the gap is positive, that means demand is high and output is at more than full capacity. When it’s negative, that means demand has shrunk and output is less than what an economy should be capable of producing.

You can see that the output gap in the U.S. is finally turning positive, therefore entering the third stage of the business cycle, the best for real assets. The third stage is expansionary, characterized as having high output and fast growth—not to mention traditionally higher returns. We all know that past performance is no guarantee of future results. But similar periods in the past—shaded in gray—were associated with commodity super-cycles, the most recent one being the 2000s commodities boom driven by emerging markets, particularly China.
So far this year, the Bloomberg Commodities Index has risen 1.7 percent, compared to a negative 3.4 percent for the same number of trading days last year. If you remember, commodities ended positively in 2016 for the first time in six years, so there should be further room to run.
Courtesy of http://www.usfunds.com/
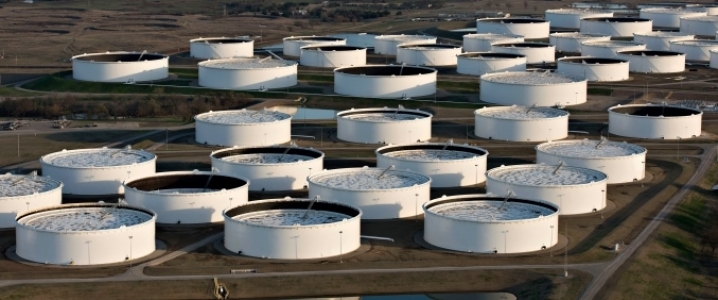 Plus “Oil rises after news OPEC could extend output cuts”
Another week brings yet more signs that the highly-anticipated oil market “balance” will not occur in the immediate future. Heading into 2017, there was a broad consensus that global oil production would fall below demand in the first half of the year, a deficit that would help bring down inventories and lead to relative balance between supply and demand. Mid-2017 seemed to be the timeframe that everyone was looking at for this development to occur.
But there are growing signs that the oil market won’t reach balance by then, and perhaps not this year at all. “We don’t really see a real balancing of the market coming until much much later,” Richard Gorry of JBC Energy Asia told CNBC in an interview. “Right now the oil market is oversupplied by about 500,000 barrels per day in the first quarter. So to see inventories continue to go up is absolutely of no surprise to us.”
…related:
Oil rises after news OPEC could extend output cuts
Oil prices rose on Thursday after OPEC sources said the group could extend its oil supply-reduction pact with non-members and might even apply deeper cuts if global crude inventories failed to drop to a targeted level.
OPEC and other exporters including Russia agreed last year to cut output by 1.8 million barrels per day (bpd) to reduce a price-sapping glut. The deal took effect on Jan. 1 and lasts six months.
Most producers appear to be sticking to the deal so far but it is unclear how much impact the supply reductions are having on world oil inventories that are close to record highs.
The supply pact could be extended by May if all major producers showed “effective cooperation”, an OPEC source told Reuters.
“There’s a good chance and high odds that the group (OPEC) decides that they want to continue this process,” Energy Aspects analyst Richard Mallinson said.
Benchmark Brent crude was up 30 cents at $56.05 a barrel by 1330 GMT. U.S. light crude gained 30 cents to $53.41 a barrel.
Global inventories are bloated and supplies high, especially in the United States.
U.S. crude and gasoline inventories soared to record levels last week as refineries cut output and gasoline demand softened, the Energy Information Administration said on Wednesday.
Crude inventories jumped 9.5 million barrels in the week to Feb. 10, nearly three times more than forecasts, boosting commercial stocks to a record 518 million barrels.
Gasoline stocks rose by 2.8 million barrels to a record 259 million barrels.
U.S. crude production, meanwhile, has risen 6.5 % since mid-2016 to 8.98 million bpd.
Analysts say the oil market is balanced between these twin pressures: OPEC cuts and rising U.S. inventories and production.
Brent and U.S. crude futures have traded within a $5 per barrel range since the start of the year.
“Prices have not seen this kind of stability for several years,” said David Wech, managing director of Vienna-based consultancy JBC Energy.
“However, if crude prices are to break out of their recent range in the next few weeks, the risk is to the downside.”
Gavin Wendt, founding director and senior resource analyst at commodity research firm MineLife, said: “The world oil market is very much in wait-and-see mode, which is why the price has remained in the mid-$50s per barrel range since mid-December.”

QUESTION: Marty is the rumor true that there is huge short-covering going on that is taking the US share market higher?
ANSWER: Of course. As I have stated, our model tends to show the point of no return is in the 23000 level, not here. This rally since 2009 has been the most BEARISH rally ever in history. Think of this like the mirror image of gold. Gold has declined for 5 years and you have people screaming here we go with ever $20 rally. In the stock market, it has been exactly the opposite. Every time the market decline, they say here we go it will crash by 70-90%.
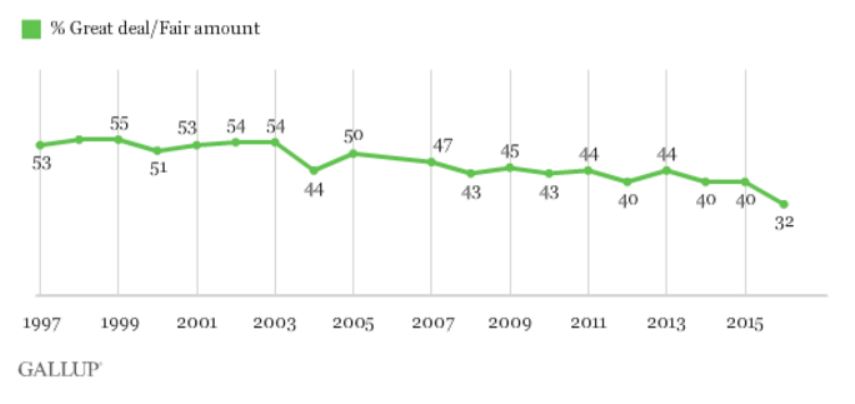
This is what I mean that the MAJORITY must always be wrong for they are the fuel that moves markets. I have been stating persistently that the Dow cannot “C R A S H” when the majority are bearish and retail participation is at historic lows (see Gallup poll).
The only real buyers have been due to the dollar, and sophisticated traders. The bulk of everyone else are BEARISH and cannot bring themselves to buy for they are still fighting the last rally in 2007 when they got caught. Therefore, the bulk of buying is short-covering – not fresh longs. This is very important. Fresh longs buying new highs turn sellers on a downturn. Short-covering does not. They may attempt to short against, but typically into a low – not highs.
So yes, there has been serious short-covering. That has been the bulk of this immediate rally and the relentless new highs each day. Only when the market crosses the 23,500 level do we see people surrendering and saying S H I T this is just going up. Until then, it will rally to each of our levels, stop briefly, and then proceed as long as we do not hit a turning point in TIME.
Others will point to this short-covering to then proclaim – See. This rally is not real and it will crash by 90% any moment now. This is why it is not over until the fat lady sings – or perhaps in this case, goes broke and screams.
All collapses unfold from highs with longs in panic. Major lows take place with shorts in panic. Short-covering at this stage demonstrates this is by no means a MATURE rally and we have a lot to go. Those who lost in 2007, just cannot bring themselves to say buy. This is why retail participation remains at historic lows. As long as that prevails, there is no way we have sufficient longs buying the highs from which a panic can then unfold by scaring the herd.
Here is the gold low in 1985. It bottomed on February 26th and on March 18th-19th a panic short-covering began. It was not people going long. It was shorts in panic. Merrill Lynch at that time hired me to TEACH one of their clients in Switzerland how to trade. They said they would pay all expenses and pay my hourly rate for the entire time even sleeping. I ask who the hell was this? It turned out he created the biggest deficit in history up to that point $25 million in gold. He was short and that is the loss over and above what he had in the account. Keep in mind the biggest hedge fund was $100 million back then.
It is routinely short-covering that created the major breakouts and lows, just as it is panic selling from longs that cement major highs. This is why I say after years of being called in to some of the biggest disasters in trading over the last 40 years, my conclusion is simply the MAJORITY must always be wrong.


-
I know Mike is a very solid investor and respect his opinions very much. So if he says pay attention to this or that - I will.
~ Dale G.
-
I've started managing my own investments so view Michael's site as a one-stop shop from which to get information and perspectives.
~ Dave E.
-
Michael offers easy reading, honest, common sense information that anyone can use in a practical manner.
~ der_al.
-
A sane voice in a scrambled investment world.
~ Ed R.
Inside Edge Pro Contributors

Greg Weldon

Josef Schachter

Tyler Bollhorn

Ryan Irvine

Paul Beattie

Martin Straith

Patrick Ceresna

Mark Leibovit

James Thorne

Victor Adair