
Wealth Building Strategies
 P. T. Barnum (1810 – 1891) was an American showman, businessman, and entertainer, who founded what became the Ringling Bros. and Barnum & Bailey Circus. He became a very wealthy man and he shares some advice on how to acquire wealth in his book “The Art Of Money Getting”. Here are three of the tips he shares in his book:
Be Frugal
“Wear the old clothes a little longer if necessary; dispense with the new pair of gloves; mend the old dress, live on plainer food if need be; so that, under all circumstances, unless some unforeseen accident occurs, there will be a margin in favor of the income. A penny here, and a dollar there, placed at interest, goes on accumulating, and in this way the desired result is attained.”
Choose Work You Enjoy
“The safest plan, and the one most sure of success for the young man starting in life, is to select the vocation which is most congenial to his tastes . . . We are all, no doubt, born for a wise purpose . . . Unless a man enters upon the vocation intended for him by nature, and best suited to his peculiar genius, he cannot succeed.”
Be Cautious and Bold
“Among the maxims of the elder Rothschild was one, all apparent paradox: ‘Be cautious and bold’. This seems to be a contradiction in terms, but it is not, and there is great wisdom in the maxim. It is, in fact, a condensed statement of what I have already said. It is to say: ‘you must exercise your caution in laying your plans, but be bold in carrying them out.’ A man who is all caution, will never dare to take hold and be successful; and a man who is all boldness, is merely reckless and will eventually fail.”
…related: Seven Essential Ways to Build Wealth

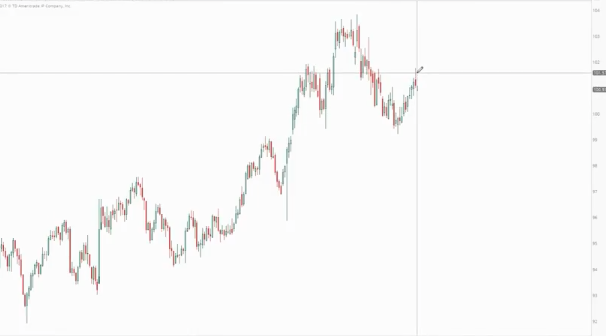
The dollar is possibly completing the right shoulder of a head and shoulders pattern. Overnight price completed a swing high suggesting a decent possibility the daily cycle has topped. Several scenarios for the dollar’s future price movement are discussed, as well as the implications for price performance of gold related investments:
….also: Stock Trading Alert: New Record Highs As Bull Run Continues – Can It Get Even Higher?

Sent to subscribers on February 16, 2017, 6:55 AM.
Briefly: In our opinion, speculative short positions are favored (with stop-loss at 2,410, and profit target at 2,200, S&P 500 index).
Our intraday outlook is now bearish, and our short-term outlook is bearish. Our medium-term outlook remains neutral, following S&P 500 index breakout above last year’s all-time high:
Intraday outlook (next 24 hours): bearish
Short-term outlook (next 1-2 weeks): bearish
Medium-term outlook (next 1-3 months): neutral
Long-term outlook (next year): neutral
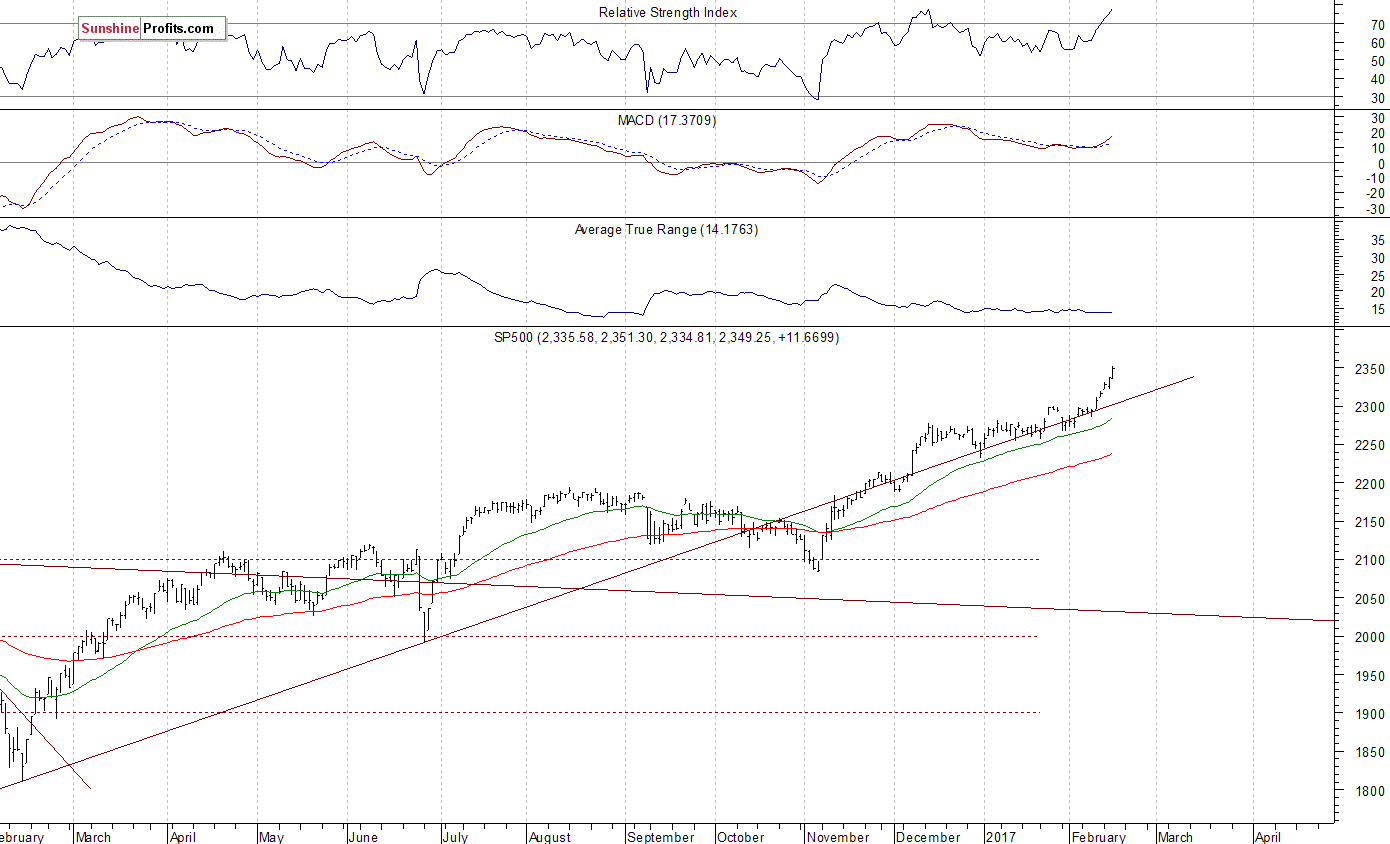
The main U.S. stock market indexes gained 0.5-0.6% on Wednesday, extending their short-term uptrend, as investors reacted to economic data, quarterly corporate earnings releases. The S&P 500 index has reached yet another new all-time high at the level of 2,351.30, following slightly lower opening of the trading session. The Dow Jones Industrial Average trades above the level of 20,600, and the technology Nasdaq Composite Index is now above 5,800 mark. All three major indexes trade at new record highs. Will the market extend its year-long medium-term uptrend even further before some more meaningful downward correction? The nearest important level of support of the S&P 500 index is at around 2,320, marked by Monday’s daily gap up of 2,319.23-2,321.42. The next support level is at around 2,300-2,310, marked by previous level of resistance and Friday’s daily gap up of 2,311.08-2,311.10. We can see some short-term volatility following three-month-long rally off last year’s November low at around 2,100. Is this a topping pattern before downward reversal? The uptrend accelerates, and it looks like a blow-off top pattern accompanied by some buying frenzy. The S&P 500 index trades above its medium-term upward trend line, as we can see on the daily chart:
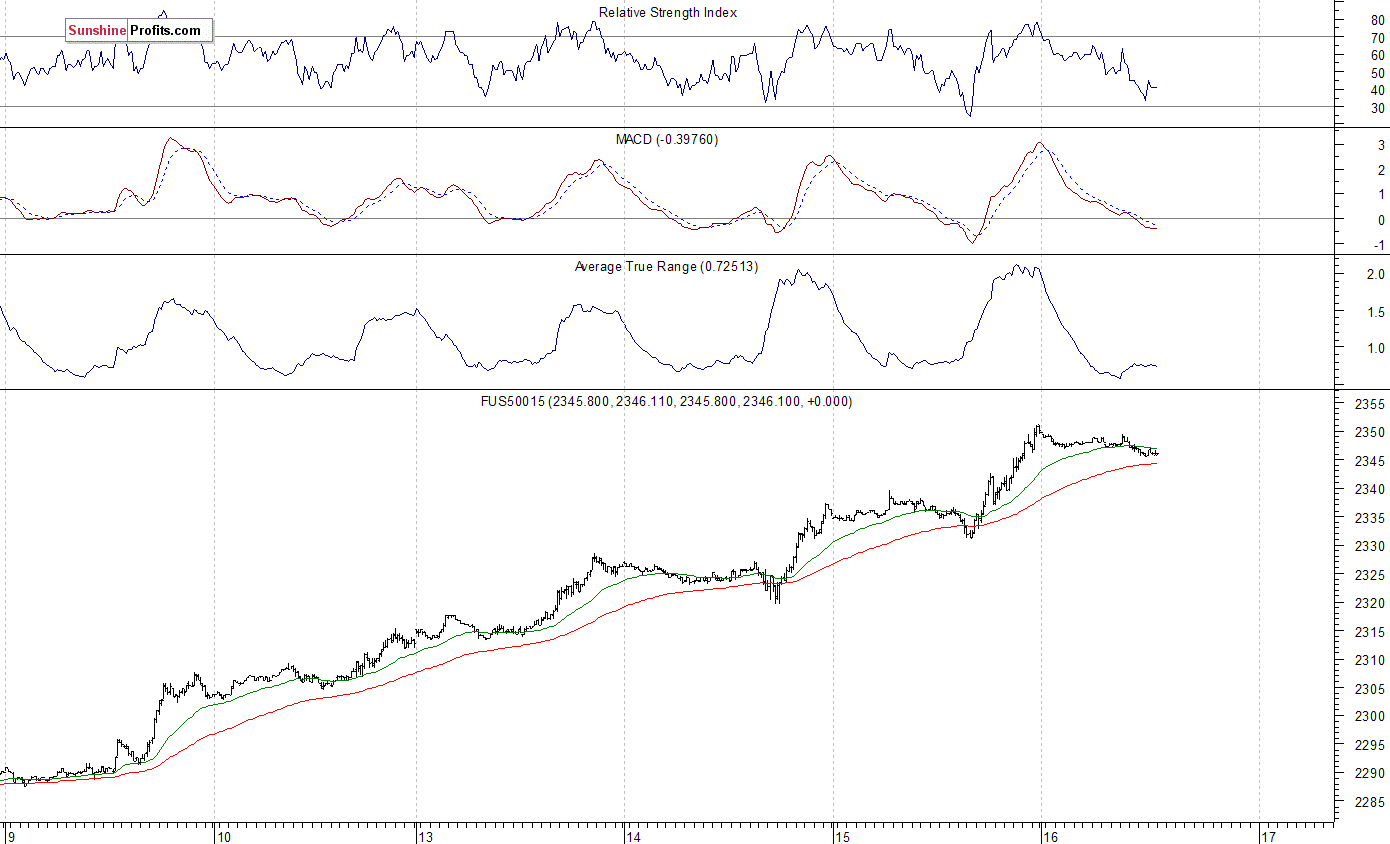
Expectations before the opening of today’s trading session are slightly negative, with index futures currently down 0.1-0.2%. The European stock market indexes have lost 0.2-0.5% so far. Investors will wait for another series of economic data announcements: Housing Starts, Building Permits, Initial Claims, Philadelphia Fed at 8:30 a.m. The market expects that Housing Starts along with Building Permits were little changed in January, the weekly Initial Claims number was at 242k, and the Philadelphia Fed number was at 17.5 in February. The S&P 500 futures contract trades within an intraday consolidation following yesterday’s rally. The nearest important level of support is at around 2,340, marked by recent local high. The next support level remains at 2,325-2,330, marked by previous level of resistance. On the other hand, resistance level is at around 2,350, marked by new record high. There have been no confirmed negative signals so far. However, we can see short-term overbought conditions, along with negative technical divergences. Is this a topping pattern or just an intraday consolidation before another leg up?
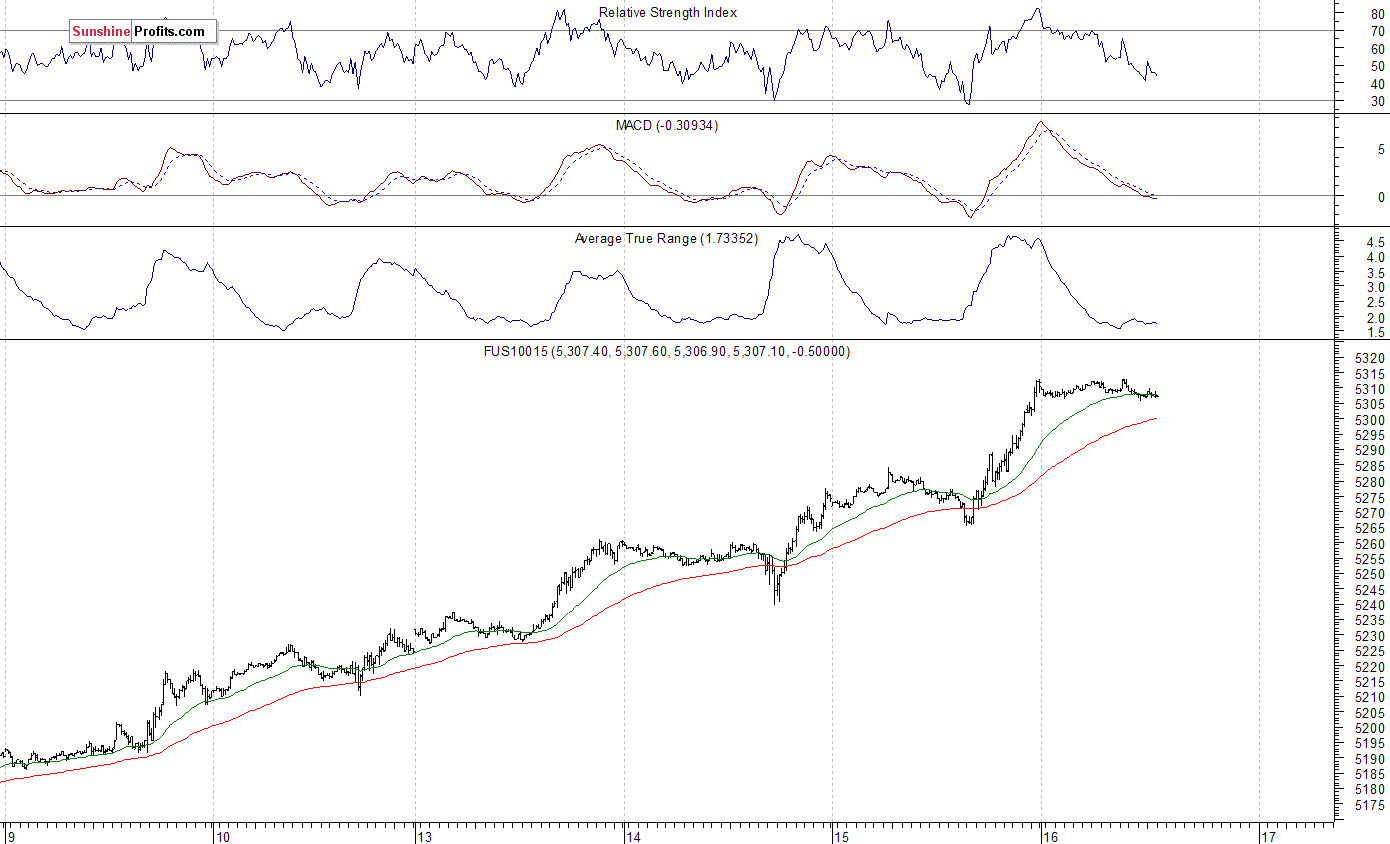
The technology Nasdaq 100 futures contract follows a similar path, as it currently trades within an intraday consolidation after yesterday’s rally. It has reached new all-time high above the level of 5,300. The technology sector stocks have been relatively stronger than the broad stock market recently following better-than-expected quarterly earnings releases. The nearest important support level is at 5,280-5,300, marked by previous level of resistance, and the next support level is at around 5,250, among others. The market trades along new all-time highs, as the 15-minute chart shows:
Concluding, the broad stock market accelerated its rally on Wednesday, as investors’ sentiment remained very bullish. The S&P 500 index has reached yet another new all-time high within an eight-year-long bull market off 2009 low. Will the uptrend continue despite some clear short-term overbought conditions? Or is this a topping pattern before downward correction?
Our speculative short position from December 14 has been closed on Tuesday, at the stop-loss level of 2,330 (S&P 500 index). We lost 61.65 index points on that trade, betting against year-long medium-term uptrend off last year’s February local low. It is always important to set some exit price level in case some events cause the price to move in the unlikely direction. Having safety measures in place helps limit potential losses while letting the gains grow.
There have been no confirmed negative signals so far. However, we still can see medium-term overbought conditions accompanied by negative technical divergences. Therefore, we continue to maintain our speculative short position (opened yesterday at 2,335.58 – opening price of the S&P 500 index). Stop-loss level is at 2,410 and potential profit target is at 2,200 (S&P 500 index). You can trade S&P 500 index using futures contracts (S&P 500 futures contract – SP, E-mini S&P 500 futures contract – ES) or an ETF like the SPDR S&P 500 ETF – SPY. It is always important to set some exit price level in case some events cause the price to move in the unlikely direction. Having safety measures in place helps limit potential losses while letting the gains grow.
To summarize: short position in S&P 500 index is justified from the risk/reward perspective with the following entry prices, stop-loss orders and profit target price levels:
S&P 500 index – short position: profit target level: 2,200; stop-loss level: 2,410
S&P 500 futures contract (March) – short position: profit target level: 2,197; stop-loss level: 2,407
SPY ETF (SPDR S&P 500, not leveraged) – short position: profit target level: $220; stop-loss level: $241
SDS ETF (ProShares UltraShort S&P500, leveraged: -2x) – long position: profit target level: $15.47; stop-loss level: $12.98
Thank you.
Paul Rejczak
Stock Trading Strategist
Stock Trading Alerts

 Have you ever been presented with an opportunity and missed out on it? Well, here is an opportunity you Do NOT want to miss out on.
Based upon my unique “Cycle Analytical” work combined with my “Proprietary Predictive Analytics Model”, I can assure you that there are new highs to be made in the U.S. stock. Appling my unique metric, which are not available to the public, I can inform you that the stock markets are not overbought or overextended, at present. The market remains in a clear bullish trend! This next new leg is very sustainable!
Technically Speaking, It Is Now Back To “Buy The Dip”:
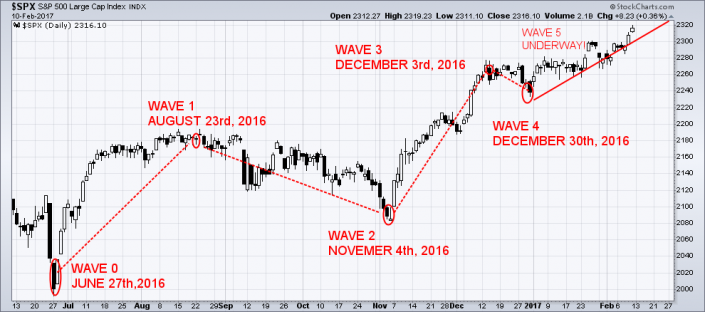
The SPX, Dow Jones and the Nasdaq Composite all closed at new all-time highs last Friday, February 10th,2017. The Trump Rally is just getting started according to Bloomberg.
Investors should expect that the global markets will continue their bull market run throughout the first half of 2017 rather than forming a top which leads to a bear market. “Extremes” have lost their’ meanings, at this point. The Federal Reserve has given the green light to major banks in the U.S. to raise dividends and buy back shares of their companies. The huge thrust in momentum has now returned to the four U.S. stock indexes.

NOTHING is certain or guaranteed in Markets…. ever. Anyone who tells you otherwise is a charlatan.
That said, within Bressert’s Cycle framework the norm is that a new Intermediate Cycle in any asset should test or breach the Intermediate Cycle downtrend before topping and those are my expectations based on my current analysis on both Gold and the USD.
With that as background, my Gold chart shows these expectations.
- Will Gold test or breach the Yearly Cycle downtrend line on my chart? The high probability answer based on cycle norms is yes.
- Will gold breach this line and turn back down or move up and make a higher high than 2016 before topping in this Intermediate Cycle? Really? If I had that level of clairvoyance, I would never have a losing trade…

- Cycle analysis combined with standard TA is all about developing a trading framework based on probabilities. Sorry, but I am no magician but playing the probabilities has worked out nicely for me. Cut your losers quickly and let your winners run.
An Intermediate Cycle Low (ICL) is the best time to buy any asset given that you sold near the top and have capital to deploy along with the mental courage to pull the trigger at the low. Most Traders buy near highs and sell in despair near ICLs. Cycle analysis is the tool we need to understand bearish investor sentiment at market lows in order to have the courage to buy at those cycle lows when most are selling in panic.
“When your Yelling, you should be Selling and when you are Crying, you should be Buying.” That is, in essence, what this service is all about if you stick with me (…last year was my best trading year ever). My goal is to be buying when there is blood in the streets. Will you have the courage to follow?
So this is one reason I kept the recent Gold position additions in GDX and AGQ rather small as we are already 1.5 months into a new Intermediate Cycle and the miners are already up over 34%. This is NOT your best entry point. Ok, enough posturing and onto the Chart.
Gold is bouncing along above the 10ema and should move higher out of a Half Cycle Low if my analysis is correct. My plan is to take profits when I see signs of topping, probably up near the 1250 to 1260 level where I expect Trading Cycle #2 to top out. Out of the TC2 low, will TC3 make a higher high? It may well be possible but Time will tell…

….related:
Is the Gold Silver Ratio Predictive?
About Surf City
Surf City is 60-year-old retired Information Technology Executive and Software start-up Entrepreneur living near the beach in California. He has been an active investor and trader since the mid-1980s. Analytical by nature, his sound investments over the years allowed him to retire at a relatively early age of 55.
In addition to the standard Technical Analysis tools of Edwards and Magee, Surf is a disciple of Walter Bressert’s Cycle Methodology and Stan Weinstein’s Stage 4 Market annalysis. Surf combines these skills to develop his unique “Cycle Price Channels.” Some call them “Surf’s ForkCycles.”
In addition to Bressert, Surf also utilizes the Gann expertise of his colleague, Norvast to collaborate on possible turn dates. The combination of Bressert and Gann Cycle methodologies along with Surf’s Price Channels allow the Subscribers to “Visualize” where Surf feels price is likely heading, topping or bottoming.
Surf is also an avid teacher and mentor who enjoys helping others learn the tools of the trade.
Surf’s Up, Ride the Wave!
Copyright; © 2017 Surf City


-
I know Mike is a very solid investor and respect his opinions very much. So if he says pay attention to this or that - I will.
~ Dale G.
-
I've started managing my own investments so view Michael's site as a one-stop shop from which to get information and perspectives.
~ Dave E.
-
Michael offers easy reading, honest, common sense information that anyone can use in a practical manner.
~ der_al.
-
A sane voice in a scrambled investment world.
~ Ed R.
Inside Edge Pro Contributors

Greg Weldon

Josef Schachter

Tyler Bollhorn

Ryan Irvine

Paul Beattie

Martin Straith

Patrick Ceresna

Mark Leibovit

James Thorne

Victor Adair