
Real Estate
A forecast by Ozzie comes true with a 19% decline in Vancouver housing prices. The number of sales of single family dwellings is down tremendously and buyers are moving to different classes of dwellings
…..also Mike’s Goofy: Extremism Play-doh & Coloring Books


Stock Trading Alert originally sent to subscribers on February 13, 2017, 6:56 AM.
Briefly: In our opinion, speculative short positions are favored (with stop-loss at 2,330, and profit target at 2,150, S&P 500 index).
Our intraday outlook remains bearish, and our short-term outlook is bearish. Our medium-term outlook remains neutral, following S&P 500 index breakout above last year’s all-time high:
Intraday outlook (next 24 hours): bearish
Short-term outlook (next 1-2 weeks): bearish
Medium-term outlook (next 1-3 months): neutral
Long-term outlook (next year): neutral
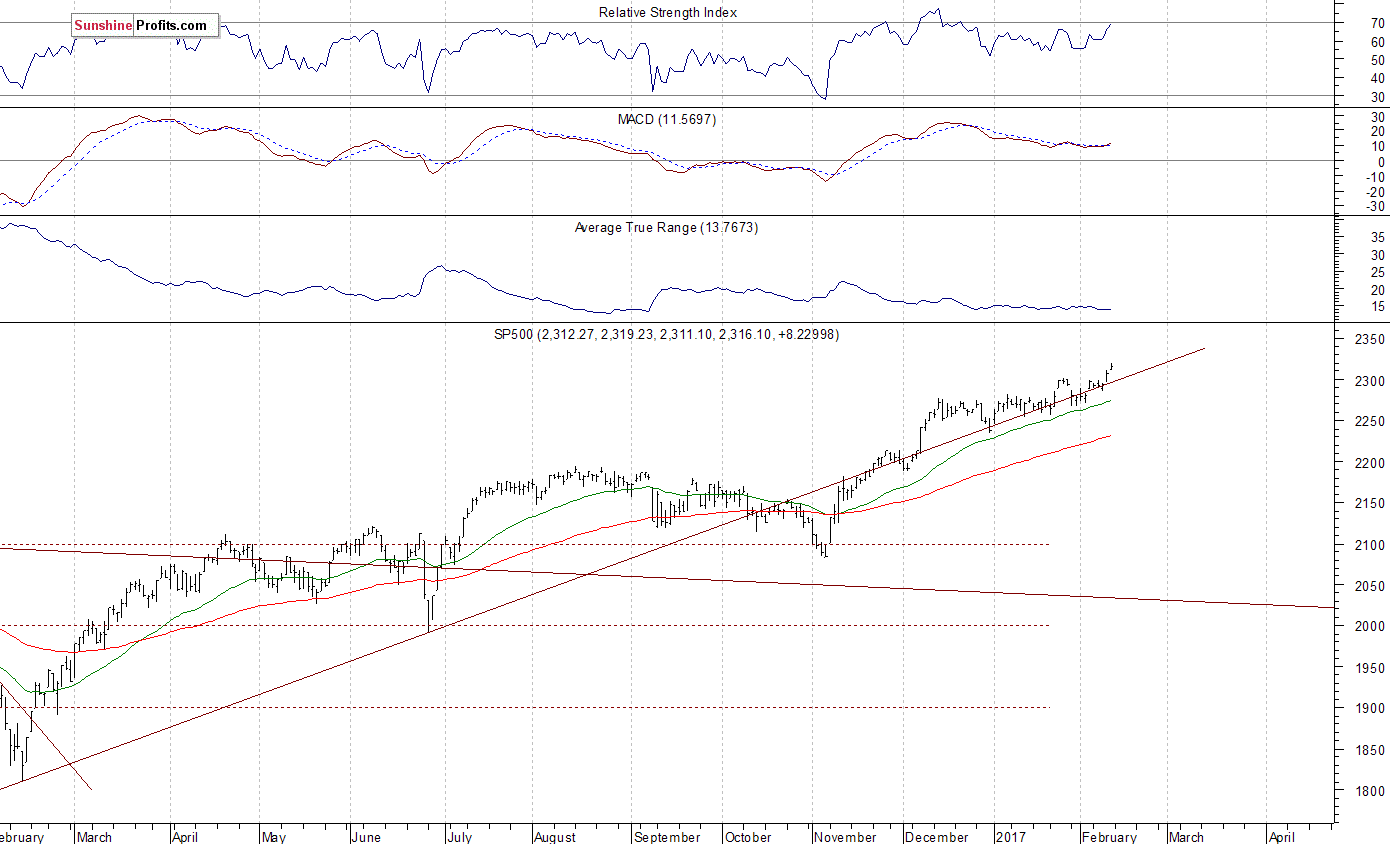
The U.S. stock market indexes gained between 0.3% and 0.5% on Friday, extending their short-term uptrend, as investors’ sentiment remained bullish following quarterly earnings, tax cut plan, economic data releases, among others. The S&P 500 index has reached new all-time high at the level of 2,319.23. The Dow Jones Industrial Average continues to trade above support level of 20,000, and the technology Nasdaq Composite Index is now above the level of 5,700. All three major indexes trade at new record highs. Will the market extend its year-long medium-term uptrend even further before some more meaningful downward correction? The nearest important level of support of the S&P 500 index is at 2,300-2,310, marked by previous level of resistance and Friday’s daily gap up of 2,311.08-2,311.10. The next support level is at around 2,285-2,290, marked by last week’s Friday’s daily gap up of 2,283.97-2,287.88. We can see some short-term volatility following November – January move up. Is this a topping pattern before downward reversal? The S&P 500 index still trades along medium-term upward trend line, as we can see on the daily chart:
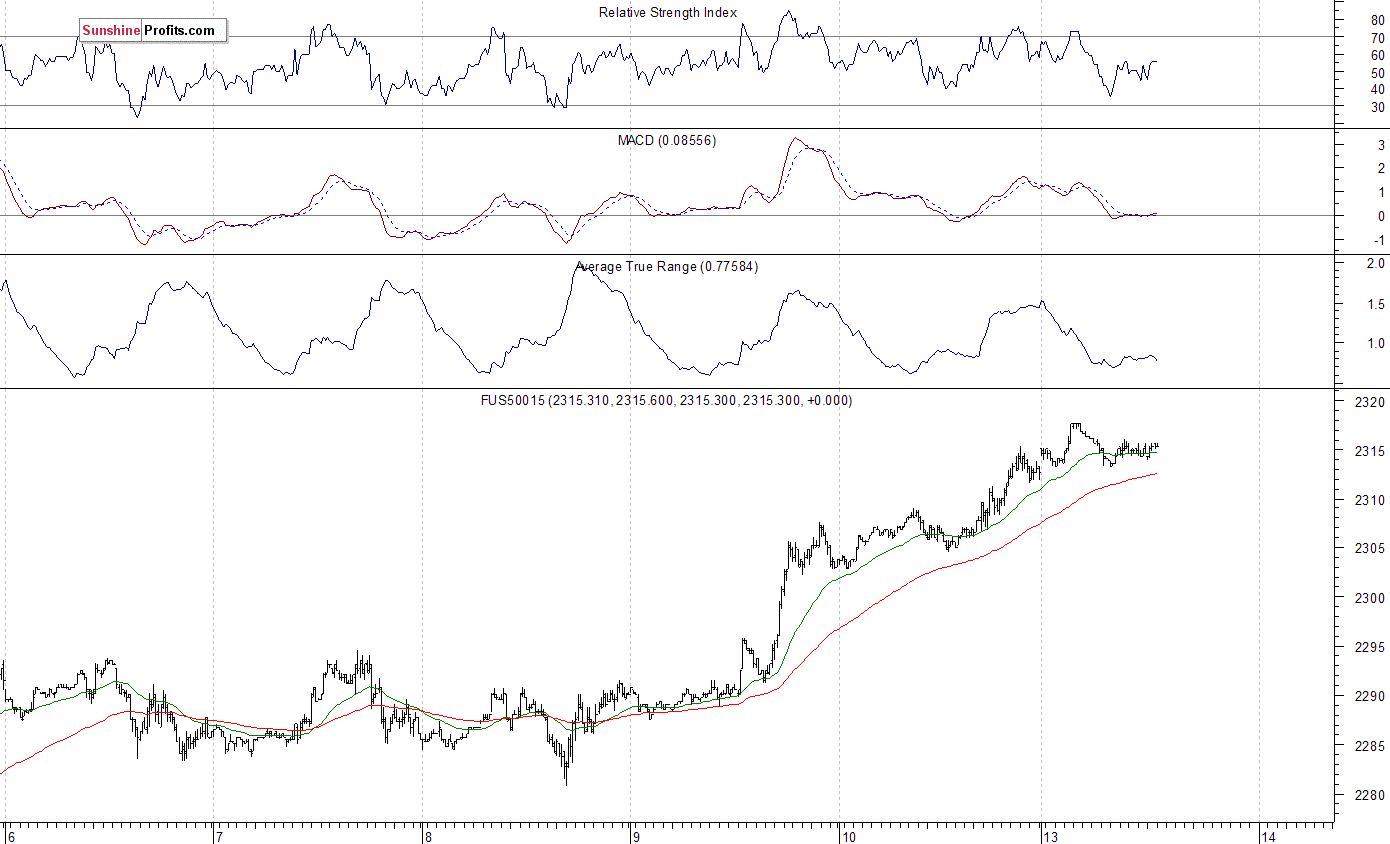
Expectations before the opening of today’s trading session are slightly positive, with index futures currently up 0.1-0.2%. The European stock market indexes have gained 0.1-0.9% so far. Investors will wait for more quarterly corporate earnings releases, tomorrow’s and Wednesday’s inflation data, Retail Sales, Industrial Production releases, among others. The S&P 500 futures contract trades within an intraday consolidation following last week’s move up. The nearest important level of support is at around 2,300, marked by previous level of resistance. The next support level remains at 2,280-2,285. On the other hand, resistance level is at 2,315-2,320, marked by new record high. There have been no confirmed negative signals so far. However, we can see some short-term overbought conditions, along with negative technical divergences. Is this a topping pattern or just an intraday consolidation before another leg up?
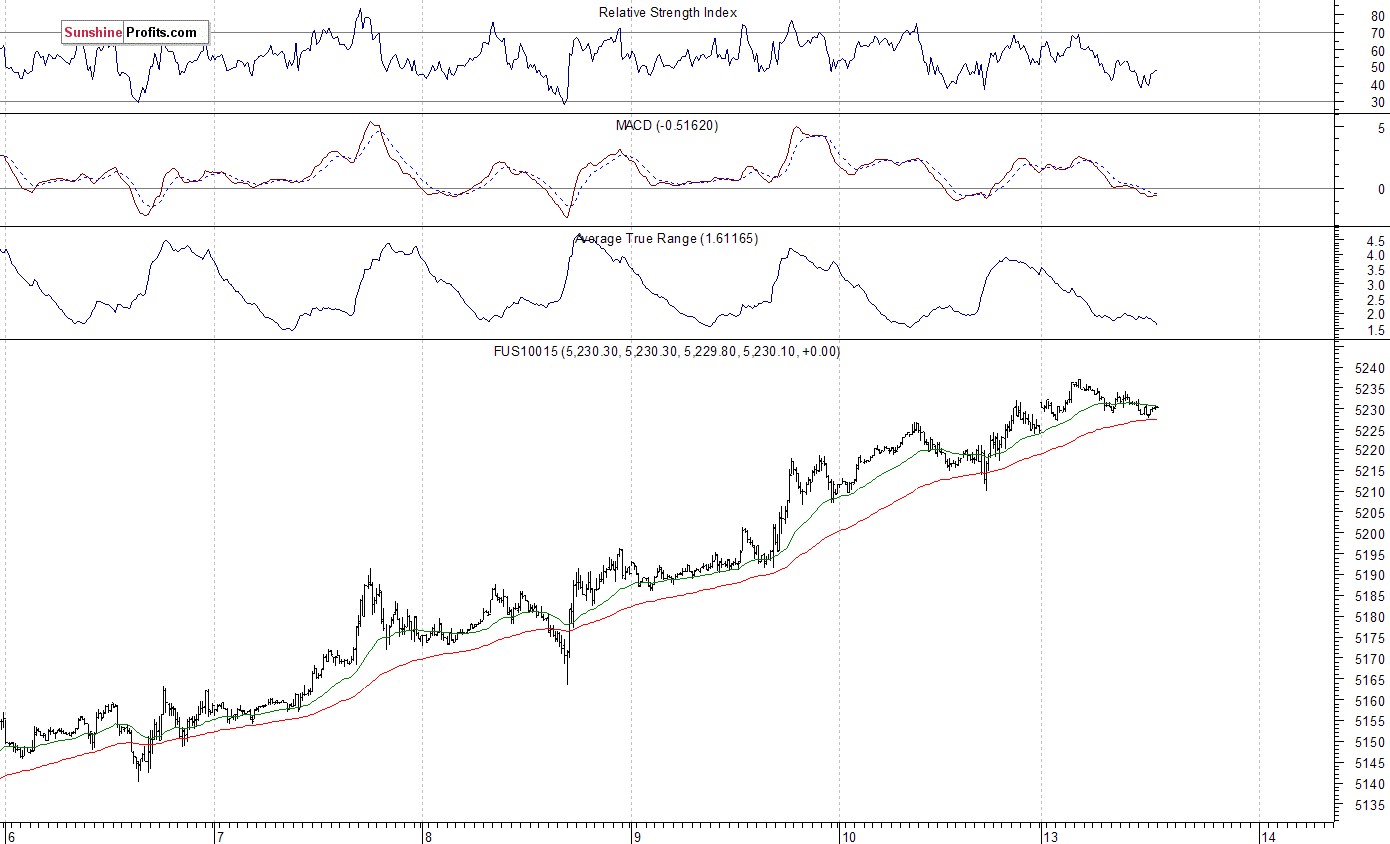
The technology Nasdaq 100 futures contract follows a similar path, as it currently trades within an intraday consolidation after last week’s rally. It has reached new all-time high above the level of 5,235. The technology sector stocks have been relatively stronger than the broad stock market recently following better-than-expected quarterly earnings releases. The nearest important support level is at 5,200, marked by previous level of resistance, and the next support level is at around 5,180, among others. The market trades along new all-time highs, as the 15-minute chart shows:
Concluding, the broad stock market continued its short-term uptrend on Friday, as the S&P 500 index reached new record high close to the level of 2,320. Will the uptrend extend even further? Or is this some topping pattern before a downward correction? There have been no confirmed negative signals so far. However, we still can see medium-term overbought conditions accompanied by negative technical divergences. Therefore, we continue to maintain our speculative short position (opened on December 14 at 2,268.35 – daily opening price of the S&P 500 index). Stop-loss level remains close to current market price, at 2,330 and potential profit target is at 2,150 (S&P 500 index). You can trade S&P 500 index using futures contracts (S&P 500 futures contract – SP, E-mini S&P 500 futures contract – ES) or an ETF like the SPDR S&P 500 ETF – SPY. It is always important to set some exit price level in case some events cause the price to move in the unlikely direction. Having safety measures in place helps limit potential losses while letting the gains grow.
To summarize: short position in S&P 500 index is justified from the risk/reward perspective with the following entry prices, stop-loss orders and profit target price levels:
S&P 500 index – short position: profit target level: 2,150; stop-loss level: 2,330
S&P 500 futures contract (March 2017) – short position: profit target level: 2,145; stop-loss level: 2,325
SPY ETF (SPDR S&P 500, not leveraged) – short position: profit target level: $214.5; stop-loss level: $232.5 (updated)
SDS ETF (ProShares UltraShort S&P500, leveraged: -2x) – long position: profit target level: $16.35; stop-loss level: $14.00 (calculated using trade’s opening price on Dec 14 at $14.78).
Thank you.
Paul Rejczak
Stock Trading Strategist
Stock Trading Alerts

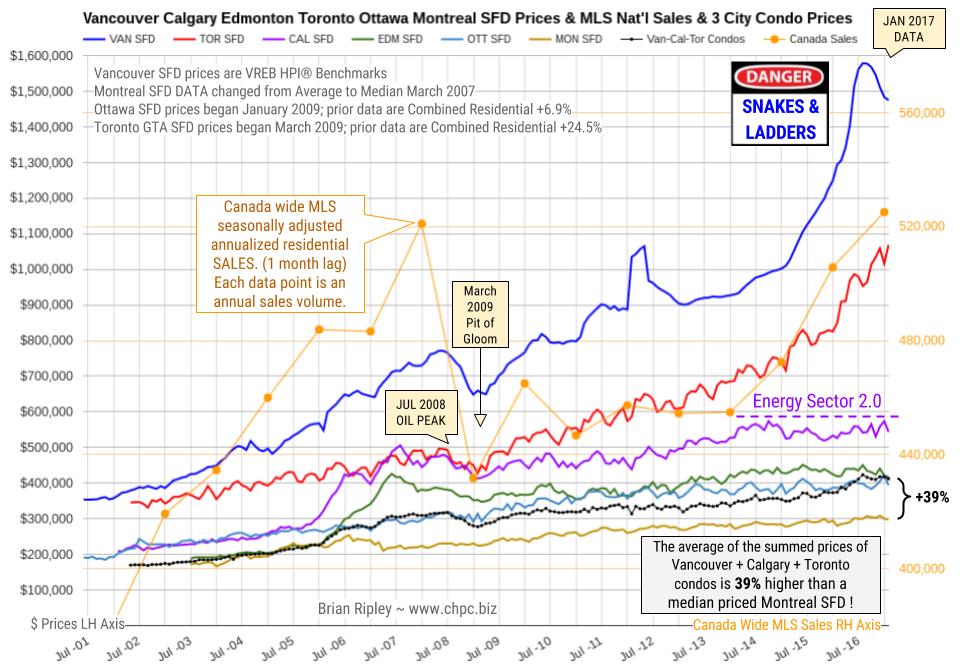 1. Canada 6-City Housing Prices Slide Off Their Highs
In January 2017 Canada’s big city metro SFD prices coiled about or slid off their near term highs except in Toronto where detached houses and town houses fetched new peak prices.
2. Why you shouldn’t fear rising interest rates …
“the notions that rising interest rates will kill off equity market gains, particularly in the U.S. … or choke off a real estate recovery … or kill the gold market for good — are myths. Period”
3. Extreme Readings in the Bond Market
Janet Yellen, you’re fired!
For the past 20-30 years, the Federal Reserve has been dominated by academics largely out of MIT. Jim Bianco at Bianco Research says that’s all going to change under Trump, starting with Fed chair Janet Yellen.

 Education is a BIG part of a having a Plan B… especially when it comes to money.
In light of the obvious risks that we discuss on a regular basis, safeguarding (and growing) our savings is absolutely critical.
Finance can be a little bit scary and seem quite complicated at first.
No one comes out of the womb a financial expert. And they certainly don’t teach this stuff in a government-controlled public school system.
But just like speaking a foreign language or learning to drive, knowing how to properly manage money is a SKILL.
And it’s one that can be learned. By ANYONE.
The difference between knowing versus NOT knowing how to manage money can have an EXTRAORDINARY impact on your life.
Simply being able to generate an extra 1% to 2% annual return on your investments can add up to hundreds of thousands of dollars in extra wealth over 20-30 years.
As with any other skill, learning about finance takes some time and patience. But the reward is extraordinary.
I wanted to pass along an email today that highlights key characteristics of the world’s most successful long-term investment strategy.
It was written by my friend and colleague Tim Price, a UK-based wealth manager who is a disciplined master of “value investing”.
This strategy is absolutely worth understanding. Learning it can truly have an enormous impact on your life.
— From Tim: —
Successful investing involves having an edge.
And if you do not know what your edge is, you do not have one.
So which investment strategy actually works?
 With the Dow hitting new all-time highs and the U.S. dollar strengthening, this is how crazy the situation is across the globe.
Here is what Peter Boockvar wrote today as the world awaits the next round of monetary madness: There has been a distinct disparity between the Investors Intelligence measure of stock market sentiment which survey’s newsletter writers and the AAII survey of individual investors. As stated yesterday, newsletter writers are euphoric…..
…related from KingWorldNews:
Is The Public About To Get Torched In A Stock Market Plunge? The Answer Will Shock You


-
I know Mike is a very solid investor and respect his opinions very much. So if he says pay attention to this or that - I will.
~ Dale G.
-
I've started managing my own investments so view Michael's site as a one-stop shop from which to get information and perspectives.
~ Dave E.
-
Michael offers easy reading, honest, common sense information that anyone can use in a practical manner.
~ der_al.
-
A sane voice in a scrambled investment world.
~ Ed R.
Inside Edge Pro Contributors

Greg Weldon

Josef Schachter

Tyler Bollhorn

Ryan Irvine

Paul Beattie

Martin Straith

Patrick Ceresna

Mark Leibovit

James Thorne

Victor Adair