
Wealth Building Strategies
 Listen to advice and accept instruction, that you may gain wisdom in the future. – Proverbs 19:
One thing I would like to add is that not all advice is good advice, so it’s vital to filter out the noise from the facts. One of the easiest ways is to follow, listen and learn from people who have or are walking the successful path.
Finding an edge is something that we all want.
Investing is a zero sum game so when you are buying, there is a person on the other end who is selling.
How do you know that you’re correct?
By listening to wise counsel.
The path forward is never clear, but with the advice and guidance by value investing greats, it makes is easier to march forward.
Take these words of wisdom on finding an edge from people considered masters in value investing.
(Courtesy of Value Investor Insight)
Human beings are subject to wild swings in their levels of fear, risk tolerance and greed. That won’t change. I base my whole approach on buying when others are fearful and selling when others are greedy. The reason Shakespeare is so relevant still today is that his plays were all about human nature, and human nature never changes.
– Mark Sellers
…continue reading 13 more “Words of Wisdom” HERE
…also:
17 Managed Funds That Have Beaten the Indexes Over a 17 Year Period

Stock Trading Alert originally sent to subscribers on February 9, 2017, 6:56 AM.
Briefly: In our opinion, speculative short positions are favored (with stop-loss at 2,330, and profit target at 2,150, S&P 500 index).
Our intraday outlook remains bearish, and our short-term outlook is bearish. Our medium-term outlook remains neutral, following S&P 500 index breakout above last year’s all-time high:
Intraday outlook (next 24 hours): bearish
Short-term outlook (next 1-2 weeks): bearish
Medium-term outlook (next 1-3 months): neutral
Long-term outlook (next year): neutral
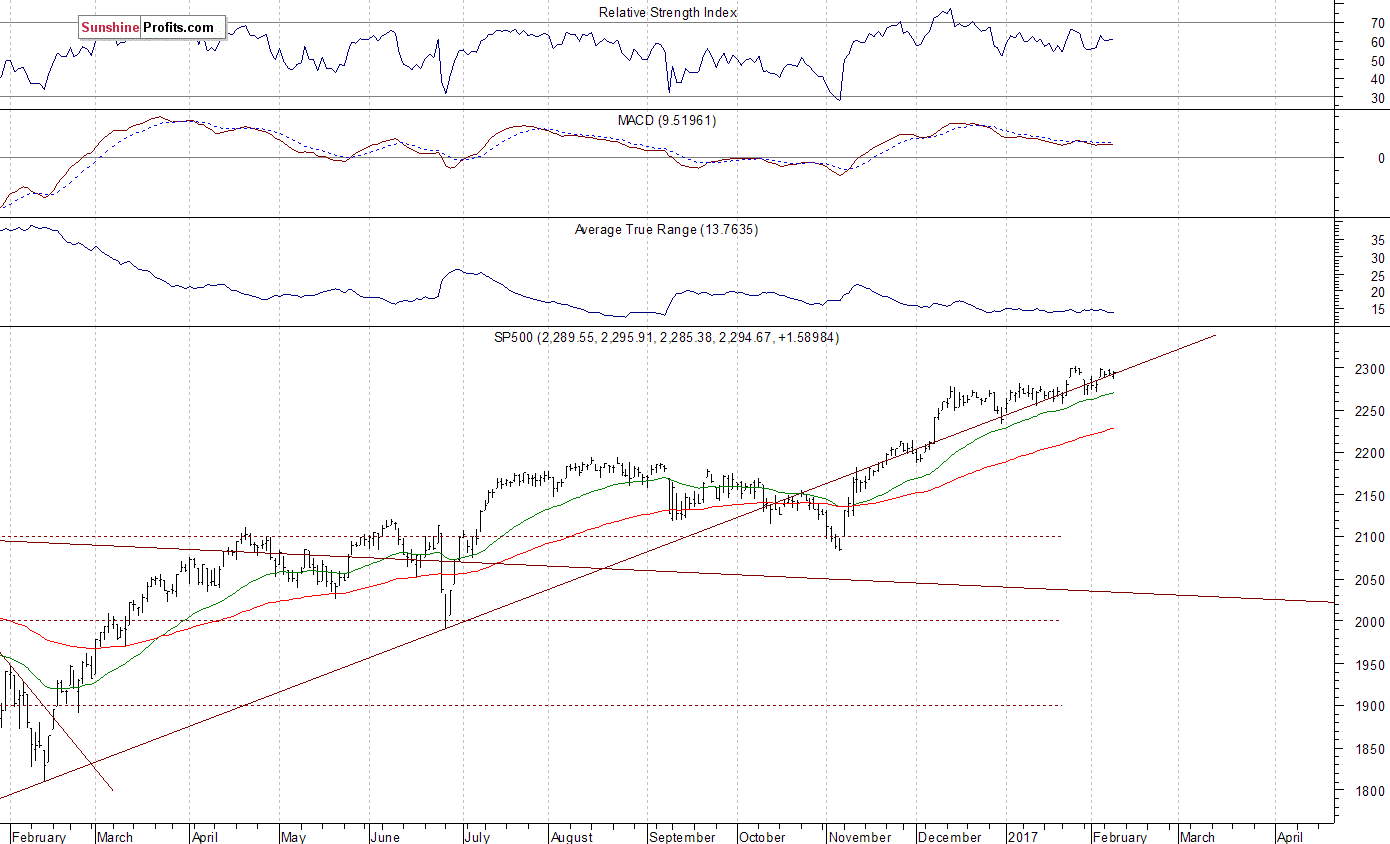
The U.S. stock market indexes were mixed between -0.2% and +0.2% on Wednesday, extending their short-term consolidation along record highs, as investors continued to hesitate following last week’s Friday’s rally. The S&P 500 index remains close to its January 26 all-time high of 2,300.99. It is also above its last week’s Monday’s daily gap down of 2,286.01-2,291.62. The Dow Jones Industrial Average is above 20,000 mark, and the technology Nasdaq Composite Index is close to the level of 5,700. Will the market extend its year-long medium-term uptrend even further before some more meaningful downward correction? The nearest important resistance level of the S&P 500 index is currently at around 2,300 marked by record high. On the other hand, level of support is at around 2,285-2,290, marked by Friday’s daily gap up of 2,283.97-2,287.88. The next support level is at 2,260-2,270, among others. We can see some short-term volatility following November – January move up. Is this a topping pattern before downward reversal? The S&P 500 index still trades along medium-term upward trend line, as we can see on the daily chart:
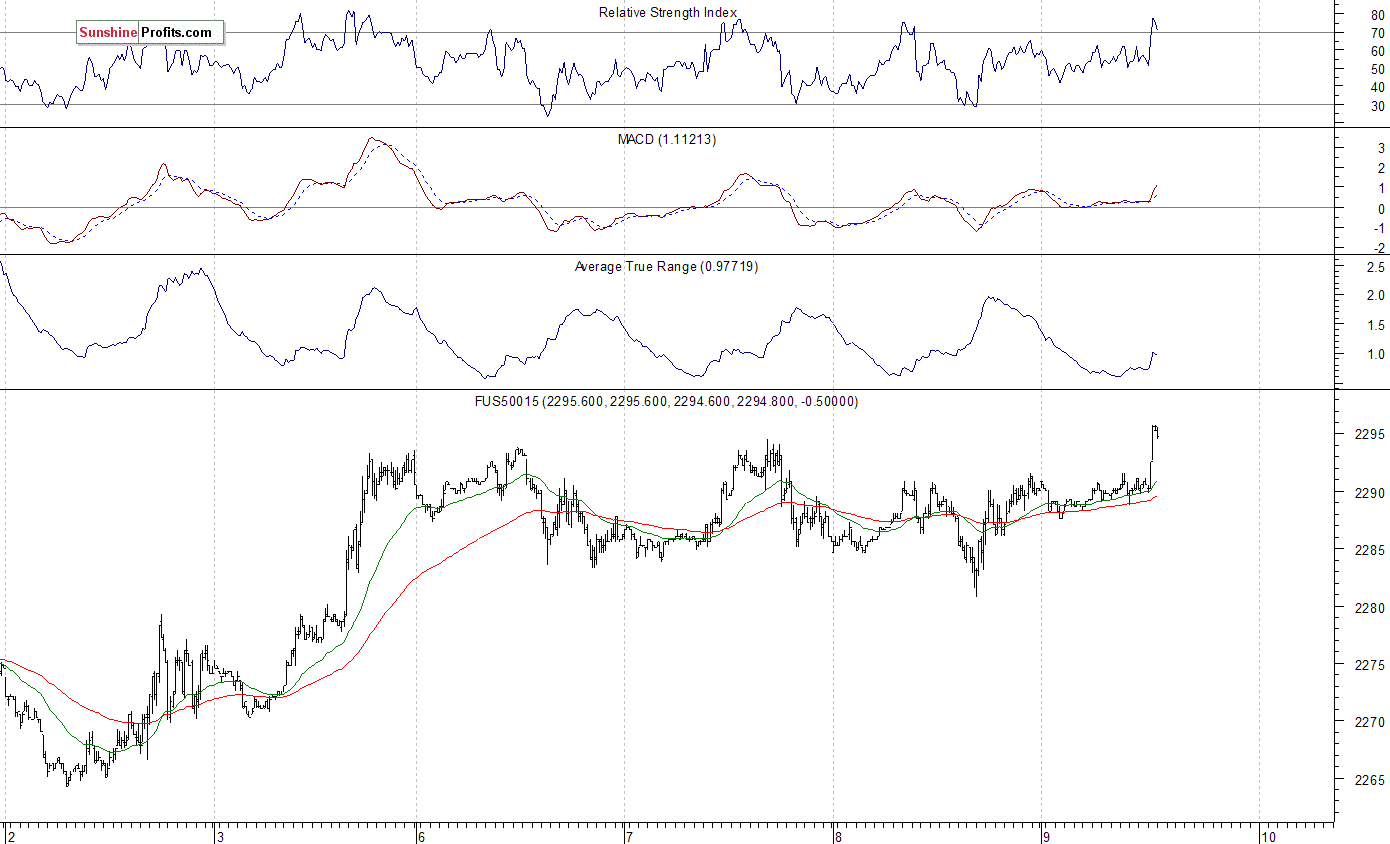
Expectations before the opening of today’s trading session are positive, with index futures currently up 0.2%. The European stock market have gained 0.3-0.9% so far. Investors will wait for more quarterly corporate earnings releases. They will also wait for some economic data announcements: Initial Claims at 8:30 a.m., Wholesale Inventories at 10:00 a.m. The market expects that the Wholesale Inventories grew 1.0% in December. The S&P 500 futures contract trades within an intraday uptrend, as it breaks above its short-term consolidation, following overnight fluctuations along the level of 2,290. The nearest important level of resistance is at around 2,300, marked by record high. On the other hand, support level is at around 2,280-2,285, and the next support level is at 2,260-2,270, marked by previous consolidation. The market is getting close to new all-time highs. The futures contract broke above its recent consolidation along the level of 2,270, as the 15-minute chart shows:
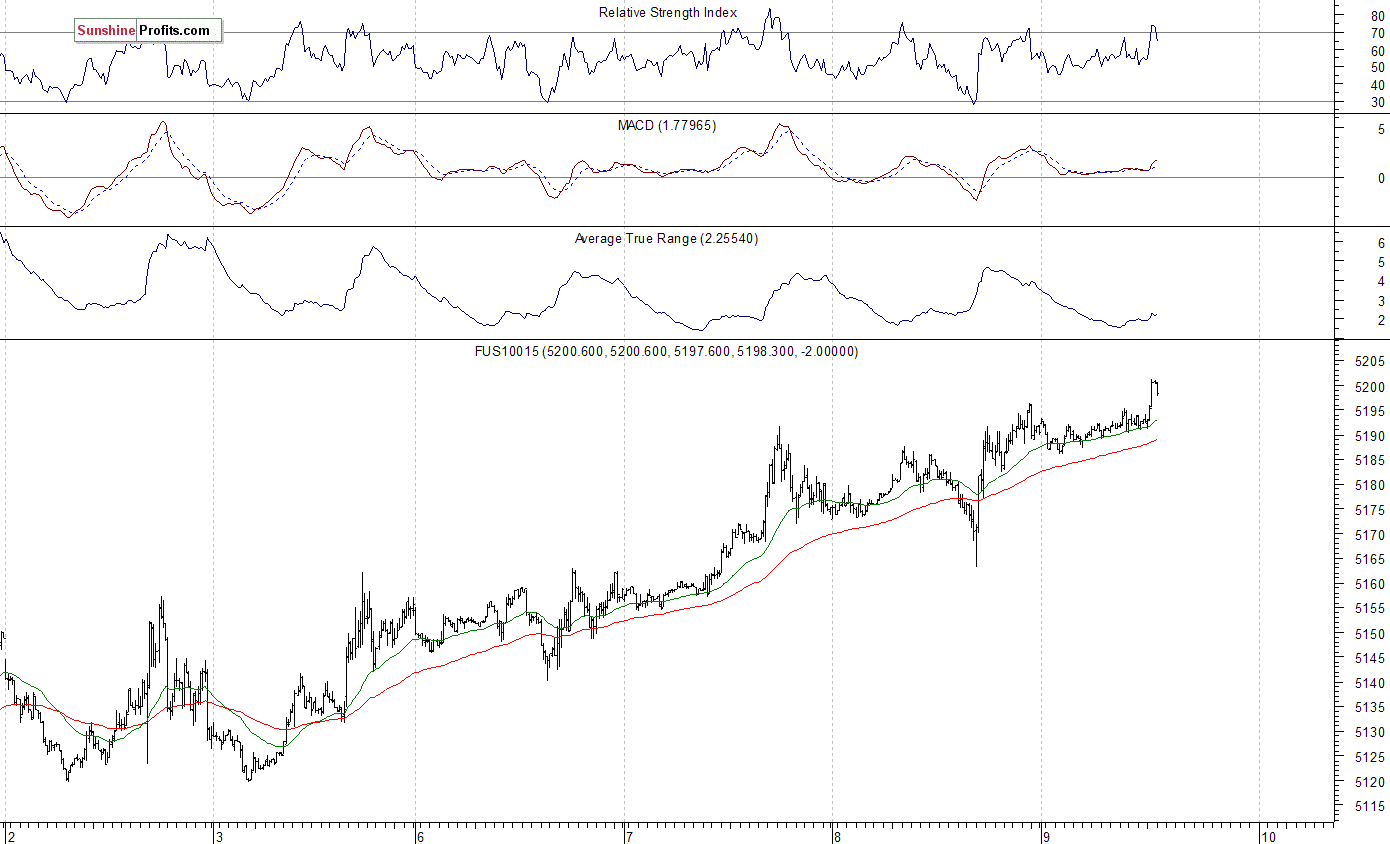
The technology Nasdaq 100 futures contract follows a similar path, as it currently trades within an intraday uptrend after an overnight consolidation. It reaches new all-time high above the level of 5,200. The technology sector stocks have been relatively stronger than the broad stock market recently following better-than-expected quarterly earnings releases. The nearest important support level is at 5,180-5,185, marked by previous level of resistance, and the next support level is at around 5,170, among others. There have been no confirmed negative signals so far. However, we can see short-term overbought conditions.
Concluding, the broad stock market remained within its short-term consolidation on Wednesday, following last week’s Friday’s move up. Will the index continue higher today? Is this just a short-term consolidation after three-month long rally from Presidential Elections’ local low in November of 2016? Or is this some topping pattern ahead of some more meaningful downward correction? Potential upside seems limited, and the S&P 500 index may retrace some of its November – January uptrend. It may even reverse its year-long uptrend, as investors’ sentiment readings remain very bullish. We still can see medium-term overbought conditions accompanied by negative technical divergences. Therefore, we continue to maintain our speculative short position (opened on December 14 at 2,268.35 – daily opening price of the S&P 500 index). Stop-loss level remains at 2,330 and potential profit target is at 2,150 (S&P 500 index). You can trade S&P 500 index using futures contracts (S&P 500 futures contract – SP, E-mini S&P 500 futures contract – ES) or an ETF like the SPDR S&P 500 ETF – SPY. It is always important to set some exit price level in case some events cause the price to move in the unlikely direction. Having safety measures in place helps limit potential losses while letting the gains grow.
To summarize: short position in S&P 500 index is justified from the risk/reward perspective with the following entry prices, stop-loss orders and profit target price levels:
S&P 500 index – short position: profit target level: 2,150; stop-loss level: 2,330
S&P 500 futures contract (March 2017) – short position: profit target level: 2,145; stop-loss level: 2,325
SPY ETF (SPDR S&P 500, not leveraged) – short position: profit target level: $214; stop-loss level: $232
SDS ETF (ProShares UltraShort S&P500, leveraged: -2x) – long position: profit target level: $16.35; stop-loss level: $14.00 (calculated using trade’s opening price on Dec 14 at $14.78).
Thank you.
Paul Rejczak
Stock Trading Strategist
Stock Trading Alerts
….related: VIX Update: Has Volatility Bottomed?

 Longtime readers of Outside the Box know that I am a fan of Dr. Lacy Hunt of Hoisington Investment Management. Lacy and his partner, Van Hoisington, produce a quarterly letter that is a must-read for me, as it reliably informs my thinking in a world drowning in conventional economics – economics that seem to continually miss the mark.
It almost goes without saying that Lacy will be speaking at our Strategic Investment Conference again this year, and he’s just one of a long (and still-lengthening) list of top-flight speakers. Learn more and reserve your chair, right here.
Today’s OTB is one of the most important pieces Van and Lacy have written in a long time. They establish that the proposed tax reforms will face enormous headwinds that were not there during previous tax-reform eras, which means that the benefits that Republicans think will accrue are likely to take longer to appear and be less than expected, which will mean that it is going to take more than what is presently proposed to jump-start the economy.
A few readers have asked me whether I am still a deficit hawk. The answer is, “Yes, more than ever,” because total debt has now rendered both monetary and fiscal policy much less effective. Debt, as Lacy and Van clearly show, is an impediment to growth.
There are other issues impeding growth, such as the ten million men between ages 24-64 who are not in the work force, a condition that has been steadily worsening for 40 years. It’s not just a recent phenomenon, but it must be addressed. These are men who have chosen to not participate for one reason or another and are perforce a drain on overall GDP growth.
And let’s not forget that for the last nine years we have seen more businesses close than be created, which has certainly affected GDP.
Tax reform is fine, but far more structural change is necessary if growth is to return. I will be writing on that topic over the next few weeks. But today we appreciate the work of Lacy and Van.
I find myself writing this introduction on yet another plane on my way to speak at the Orlando MoneyShow. If things work out, I will have dinner with Larry Kudlow, and I hope Art Laffer makes it as well. I’ll test out some of my recent ideas on them.
This week in Thoughts from the Frontline I’ll be looking at the good things (and there are a lot of them) in the proposed tax reforms, before we deal with the problems the following week.
Your not trying to miss the forest for the trees analyst,

John Mauldin, Editor
Outside the Box
JohnMauldin@2000wave.com
Hoisington Quarterly Review and Outlook – 4Q2016
CHANGE?
The 2016 presidential election has brought about widely anticipated changes in fiscal policy actions. First, tax reductions for both the household and corporate sectors along with a major reform of the tax code have been proposed. In conjunction, a novel program of tax credits to the private sector has been discussed to finance increased outlays for infrastructure. Second, provisions have been suggested to incentivize domestic corporations to repatriate $2.6 trillion of liquid assets held overseas. Third, there is talk of regulatory reform along with measures to increase domestic production of energy. Finally, various measures related to international trade have been discussed in an effort to reduce the current account deficit.
Judging by sharp reactions of U.S. capital and currency markets, success of these proposals has been quickly accepted. Such was the case with the fiscal stimulus package of 2009, as well as with Quantitative Easings 1 and 2; initially there were highly favorable market reactions. In these cases the rush to judgment was misplaced as widespread economic gains did not occur, and the U.S. experienced the weakest expansion in seven decades along with lower inflation. It could be that the fundamental analytical mistake now, like then, is to assume that the economy is “an understandable and controllable machine rather than a complex, adaptive system” (William R. White, in his 2016 Adam Smith Lecture “Ultra-Easy Money: Digging the Hole Deeper?” at the annual meeting of the National Association of Business Economists). While many of the aforementioned proposals include pro-growth features, it appears that there is an underestimation of the nega tive impact of delayed implementation and other lags. Additionally, the risks of unintended adverse consequences and outright failure are high, especially if the enacted programs are heavily financed with borrowed funds and/or monetary conditions continue to work at cross purposes with the fiscal policy goals.
Tax Cuts and Credits
Considering the current public and private debt overhang, tax reductions are not likely to be as successful as the much larger tax cuts were for Presidents Ronald Reagan and George W. Bush. Gross federal debt now stands at 105.5% of GDP, compared with 31.7% and 57.0%, respectively, when the 1981 and 2002 tax laws were implemented. Additionally, tax reductions work slowly, with only 50% of the impact registering within a year and a half after the tax changes are enacted. Thus, while the economy is waiting for increased revenues from faster growth from the tax cuts, surging federal debt is likely to continue to drive U.S. aggregate indebtedness higher, further restraining economic growth.
The key variable to improve domestic economic conditions is to cut the marginal household (middle income) and corporate income tax rates. Due to the extremely high level of federal debt, if the deleterious impact of higher debt on growth is to be avoided, then these tax cuts must be expenditure-balanced to the fullest extent possible along with reductions in federal spending (which has a negative multiplier).
Providing tax credits to the private sector to build infrastructure should be more efficient than the current system, but this new system has to first be put into operation and firms with profits must decide to enter this business. Moreover, all the various rights of way, ownership and environmental requirements suggest that any economic growth impact from the infrastructure proposal is well into the future.
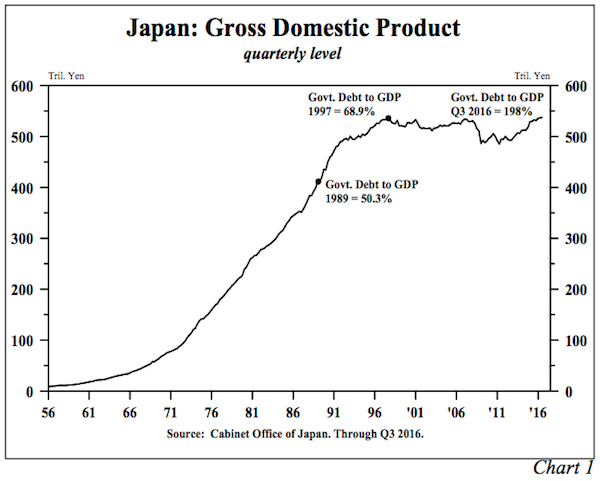
However, if the household and corporate tax reductions and infrastructure tax credits proposed are not financed by other budget offsets, history suggests they will be met with little or no success. The test case is Japan. In implementing tax cuts and massive infrastructure spending, Japanese government debt exploded from 68.9% of GDP in 1997 to 198.0% in the third quarter of 2016. Over that period nominal GDP in Japan has remained roughly unchanged (Chart 1). Additionally, when Japan began these debt experiments, the global economy was far stronger than it is currently, thus Japan was supported by external conditions to a far greater degree than the U.S. would be in present circumstances.
Tax Repatriation
One of the tax proposals with wide support gives U.S. corporations a window to repatriate approximately $2.6 trillion of foreign held profits under the favorable tax terms of 10% or 15%. There is a catch, however. To ensure that all funds are brought home, the tax is due on all of the un-repatriated funds even if only a portion is brought back to the United States.
Several considerations suggest there is no guarantee that these funds will actually be invested in plant and equipment in the United States. First, the fact that they are currently liquid suggests that physical investment opportunities are already lacking. Second, the bulk of the foreign assets are held by three already cash-rich sectors – high tech, pharmaceutical and energy. The concentrated and liquid nature of these assets suggests that after an estimated $260 billion to $390 billion in taxes are paid, the repatriated funds will probably be shifted into share buybacks, mergers, dividends or debt repayments. Putting funds into financial engineering will improve earnings per share, further raising equity valuations for individual firms; however, such transactions will not grow the economy. Finally, the basic determinants of capital spending have been unfavorable, and they worsened in the fourth quarter. Capacity utilization was only 75% in November 2016, well below the peak of just under 79% reached exactly two years earlier. The U.S. Treasury’s corporate income tax collections for the twelve months ended November 2016 were 13.1% less than a year earlier, suggesting corporate profits eroded considerably last year.
A possible additional negative result of the repatriation is that those assets denominated in foreign currency, estimated to be 10% to 30%, will need to be converted into U.S. dollars. This will place upward pressure on the dollar, reinforcing the loss of market share of U.S. firms in domestic and foreign markets. Tax repatriation was tried on a smaller scale during the Bush 43 administration in 2005-2006 with limited success. A much smaller amount of funds were repatriated, and the dollar showed strength.
Regulatory Reform
Regulatory reform could create increased energy production which would clearly boost real economic activity. This is accomplished by shifting the upward sloping aggregate supply curve outward and thereby lowering inflation. When the aggregate supply curve shifts, it will intersect with the downward sloping aggregate demand curve at a lower price level and a higher level of real GDP. The falling prices are equivalent to a tax cut that is not financed with more federal debt. Regulatory reform is a strong proposal and will benefit the economy greatly, in time, by making the U.S. more efficient and better able to compete in world markets. However, these benefits are likely to build slowly and accrue over time. Without question, the regulatory reform is the most unambiguously positive aspect of the contemplated fiscal policy changes since it will produce faster growth and lower inflation. Since bond yields are very sensitive to inflationary expectations, this program would actually contribute to lower interest costs as the disinflationary aspects of the program become apparent.
International Trade Actions
Proposals to cut the trade deficit by tariffs or import restrictions would have the exact opposite effect of the regulatory reforms and increased energy production. They would shift the aggregate supply curve inward, resulting in a higher price level and a lower level of real GDP. Any improvement in the trade account would reduce foreign saving, which is the inverse of the trade account. Since investment equals domestic and foreign saving, the drop in saving would force consumer spending and/or investment lower. Any improvement in the trade account would be limited since the dollar would rise, undermining the first round gains in trade. The more serious risk is that other countries retaliate. From the mid-1920s until the start of WWII this process resulted in what is known as “a deflationary race to the bottom”.
IMPEDIMENTS TO GROWTH
Over the past few months interest rates and the value of the dollar have risen sharply, and monetary policy’s quantitative indicators have contracted. These monetary restrictions have worsened the structural impediments to U.S. economic growth that existed before the election and continue today. These impediments include: (1) a record level of domestic nonfinancial sector debt relative to GDP and further increases in federal debt that are already built-in for years to come; (2) record global debt relative to GDP; (3) weak and fragile global economic growth resulting from the debt overhang; (4) adverse demographics; and (5) exhaustion of pent-up demand in the domestic economy.
Monetary Restrictions
If monetary conditions are tightened and interest rates continue to rise, economic growth from tax reductions are likely to prove ephemeral. Monetary conditions have turned more restrictive in the broadest terms over the past year and a half. The monetary base and excess reserves of the depository institutions have been reduced by $668 billion (16.4%) and $910 billion (33.7%), respectively, from the peaks reached in 2014 or as the Fed was ending QE3 (Chart 2). This reduction in reserves is in fact an overt tightening of monetary policy, which will restrain economic activity in a meaningful way in the quarters ahead.
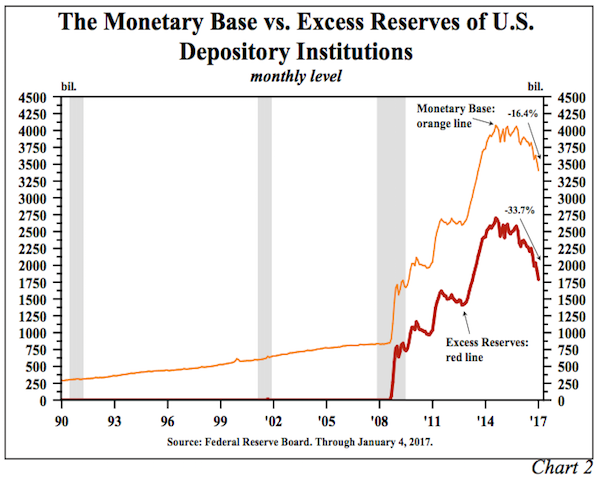
While maintaining the existing large portfolio of treasury and agency securities, the Federal Reserve has engineered contractions in the base and excess reserves by taking advantage of swings in other components of the base. The decrease in the reserve aggregates since 2014 reflects the following developments: (a) the substantial shift in Treasury deposits from depository institutions into the Federal Reserve Banks; (b) an increase in reverse repurchase agreements; (c) a shift from currency in the vaults of depository institutions to nonbanks (i.e. the households and businesses); and (d) a rise in required reserves as a result of higher bank deposits. These changes were necessitated by the Fed’s decision to raise the federal funds rate by 25 basis points in December of both 2015 and 2016. The Fed had the power to offset the reserve-draining effects of the shifting Treasury balances as well as the need for more currency and required reserves, but they chose not t o do so. The cause of the sharp drop in monetary and excess reserves is immaterial, but the effect is that monetary policy became increasingly more restrictive as 2016 ended.
Monetary policy has become asymmetric due to over-indebtedness. This means that an easing of policy produces little stimulus while a modest tightening is very powerful in restraining economic activity. The Nobel laureate Milton Friedman held that through liquidity, income and price effects, (1) monetary accelerations (easing) eventually lead to higher interest rates, and (2) monetary decelerations (tightening) eventually lead to lower rates. (In the near-term monetary accelerations will lower short-term rates and decelerations will raise short-term rates…”the liquidity effect”.) Friedman’s first proposition becomes invalid for extremely indebted economies. When reserves are created by the central bank, even if the amounts are massive, they remain largely unused, rendering monetary policy impotent. That is why M2 growth did not respond to the increase in the monetary base from about $800 billion to over $4 trillion. Plummeting velocity, which reflects too much counterproductive debt, further emasculated the central bank’s effectiveness. Thus, the efficacy of monetary policy has become asymmetric. Excessive debt, rather than rendering monetary deceleration impotent, actually strengthens central bank power because interest expense rises quickly. Therefore, what used to be considered modest changes in monetary restraint that resulted in higher interest rates now has a profound and immediate negative impact on the economy. This is yet another example of the adaptive nature of economies possibly unnoticed by federal officials.
Friedman’s second proposition is clearly in motion. While monetary decelerations may initially lead to higher interest rates the ultimate trend is to lower yields. The Fed’s operations raised short- and intermediate-term yields in 2016. Although Treasury bond yields are mainly determined by inflationary expectations in the long run, the Fed contributed to the elevation of these yields in the second half of 2016 as well as a flattening of the yield curve. Working through both interest rate and quantitative effects, the Fed added to the strength in the dollar, which was further supported by international debt comparisons that favor the United States. The Fed stayed on the tightening course during the fourth quarter as the economy weakened. This suggests that the Fed contributed to both the rise in interest rates and the stronger dollar. More importantly, in view of policy lags, the 2016 measures by the central bank will serve to ultimately weaken M2 growth, reinforce the ongoing slump in money velocity, weaken economic growth in 2017 and accentuate the other constraints previously discussed.
(1) Impediments to Growth: Unproductive Debt
At the end of the third quarter, domestic nonfinancial debt and total debt reached $47.0 and $69.4 trillion, respectively. Neither of these figures include a sizeable volume of vehicle and other leases that will come due in the next few years nor unfunded pension liabilities that will eventually be due. The total figure is much larger as it includes debt of financial institutions as well as foreign debt owed. The broader series points to the complexity of the debt overhang. Netting out the financial institutions and foreign debt is certainly appropriate for closed economies, but it is not appropriate for the current economy. Much of the foreign debt resides in countries that are more indebted than the U.S. with even weaker economic fundamentals and financial institutions that remain thinly capitalized.
A surge in both of the debt aggregates in the latest four quarters indicates the drain on future economic growth. Domestic nonfinancial debt rose by $2.6 trillion in the past four quarters, or $5.00 for each $1.00 dollar of GDP generated. For comparison, from 1952 to 1999, $1.70 of domestic nonfinancial debt generated $1.00 of GDP, and from 2000 to 2015, the figure was $3.30. Total debt gained $3.1 trillion in the past four quarters, or $5.70 dollars for each $1.00 of GDP growth. From 1870 to 2015, $1.90 of total debt generated $1.00 dollar of GDP.
We estimate that approximately $20 trillion of debt in the U.S. will reset within the next two years. Interest rates across the curve are up approximately 100 basis points from the lows of last year. Unless rates reverse, the annual interest costs will jump $200 billion within two years and move steadily higher thereafter as more debt obligations mature. This sum is equivalent to almost two-fifths of the $533 billion in nominal GDP in the past four quarters. This situation is the same problem that has constantly dogged highly indebted economies like the U.S., Japan and the Eurozone. Numerous short-term growth spurts result in simultaneous increases in interest rates that boost interest costs for the heavily indebted economy that, in turn, serves to short circuit incipient gains in economic activity.
(2) Impediments to Growth: Record Global Debt
The IMF calculated that the gross debt in the global non-financial sector was $217 trillion, or 325% of GDP, at the end of the third quarter of 2016. Total debt at the end of the third quarter 2016 was more than triple its level at the end of 1999. In addition to the U.S., global debt surged dramatically in China, the United Kingdom, the Eurozone and Japan. Debt in China surged by $3 trillion in just the first three quarters of 2016. This is staggering considering that the largest rise in nonfinancial U.S. debt over any three quarters is $2.3 trillion, and China accounts for 12.3% of world GDP compared with 22.3% for the U.S. (2016 World Bank estimates). Thus, the $3 trillion jump in Chinese debt is equivalent to an increase of $5.4 trillion of debt in the U.S. economy. Extrapolating this calculation, Chinese debt at the end of the third quarter soared to 390% of GDP, an estimated 20% higher than U.S. debt-to-GDP. This debt surge explains the shortfall in the Chinese growth target for 2016, a major capital flight, a precipitous fall of the Yuan against the dollar and a large hike in their overnight lending rate.
William R. White (as previously cited) describes the debt risks causally, fully and yet succinctly. By pursuing the monetary and fiscal policies in which debts are accumulated worldwide, spending from the future is brought forward to today. “As time passes, and the future becomes the present, the weight of these claims grows ever greater.” Accordingly, such policies lose their effectiveness over time. He quotes Nobel laureate F. A. Hayek (1933): “To combat the depression by a forced credit expansion is to attempt to cure the evil by the very means which brought it about.” White reinforces this view later when he says, “Credit ‘booms’ are commonly followed by an economic ‘bust’ and this has indeed been the case for a number of countries.”
(3) Impediments to Growth: Weak Global Growth
Based on figures from the World Bank and the IMF through 2016, growth in a 60-country composite was just 1.1%, a fraction of the 7.2% average since 1961. Even with the small gain for 2016, the three-year average growth was -0.8%. As such, the last three years have provided more evidence that the benefits of a massive debt surge are elusive.
World trade volume also confirms the fragile state of economic conditions. Trade peaked at 115.4 in February 2016, with September 2016 1.7% below that peak, according to the Netherlands Bureau of Economic Policy Analysis. Over the last 12 months, world trade volume fell 0.7%, compared to the 5.1% average growth since 1992. When world trade and economic growth are stagnant, and one group of currencies loses value relative to another group, market share will shift to the depreciating currencies. However, this shift does not constitute a net gain in global economic activity, merely redistribution. Thus, gains in economic performance of those parts of the world provide little or no information about the status of global economic conditions.
(4) Impediments to Growth: Eroding Demographics
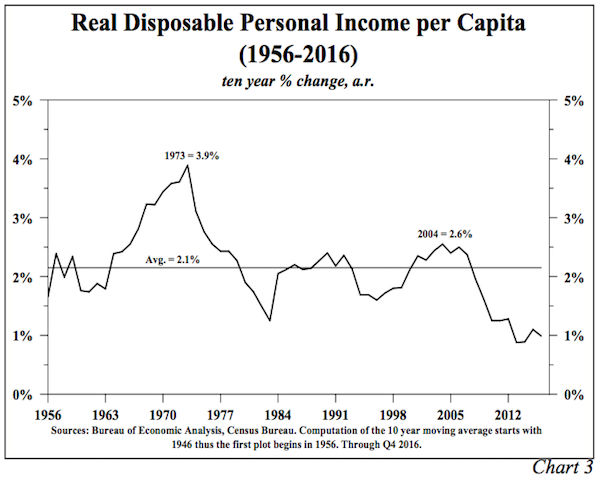
Weak population growth, a baby bust, an aging population and an unprecedented percentage of 18- to 34-year olds living with parents and/or other family members characterize current U.S. demographics, and all constrain economic growth. Moreover, real disposable income per capita is so weak that these trends are more likely to worsen rather than improve (Chart 3).
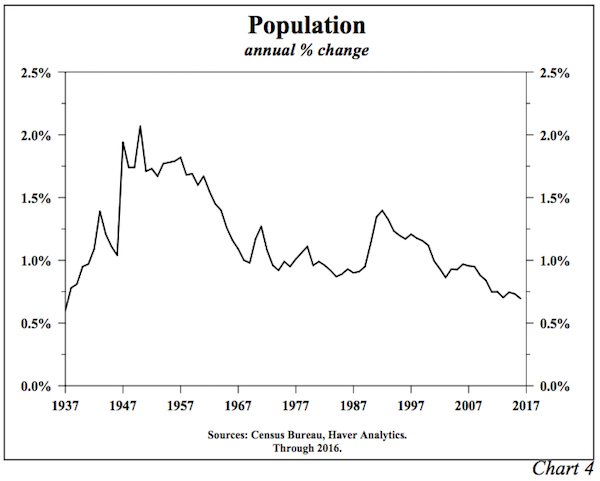
In the fiscal year ending July 1, 2016, U.S. population increased by 0.7%, the smallest increase on record since The Great Depression years of 1936-1937 (Census Bureau) (Chart 4). The fertility rate, defined as the number of live births per 1,000 for women ages 15-44, reached all time lows in 2013 and again in 2015 of 62.9 (National Center for Health Statistics). The average age of the U.S. reached an estimated 37.9 years, another record (The CIA World Fact Book). Population experts expect further increases for many years into the future. For the decade ending in 2015, 39.5% of 18-to 34-year olds lived with parents and/or other family members, the highest percentage for a decade since 1900, with the exception of the one when new housing could not be constructed because the materials were needed for World War II.
Over time, birth, immigration and household formation decisions have been heavily influenced by real per capita income growth. Demographics have, in turn, cycled back to influence economic growth. If they are both rising, a virtuous long-term cycle will emerge. Today, however, a negative spiral is in control. In the ten years ending in 2016, real per capita disposable income rose a mere 1%, less than half of the 50-year average and only one-quarter of the growth of the 3.9% peak reached in 1973. In view of the enlarging debt overhang, which is the cause of these mutually linked developments, economic growth should continue to disappoint. There will likely be intermittent spurts in economic activity, but they will not be sustainable.
(5) Impediments to Growth: Exhausted Pent-Up Demand
In late stage expansions, pent-up demand is exhausted as big-ticket items have already been purchased. At the start of 2017, the current expansion reached its 79th month, more than 20 months longer than the average since the end of World War II. At this stage of the cycle, setting new records is a reason for caution, not optimism. With regard to pent-up demand, the economy is in the opposite condition of a recession or an early stage expansion. The lack of such demand makes the economy susceptible to either slower growth or to the risk of an outright recession. Numerous signposts of this late cycle risk include low factory use, weakness in new and used car prices as well as most discretionary goods, a rising delinquency rate on the riskiest types of vehicle loans and a fall in office and apartment vacancy rates.
Bond Yields
Our economic view for 2017 suggests lower long-term Treasury yields. Considering the actions of the Federal Reserve to curtail the monetary base and excess reserves, M2 growth should moderate to 6% in 2017, down from 6.9% in 2016. In the fourth quarter, on a 3-month annualized basis, M2 growth already decelerated below the 6% pace anticipated for 2017. This is unsurprising given the fall in excess reserves and the monetary base. Velocity fell an estimated 4% in 2016 on a year ending basis. We assume there will be a similar decline for 2017, although in view of the huge debt increase and other considerations, velocity could be even weaker. On this basis, nominal GDP should rise 2% this year, which means inflation and real growth will both be very low. A 2% nominal GDP gain for 2017 points to a similar yield on the 30-year in time, meaning that the secular downward trend in Treasury bond yields is still intact.
Van R. Hoisington
Lacy H. Hunt, Ph.D.
The carnage continues in the U.S. major oil industry as they sink further and further in the RED. The top three U.S. oil companies, whose profits were once the envy of the energy sector, are now forced to borrow money to pay dividends or capital expenditures. The financial situation at ExxonMobil, Chevron and ConocoPhillips has become so dreadful, their total long-term debt surged 25% in just the past year.
Unfortunately, the majority of financial analysts at CNBC, Bloomberg or Fox Business have no clue just how bad the situation will become for the United States as its energy sector continues to disintegrate. While the Federal Government could step in and bail out BIG OIL with printed money, they cannot print barrels of oil.
Watch closely as the Thermodynamic Oil Collapse will start to pick up speed over the next five years.
According to the most recently released financial reports, the top three U.S. oil companies combined net income was the worst ever. The results can be seen in the chart below:
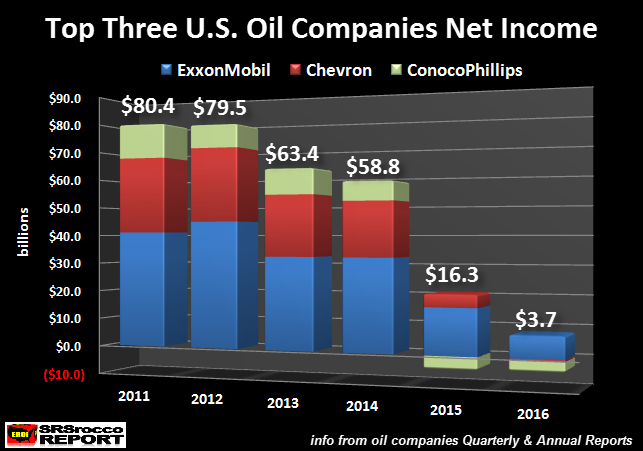
In 2011, ExxonMobil, Chevron and Conocophillips enjoyed a combined $80.4 billion in net income profits. ExxonMobil recorded the highest net income of the group by posting a $41.1 billion gain, followed by Chevron at $26.9 billion, while ConocoPhillips came in third at $12.4 billion.
However, the rapidly falling oil price, since the latter part of 2014, totally gutted the profits at these top oil producers. In just five short years, ExxonMobil’s net income declined to $7.8 billion, Chevron reported its first $460 million loss while ConocoPhillips shaved another $3.6 billion off its bottom line in 2016. Thus, the combined net income of these three oil companies in 2016 totaled $3.7 billion versus $80.4 billion in 2011.
Even though these three oil companies posted a combined net income profit of $3.7 billion last year, their financial situation is much worse when we dig a little deeper. We must remember, net income does not include capital expenditures (CAPEX) or dividend payouts. If we look at these oil companies Free Cash Flow, they have been losing money for the past two years:
Their combined free cash flow fell from a healthy $46.3 billion in 2011 to a negative $8.7 billion in 2015 and a negative $7.3 billion in 2016. Now, their free cash flow would have been much worse in 2016 if theses companies didn’t reduce their CAPEX spending by nearly a whopping $20 billion. I don’t have a chart to show their capital expenditures, but here are some of the annual figures:
Top 3 U.S. Oil Companies Total CAPEX Spending:
2013 = $87.2 billion
2014 = $85.4 billion
2015 = $66.0 billion
2016 = $46.6 billion
The combined CAPEX spending from these three oil companies fell 29% in 2016 versus 2015 and 46% since 2013. Basically, ExxonMobil, Chevron and ConocoPhillips have cut their combined CAPEX spending in half in the past three years. This is bad news for either building or at least maintaining oil production in the future.
NOTE: Free Cash Flow is calculated by subtracting CAPEX spending from the company’s operating cash or profits.
Even though these companies slashed nearly $20 billion in CAPEX spending in 2016, they still suffered a negative free cash flow of $7.3 billion. However, this does not include dividend payouts to their shareholders. Not only did these companies pay a total of $46.6 billion in CAPEX in 2016, they also forked out an additional $21.4 billion in shareholder dividends. Dividend payouts do not come out of thin air.. they must come from cash from operations.
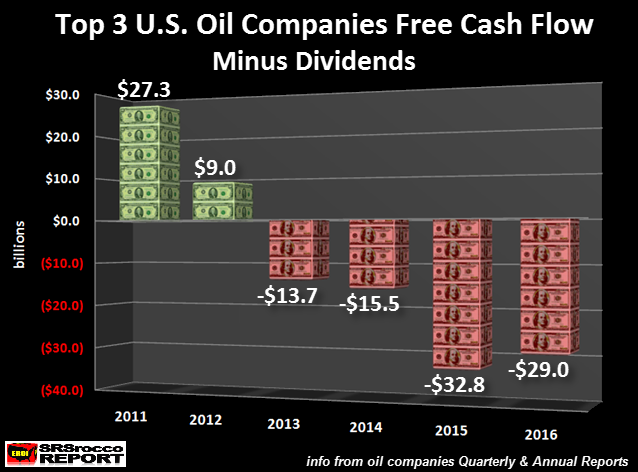
If we include dividend payouts, this would be the net result on these companies Free Cash Flow:
Here we can see that the large dividend payouts by these three oil companies impacted their bottom line much worse than the figures shown in the Free Cash Flow chart above. Thus, the free cash flow minus dividend payouts provides us evidence that these oil companies have been seriously in the RED since 2013, not just the past two years displayed in the Free Cash Flow chart.
As we can see, the group’s free cash flow minus dividends was a negative $32.8 billion in 2015 and a negative $29 billion last year. Of course, these three companies may have sold some financial investments or assets to reduce these negative values, but a company can’t stay in business for long by selling assets that it would need to use to produce oil in the future.
So, what has falling free cash flow and dividends done to ExxonMobil, Chevron and ConocoPhillips long-term debt? You guessed it… it skyrocketed:
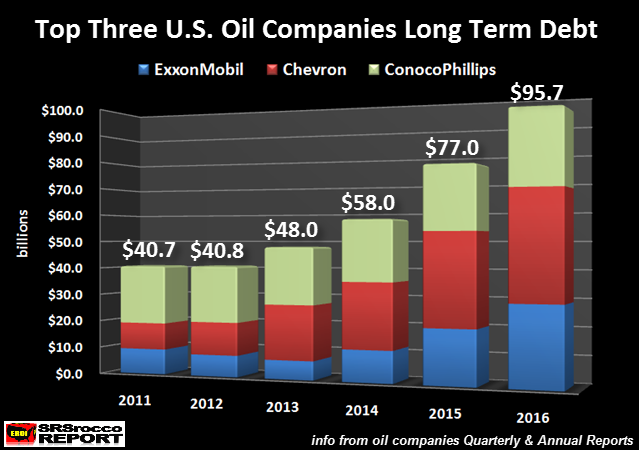
When these three companies still enjoyed positive free cash flow in 2011 and 2012, after paying CAPEX and dividends, their long-term debt did not increase. However, as their operating profits really started to decline, the debt on their balance sheets increased significantly. As we can see, the combined long-term debt in these three companies balance sheets ballooned from $40.8 billion in 2012 to $95.7 billion in 2016.
Basically, these three companies combined long-term debt has doubled in just the past three years. This is bad news as the situation in the energy markets continues to disintegrate. Zerohedge published this article, Goldman Stunned By Collapse In Gasoline Demand: “This Would Require A US Recession” which stated the following:
So yes, both gasoline stocks and supply remains at extremely high levels, but what set off alarm bells is not supply, but demand: the EIA last week reported that the 4-week average of gasoline supplied – or implied gasoline demand – in the United States was 8.2 million barrels per day, the lowest since February 2012. And, as Reuters adds, U.S. refiners are now facing the prospects of weakening gasoline demand for the first time in five years.
Unfortunately, the massive amount of debt overhanging the U.S. economy has put a lot of leverage on the public’s ability to continue purchasing consumer goods and services. While the market has become clever at selling cars for example, by first offering lower interest rates and extended loan payouts, it is now resorting to leasing vehicles at ultra low monthly payment plans… just to get rid of them. Leasing automobiles at monthly rates that are uneconomic for the auto industry in the long run, only allows the GREATEST FINANCIAL PONZI SCHEME to continue a little longer.
When we start to add up all the data, the U.S. economy is getting ready to hit a BRICK WALL. Furthermore, the situation as the top three U.S. oil companies will only get worse going forward. As ExxonMobil, Chevron and ConocoPhillips continue to bleed to death, watch for U.S. oil production to fall precipitously in the future.
Yes, it is true that U.S. oil production has increased over the past several months due to the DRILLING RIG HAMSTERS doing their thing by taking good investment money and producing more crappy low quality oil. However, this isn’t something to cheer about. Rather, I call this…. turning GOLD into LEAD.
Some readers send me information of the growing drilling rig count and oil production in the Permian field in Texas. Yes, that is where the activity has moved to. Why? Well, it is one of the last fields that can produce oil similar to the Bakken and Eagle Ford.
That being said, I would refrain from believing that this bump up in U.S. oil production will SAVE THE DAY. Why? Because it is being done on the back of a massively indebted energy sector which has been able to continue drilling by using rigs that have seen their rental rates cut in half, or more, due to the implosion of the drilling rig industry in 2015 and 2016.
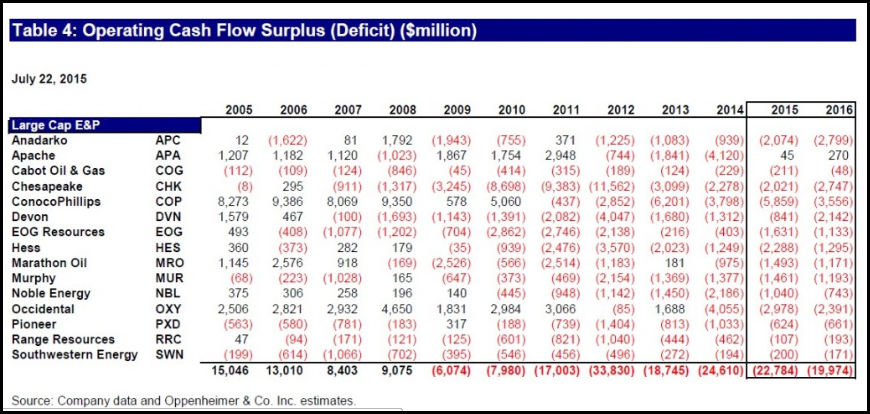
The evidence provided in this article showing the continued financial disintegration at these top three oil companies suggests that the U.S. energy sector is in serious trouble. We must remember, the top oil companies are supposed to be the most profitable. However, if we take a look at what is taking place in the top shale oil and gas producers, the situation is even more dire. I have republished this chart from a previous article showing that the shale oil and gas industry hasn’t really made a profit since 2009:
 https://srsroccoreport.com/wp-content/uploads/2016/12/Large-Cap-Energy-EP-Operating-Cash-Flow-Table-2015-240×114.png 240x, https://srsroccoreport.com/wp-content/uploads/2016/12/Large-Cap-Energy-EP-Operating-Cash-Flow-Table-2015-300×143.png 300x, https://srsroccoreport.com/wp-content/uploads/2016/12/Large-Cap-Energy-EP-Operating-Cash-Flow-Table-2015-768×365.png 768x”>
While some of the companies made free cash flow profits in various years, as an industry, these oil and gas producers have been in the RED since the U.S. Shale Energy Industry really took off in 2009. So, the notion that rising oil production from increased drilling rig activity is going to change the SEA OF RED taking place in the entire U.S. energy sector, suggests individuals or the market has gone completely insane.
As I have stated before, Americans continue to suffer from an increasing amount of BRAIN DAMAGE. Now, I am not just talking about the typical JOE BAG of DONUTS, as they at least have an excuse due to the propaganda put out by the Mainstream media. However, I am really surprised that “supposedly” intelligent individuals continue to either believe in U.S. energy independence or the more silly “Abiotic oil” theory that the Earth has a CREAMY NOUGAT CENTER of oil… that will refill all the oil fields in the world. (James Howard Kunstler gets the credit for that wonderful term).
While I realize the “Abiotic Oil Theory” is complete HOGWASH, many individuals still believe it is true. This theory has been propagated by a few Russian scientists and engineers, but I can assure you the bulk of the Russian oil industry is not drilling down to ultra deep depths to get their oil. I will be publishing an article shortly as a rebuttal to a recent newsletter post titled, How I came to Realize I was Wrong About Peak Oil – F. William Engdahl. Unfortunately, Mr. Engdahl has failed to look at the real evidence, instead has fallen HOOK, LINE and SINKER by faulty information and lousy conspiracy theories.
The number of individuals who fail to believe in PEAK OIL will diminish greatly as the Thermodynamic Oil Collapse picks up speed over the next five years. During this time, it would be prudent to own physical precious metals rather than highly inflated debt-based paper assets or real estate.
Check back for new articles and updates at the SRSrocco Report.
I’ve got to hand it to the majority of pundits out there. They just never learn to think for themselves. They keep dishing out the same nonsense, over and over again.
For instance, the notions that rising interest rates will kill off equity market gains, particularly in the U.S. … or choke off a real estate recovery … or kill the gold market for good — are myths. Period.
It might be true if interest rates were at record highs and well above the rate of inflation. But they are not. Interest rates are coming off of historic record lows in many parts of the world — even below zero in some countries — and they are far below the rate of inflation.
That’s important to understand. As rates rise from essentially 5,000-year-low levels — no matter what any central bank does — many investors will run for cover. But the only market that rising interest rates will truly hurt is the value of sovereign bonds. In other words, it will demolish governments’ ability to ever borrow again (a good thing).
 Consider what’s happening right now with real estate. Why would rising mortgage rates — at this point in the economic cycle and recovery — be bad for property prices?
They won’t be bad. For the simple reason that as mortgage rates start to rise, all the pent-up demand for property will come out of the woodwork and start buying — in anticipation of further increases in the cost of borrowed funds.
That’s precisely what is happening in the U.S., in particular, where a housing recovery is well underway.
Consider the latest data from brokerage Douglas Elliman Real Estate, where January 2017 was an excellent month for high-end sales in Connecticut and where sales from $1 million all the way up to $5 million increased significantly compared to January 2016.
Overall, total inventory is down to 447 houses which is 13 lower than last year at this time, while total sales are up 16.
That’s the high end. Meanwhile, the overall ownership rate in the U.S. is at its lowest level since 1965!
But that will change quickly as mortgage rates start to rise and all that pent-up demand comes out of the woodwork.
This is happening in the suburbs of America as well. Rising interest rates are motivating homeowners and investors to act now, rather than later, when the cost of borrowed funds will be even higher.
That’s just the property markets. Rising interest rates are also going to prove positive for equity markets. While equity markets in the U.S. and Europe remain vulnerable to a short-term pullback, rising rates will be a bullish factor over the long haul.
It means economic activity is picking up. It means the velocity of money turnover is improving, and it means increasing demand for credit — all of which are bullish fundamental forces for equities.
Not to mention the war cycles, which are driving trillions to our shores.
Ditto for commodities. The notion that gold will simply roll over and die and that a new bull market leg higher is impossible with interest rates rising, is brain-dead.
Just consider the last big bull market in gold, from 1973 to 1980, when interest rates were soaring as was the price of gold and most commodities.
Sure, inflation was roaring higher then too. But that doesn’t negate the fact that gold soared with higher interest rates.
Instead, it proves my point: Until interest rates get well ahead of inflation — which is something we will not see for years based on my models — they will not be negative for gold!
That said, right now, most commodities still have some work to do on the downside before they bottom, which they will do this year in the first quarter.
But bottom they will — and they will rise again — along with rising interest rates.
Like many of you, I am watching gold like a hawk. It’s already following my AI models nicely, staging a rally, coming off an extended cycle low.
The best news: Basis the active April gold futures contract, we now have a close above the $1,220 level, a weekly buy signal.
Time to back up the truck? My answer: No. Wait until I give you the final major buy signal. That’s what I am personally waiting for before I load up for my family. So, I give you the same advice I am acting on.
And rest assured that when that signal comes, I will be recommending a nice combination of physical precious metals, ETFs, including leveraged ETFs, and for some of the best profit potential out there, select mining shares.
Subscribers to my Real Wealth Report and Supercycle Trader will get the signal first, and simultaneously.
Best wishes,
Larry

-
I know Mike is a very solid investor and respect his opinions very much. So if he says pay attention to this or that - I will.
~ Dale G.
-
I've started managing my own investments so view Michael's site as a one-stop shop from which to get information and perspectives.
~ Dave E.
-
Michael offers easy reading, honest, common sense information that anyone can use in a practical manner.
~ der_al.
-
A sane voice in a scrambled investment world.
~ Ed R.
Inside Edge Pro Contributors

Greg Weldon

Josef Schachter

Tyler Bollhorn

Ryan Irvine

Paul Beattie

Martin Straith

Patrick Ceresna

Mark Leibovit

James Thorne

Victor Adair