
Timing & trends
That didn’t take long.
After little more than two weeks, President Donald Trump’s honeymoon with Wall Street appears to have been put on hold—for the moment, at least—with major indices making only tepid moves since his January 20 inauguration. That includes the small-cap Russell 2000 Index, which surged in the days following Election Day on hopes that Trump’s pledge to roll back regulations and lower corporate taxes would benefit domestic small businesses the most.

And therein lies part of the problem. Although the president managed to sign an executive order last week requiring the elimination of two federal regulations for every new rule that’s adopted (and ordered a review of Dodd-Frank and former President Obama’s fiduciary rule), other campaign promises that initially excited investors—tax reform and an infrastructure spending deal among them—might have already hit a roadblock.
According to Reuters, a three-day meeting in Philadelphia between President Trump and congressional Republicans ended in a stalemate, with it looking less and less likely that tax reform will happen during Trump’s first 100 days in office—perhaps even the first 200 days. As for infrastructure, several Republicans were reportedly wary of committing to such an enormous spending package before more complete details become available.
 |
Meanwhile, Trump’s seven-nation travel ban received a lukewarm—and, in some cases, hostile—reception from many in the business world who have traditionally depended on foreign talent. That’s especially the case in Silicon Valley, where close to 40 percent of all workers are foreign-born, according to the 2016 Silicon Valley Index. (Around the same percentage of Fortune 500 companies were founded by immigrants or children of immigrants, including Steve Jobs, whose biological father was Syrian.) One of the more dramatic responses toward the travel ban was Uber CEO Travis Kalanick’s dropping out of Trump’s business advisory panel, following an outcry from users of the popular ride-sharing app who saw his participation with the president as an endorsement of his immigration policies.

I’ve shared with you before that the media often take Trump literally but not seriously, whereas his supporters take him seriously but not literally. I think it’s evident that the market is finally coming to terms with the fact that Trump, unlike every other politician before him, actually meant everything he said on the campaign trail, including his more protectionist and nationalist ideas.
Although I don’t necessarily agree with Trump’s plans to raise tariffs, withdraw from free-trade agreements and restrict international travel, it might be easy to some to see why he feels American companies need protecting from foreign competition. Last week I attended the Harvard Business School CEO Presidents’ Seminar in Boston, and among the topics we discussed was China’s ascent as an economic and corporate juggernaut. Take a look at the chart below, using data from Fortune Magazine’s annual list of the world’s 500 largest companies by revenue. Whereas the U.S. has lost ground globally over the past 20 years, China’s share of large companies has exploded, from having only three on the list in 1995 to 103 in 2015. The number of Japanese firms, meanwhile, has more than halved in that time.

I will say, while I’m on this topic, that the uncertainty and unpredictablilty surrounding Trump has given active management a strong opportunity to demonstrate its value in the investment world. Assessing the risks and implications of his actions, policies and tweets, which change daily, really requires a human touch that fund managers and analysts can provide.
Dollar Down, Gold Up
One of those implications is the U.S. dollar’s decline. Following Trump’s comment that it was “too strong” and hurt American exporters’ competitiveness, currency traders shorted the greenback, causing it to have the worst start to a year since 1987.
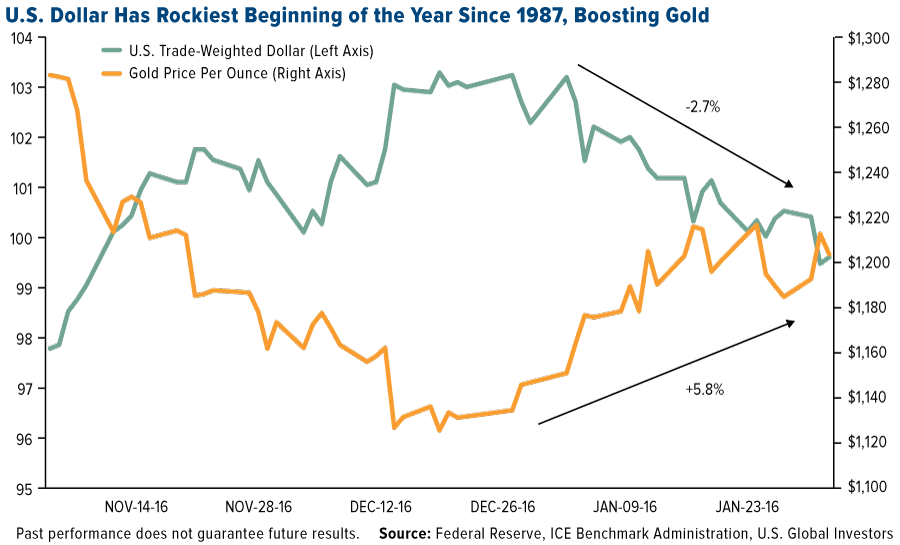
This, coupled with a more dovish Federal Reserve, expectations of higher inflation and growing demand for a safe haven, has helped push gold prices back above $1,200 an ounce. January, in fact, was the best month for the yellow metal since June, when Brexit anxiety and negative government bond yields sent it to as high as $1,370.

Demand for gold as an investment was up a whopping 70 percent year-over-year in 2016, according to the World Gold Council. Gold ETFs had their second-best year on record. But immediately following the November election, outflows from gold ETFs and other products accelerated, eventually shedding some 193 metric tons.
But now, just two weeks into Trump’s term as president, the gold bulls are banging the drum, with several large hedge fund managers taking a contrarian bet on the precious metal.
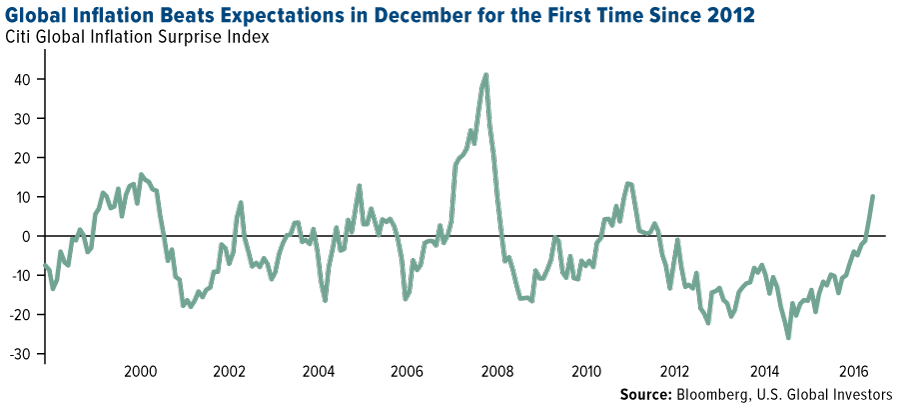
Inflationary pressures are indeed intensifying. U.S. consumer prices rose 2.1 percent in December year-over-year, their fastest pace since 2014, and inflation across the globe is beating market forecasts, with the Citi Global Inflation Surprise Index turning positive for the first time since 2012. Anything above zero indicates that actual inflation is stronger than expectations for the month.
OPEC Making Good on Production Agreement
Among the commodities showing resilience right now is oil, especially on reports that the Organization of Petroleum Exporting Countries (OPEC) is 60 percent of the way to reaching its output target after agreeing to cutting production in early December for the first time since 2008.
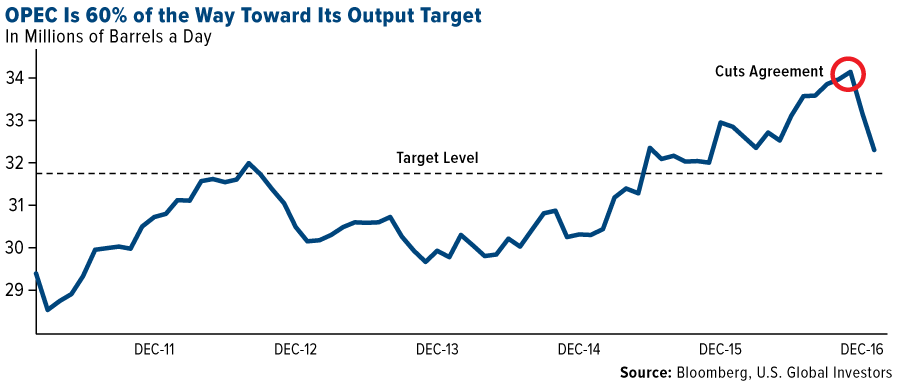
Of course, this news is tempered by analysts’ expectations that U.S. producers will export more crude than four OPEC members combined in 2017. According to Bloomberg, the U.S. could sell as much as 800,000 barrels a day overseas, which is more than Libya, Qatar, Ecuador and Gabon produced in December.
All opinions expressed and data provided are subject to change without notice. Some of these opinions may not be appropriate to every invest. Some links above may be directed to third-party websites. U.S. Global Investors does not endorse all information supplied by these websites and is not responsible for their content.
The Dow Jones Industrial Average is a price-weighted average of 30 blue chip stocks that are generally leaders in their industry. The S&P 500 Stock Index is a widely recognized capitalization-weighted index of 500 common stock prices in U.S. companies. The Russell 2000 Index is a U.S. equity index measuring the performance of the 2,000 smallest companies in the Russell 3000, a widely recognized small-cap index.
The U.S. Trade Weighted Dollar Index provides a general indication of the international value of the U.S. dollar.
The Citi Global Inflation Surprise Index measure price surprises relative to market expectations. Readings below zero indicate that actual inflation is below market expectations, where readings above zero indicate that inflation is above expectations.
Holdings may change daily. Holdings are reported as of the most recent quarter-end. None of the securities mentioned in the article were held by any accounts managed by U.S. Global Investors as of 12/30/2016.

Feb 7, 2017
- With each passing day, both the technical price action and the news flow are getting more positive for gold.
- Double-click to enlarge this daily bars gold chart.

- Another great week for the world’s ultimate asset is clearly underway. A beautiful technical uptrend is now in play.
- Gold has also surged through resistance at $1220 and is making a beeline towards my $1250 target zone.
- Please click here now. Double-click to enlarge. The US dollar has broken down from a substantial head and shoulders top formation against the Swiss franc.
- A small rally back towards the neckline of the pattern is likely, but the overall technical picture for the dollar is very negative.
- Please click here now. Double-click to enlarge this key dollar versus yen chart.
- Both the yen and the franc are safe haven fiat currencies, and the “risk-on” dollar’s price action against both of them is truly horrific. That’s great news for gold, which is the ultimate safe haven.
- Please click here now. Will President Trump order Janet Yellen to engage in outright money printing to devalue the dollar?
- I think he’ll do it, and here’s why: America’s demographics are drastically different from the demographics that were in place when Ronald Reagan got elected with a similar “Make America Great” mantra.
- America is now an ageing society, and both the citizens and the government are maniacally obsessed with debt.
- Also, the business up cycle is nearing an end, and while immigration changes make most citizens happy, that’s not going to re-create a 1950’s society with a 15% GDP growth rate.
- Sadly, Trump’s only practical tools to reduce the huge debt burden on the backs of both citizens and government are money printing and gold revaluation.
- Please click here now. FOREX reserves in China may be about to become a very powerful gold price driver.
- To combat the disintegration of its FOREX reserves, China may have to float the yuan, or engage in significant money printing.
- Please click here now. Double-click to enlarge this spectacular daily bars GDX chart.
- Gold stocks are roaring higher because of Trump’s dollar bashing and even more because of the end of global deflation.
- GDX itself is sporting a beautiful momentum-oriented crossover buy signal on my 14,7,7 Stochastics oscillator.
- I suggested that gold stock enthusiasts should be on the lookout for that signal, and now it is in play.
- GDX should run to $26, and perhaps to $27.50, as gold marches from $1220 towards $1250.
- For even better technical news about most gold stocks, please click here now. Double-click to enlarge. Regardless of whether GDX makes it to $27.50 or not on this rally, the coming pullback is simply going to create a beautiful right shoulder of a large inverse head and shoulders bottom pattern!
- The target of the pattern is the $32 area, and I think GDX has a very good chance of surpassing that high.
- I suggested that 2017 would be all that gold stock investors could ever ask for, and that is certainly playing out in textbook fashion. Rallies are strong. Pullbacks are orderly and modest.
- US dollar bulls will likely be hit hard by Donald Trump’s dollar devaluation team. Governments around the world may be poised to enter not just a fiat devaluation competition, but a money printing competition. There are no winners in such a competition, except for gold, silver, and associated stocks!

Thanks!
Cheers
st
Feb 7, 2017
Stewart Thomson
Graceland Updates
website: www.gracelandupdates.com
email for questions: stewart@gracelandupdates.com
email to request the free reports: freereports@gracelandupdates.com
Graceland Updates Subscription Service: Note we are privacy oriented. We accept cheques. And credit cards thru PayPal only on our website. For your protection we don’t see your credit card information. Only PayPal does.
| Subscribe via major credit cards at Graceland Updates – or make checks payable to: “Stewart Thomson” Mail to: Stewart Thomson / 1276 Lakeview Drive / Oakville, Ontario L6H 2M8 / Canada |
Stewart Thomson is a retired Merrill Lynch broker. Stewart writes the Graceland Updates daily between 4am-7am. They are sent out around 8am. The newsletter is attractively priced and the format is a unique numbered point form; giving clarity to each point and saving valuable reading time.
Risks, Disclaimers, Legal
Stewart Thomson is no longer an investment advisor. The information provided by Stewart and Graceland Updates is for general information purposes only. Before taking any action on any investment, it is imperative that you consult with multiple properly licensed, experienced and qualifed investment advisors and get numerous opinions before taking any action. Your minimum risk on any investment in the world is 100% loss of all your money. You may be taking or preparing to take leveraged positions in investments and not know it, exposing yourself to unlimited risks. This is highly concerning if you are an investor in any derivatives products. There is an approx $700 trillion OTC Derivatives Iceberg with a tiny portion written off officially. The bottom line:
Are You Prepared?
One of the biggest contributors to losses for traders in the financial market is the temptation to sell short. Borrowing shares of a company that are not owned by the seller in the hopes of making a massive profit has shipwrecked more traders than probably any other factor. With stories abounding of the quick and easy profits to be made in selling stocks which are supposedly on the verge of plummeting, it’s no wonder that the allure of “shorting” is so irresistible to so many.
Selling short is a simple enough proposition: place a short sale order with your broker for a company whose shares you believe are overvalued or technically “overbought”. Then just sit back and wait for the profits to start rolling in. If only it were that easy! The trouble with selling short is that in most cases the odds are against the short seller. This is due to a number of factors, some of which we’ll examine here.
Perhaps the biggest risk for short sellers is the crowded short trade. A high-profile example of what happens when too many traders pile into a single stock on the short side occurred recently – a cautionary tale if ever there was one. It involved the loss of one man’s entire fortune due to a misguided attempt at selling short one of the most widely traded U.S.-listed stocks. It’s a textbook case of what can go wrong when attempting one of the most dangerous of all trading maneuvers.
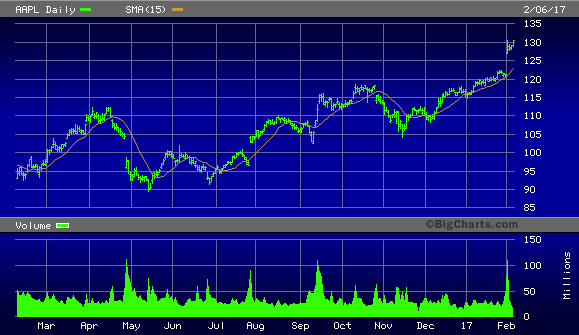
According to MarketWatch, Canadian investor F.S. Comeau bet his last $249,000 against Apple Inc.(AAPL) in an attempt to reclaim $2.5 million lost in poor investments. At the time of the trade, shares were valued around $122, and MarketWatch reported that an increase of just $6 would deplete Comeau’s savings.
Apple shares screamed higher last week when the tech giant released an impressive Q1 earnings report and Comeau lost substantially. As of this writing, AAPL shares had risen to a 52-week high of $130.50.
Before Apple released its earnings report, Comeau, who live blogged his reactions while wearing a wolf mask, acknowledged the capacity of investors aware of his short position to fade his trade. “With 14,000 people watching, you guys could really mess with me,” he said. When the company released its report his reaction was terse but poignant: “Oh, no.”
YahooFinance described Comeau’s reaction to Apple earnings as follows: [Comeau] kept howling. And crying. And throwing his pre-popped, celebratory champagne bottle. There was a timeless stretch of blank camera stares, and then the sound of dry heaving. With mask still on, he pulled out a trashcan, and vomited more than his life savings.”
This misguided trader can perhaps be excused for his desperation born of inexperience. What’s inexcusable, though, are the far more experienced trading advisors who gave assurances to their followers that Apple was a prime short-sale candidate despite all the technical and fundamental evidence to the contrary. This misleading advice undoubtedly led to many hundreds of traders making the same mistake as Comeau.
More than anything, the Apple experience provides a wonderful cautionary tale for all would-be short sellers. The lesson here is that in an established bull market it’s best to avoid selling short altogether. Trading against the prevailing trend is especially dangerous when one considers that short interest can quickly reach critical levels, thus the slightest bit of contrary news can catalyze a massive rally. Short-covering rallies tend to involve wealth-destroying upside gaps, as the latest Apple stock experience proved. These gaps are products of the urgency among short sellers to exit the trade. They frequently represent losses on an unimagined scale.
Since naked short selling involves borrowing, the debt component of this trade ensures that the volatility factor will be greatly magnified vis-à-vis buying outright. While this can sometimes work to a trader’s advantage in a bear market, it can prove catastrophic in a bull market. The best policy is to avoid shorting unless a major bear market is underway and downside momentum has been thoroughly established. Even then, your timing must sometimes be perfect.
In a bull market the trend is truly your friend, and trading against the grain is usually a fool’s errand. Best leave that to the men wearing wolf masks.
….also from Cliff Droke: The New Economy Index, Euphoria and Panic

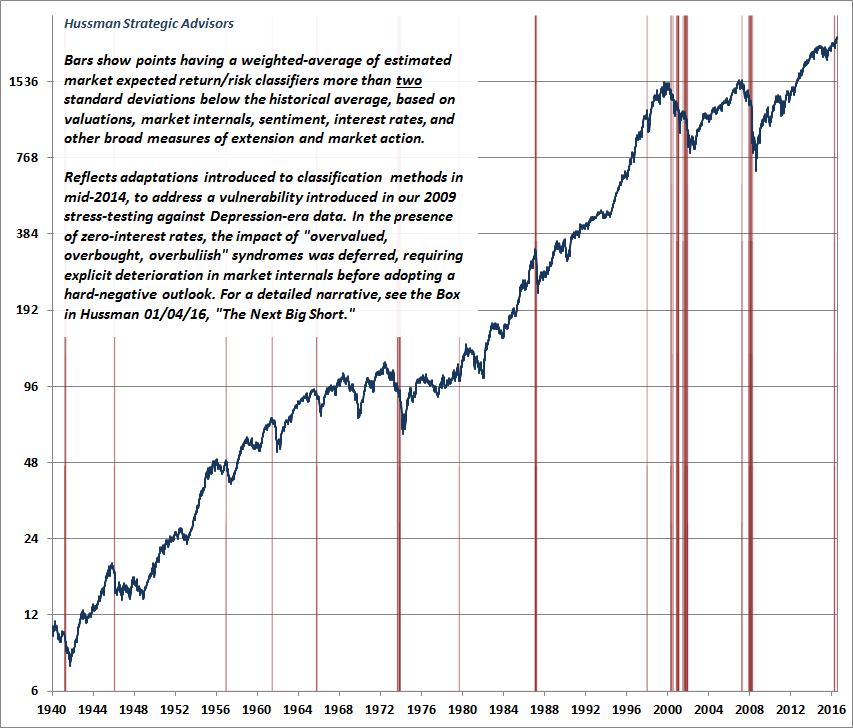
A few weeks ago, we observed the single most extreme syndrome of “overvalued, overbought, overbullish” conditions we identify (see Speculative Extremes and Historically Informed Optimism) at a level on the S&P 500 4% higher than the syndrome we observed in July. The S&P 500 has climbed about 1.5% further since then, and all of the features of this syndrome remain in place.
As I noted in December, except for a set of signals in late-2013 and early-2014 (when market internals remained uniformly favorable as a result of Fed-induced yield-seeking speculation), an overextended syndrome this extreme has only emerged at the market peaks preceding the worst collapses in the past century.


-
I know Mike is a very solid investor and respect his opinions very much. So if he says pay attention to this or that - I will.
~ Dale G.
-
I've started managing my own investments so view Michael's site as a one-stop shop from which to get information and perspectives.
~ Dave E.
-
Michael offers easy reading, honest, common sense information that anyone can use in a practical manner.
~ der_al.
-
A sane voice in a scrambled investment world.
~ Ed R.
Inside Edge Pro Contributors

Greg Weldon

Josef Schachter

Tyler Bollhorn

Ryan Irvine

Paul Beattie

Martin Straith

Patrick Ceresna

Mark Leibovit

James Thorne

Victor Adair