
Personal Finance
Most readers of this column own (or plan to own) physical precious metals – gold and silver, perhaps even some platinum or palladium. They may also own mining stocks.
But which category is “best”? It’s like asking, “What’s the most efficient exercise?” or “What’s the best fishing lure?” Truth be known, it’s really about what you wish to accomplish! Here is my considered opinion…
Precious Metals Offer Insurance First – Profit Second
One should strongly consider holding physical precious metals for “investment first, profit potential second.”
The primary function of “metals in hand” is to help offset the possible loss of purchasing power that inflation or a changing business/regulatory climate might visit on a person’s other asset classes, such as the broad stock market, real estate, collectibles, and certainly, bonds.
“The One-Ring” – Gold and Silver
 This last category appears to be ending a literal 30-year bull market, during which time interest rates declined (and bonds rose) to levels not seen in many decades.
(A change in the secular trend, to rising interest rates, would have severe ramifications for the value of bonds, whether or not they are held to maturity.)
A side advantage, common in India but not discussed in this country, is that gold and silver can be easily be “pawned” when a person might not have other options for a loan. Just like any item left in the pawn shop owner’s care, precious metals can be redeemed when the loan has been paid off.
Indians have a much more nuanced – and relaxed – view about metals’ ownership. Outlookindia.com takes the pulse about how its citizens deal with the idea of buying gold and silver, noting, “If you bought gold today and its price falls tomorrow, you don’t say, oh, wish I had not bought gold, I lost money. You just look at your gold and say, I have got 200 grams of gold. That’s it.”
Mining Stocks Are Speculations
Mining stocks are an entirely different “investment animal.” You’re buying shares in companies who explore for and/or produce precious and base metals. Miners have many inherent risks to overcome, which the metal held in your hand, by virtue of having being refined, has already put behind it.
A miner’s profit can be adversely affected by all sorts of variables – operational factors like oil prices, the cost of labor, local community support or lack thereof, government regulations, and even nationalization (theft) of a company’s assets – which often takes place without compensation to the owners, let alone shareholders. A tailings dam collapse or accidental worker deaths can also affect the share price. Over the years, several such companies have seen theirs drop from multiple dollars each, to a fraction of that… or to zero.
 Some companies bill themselves as “pure silver producers.” The “purest” of these usually produce a fair amount of base metals – lead, copper and zinc – which are added to the profit mix to yield “equivalent silver ounces.” Even the best known examples may list 30-40% of their annual production in this non-silver category. A geologic fact is that silver veins tend to “pinch and swell,” causing ore head grades, and hence the company’s share price, to unexpectedly rise or fall.
A big argument for holding mining stocks is that because of their increased risk profile, they can be expected to gain at a greater percentage rate – perhaps several times as much – as do gold and silver. For a number of miners in 2016, that was certainly the case. Yet several of the best ones on the board also declined over 50% during last fall’s inevitable correction to the strong uptrend… which you may have noticed was not the case with the price of the metals they produced.
For much of the last 20 years, during which time, precious metals rose by multiples of their early bull market price, mining stocks as a group actually underperformed. So what’s the point of taking on additional risk and doing considerably more work, just to find that you could have made a single metals’ buy-and-hold decision – which performed better with less downside?
You should also answer these fundamental questions before deciding whether or not to include miners and metals in your investment mix. What are your financial goals? How much risk are you willing to take? How much time can you spend on the “care and maintenance” of your “garden” of stocks?
They can’t simply be purchased and placed in a drawer somewhere. Here are just a few of real-life, high-to-low ranges, stated in U.S. dollars, of share prices for several well-run, profitable miners during the cyclical bear market lasting from mid-2011 to late-2015 – $19 down to $7; $10.30 to $0.28; $43 to $5.38; $13 to $1; $36 fell to $3.30.
And did I mention that scores of other companies either reverse-split 20 (or 100):1… or simply went bankrupt?
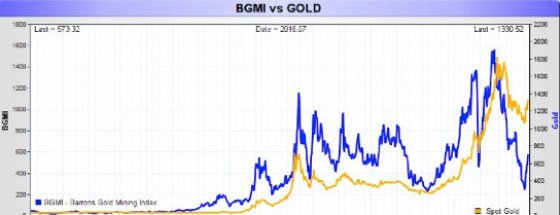
BGMI index vs. Gold
Why I Hold Mining Stocks and Why, Perhaps, You Should Not
Trading the mining sector is quite literally a job. I write reports, take mining tours, read hundreds of articles and evaluations on scores of companies – and trade mining stocks. But that’s my choice. It’s great when shares are rising to the sky, as was the case this past January to August. But it was NOT great when the bottom fell out into December.
I am willing to put up with these swings for the possibility of a few home runs, while often settling for base hits, along with the occasional “strike-out.” Do you have the temperament, are you willing to put in the research, can you handle the risk, do you want to give up a lot of the time you could spend doing something else?
Perhaps you can answer “yes” to these questions. If not, or the questions aren’t relevant to what you’re trying to accomplish, then you should seriously consider keeping decision-making about the metals, relevant to your needs and goals.
David Smith is Senior Analyst for TheMorganReport.com and a regular contributor to MoneyMetals.com. For the past 15 years he has investigated precious metals’ mines and exploration sites in Argentina, Chile, Mexico, Bolivia, China, Canada, and the U.S. He shares his resource sector observations with readers, the media, and North American investment conference attendees.
….related: Gold and Reflation

Here are today’s videos and charts (double-click to enlarge):
Gold, Silver, US Dollar, & T-Bonds Video Analysis


SFS Key Charts & Tactics Video Analysis

SF60 Key Charts & Tactics Video Analysis


SF Juniors Key Charts Video Analysis


********
Unique Introduction For Gold-Eagle Readers: Send me an emailtoalerts@superforcesignals.com and I’ll send you 3 of my next
Super Force Surge Signals free of charge, as I send them to paid subscribers. Thank you!
Stay alert for our Super Force alerts, sent by email to subscribers, for both the daily charts on Super Force Signals at www.superforcesignals.com and for the 60 minute charts at www.superforce60.com
About Super Force Signals:
Our Super Force signals are created thru our proprietary blend of the highest quality technical analysis and many years of successful business building. We are two business owners with excellent synergy. We understand risk and reward. Our subscribers are generally successful business owners, people like yourself with speculative funds, looking for serious management of your risk and reward in the market.
Frank Johnson: Executive Editor, Macro Risk Manager.
Morris Hubbartt: Chief Market Analyst, Trading Risk Specialist.
Email:
trading@superforcesignals.com
trading@superforce60.com
Mail:
SFS Web Services
1170 Bay Street, Suite #143

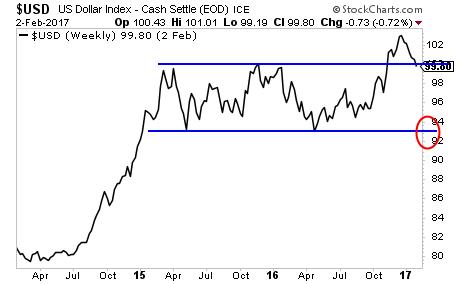
As we have repeatedly warning, anyone who is betting on the Trump Presidency unleashing a massive $USD bull market in the near future is going to get taken to the cleaners.
This has already begun…
One of the single most dangerous traps for traders to avoid is a “False Breakout.”
False breakouts are moves in which an asset “breaks out” of a formation, leading many to believe that the move is legitimate… then suddenly KA-BLAM, the move reverses violently.
See the $USD today. This looks more and more like a false breakout, which means YES, the $USD is going to sub 90s if not lower within 12 months.
Those who believe Trump wants the $USD above 100 are not paying attention. Similarly, those who believe that the Fed can and will raise rates three times in 2017 are missing the big picture.
NEITHER OF THOSE IS GOING TO HAPPEN. And if you’re investing based on them, you’re in for a LOT of pain.
Originally posted on http://gainspainscapital.com
Best Regards
Graham Summers
Forex Trading Alert originally published on Feb 2, 2017, 8:14 AM
Earlier today, the USD Index extended losses against the basket of the major currencies as yesterday’s Fed statement didn’t give clear signal on the timing of its next rate hike. How did this drop affect the technical picture of EUR/USD, USD/CAD and AUD/USD?
In our opinion, the following forex trading positions are justified – summary:
EUR/USD: none
GBP/USD: none
USD/JPY: none
USD/CAD: none
USD/CHF: none
AUD/USD: none
EUR/USD


Quoting our previous alert:
(…) EUR/USD reached the yellow resistance zone, approaching the 50% Fibonacci retracement. What’s next? Taking into account the fact that the proximity to this resistance area was enough to trigger a pullback in the previous week, it seems that we’ll see a similar price action and a verification of a breakout above the lower border of the blue rising trend channel in the very near future.
Looking at the daily chart, we see that the situation developed in tune with the above scenario and EUR/USD verified the earlier breakout above the lower border of the blue rising trend channel. What does it mean for the exchange rate? We believe that the best answer to this question will be the quote from our yesterday’s commentary:
(…) we should keep in mind that as long as there is no drop below this support another upswing and a test of the upper border of the yellow resistance zone is likely – especially when we factor in the fact that the buy signals generated by the weekly and daily indicators are still in play.
Very short-term outlook: mixed with bullish bias
Short-term outlook: mixed
MT outlook: mixed
LT outlook: mixed
Trading position (short-term; our opinion): No positions are justified from the risk/reward perspective.
USD/CAD


On Friday, we wrote the following:
(…)Although the pair rebounded in recent days, the exchange rate still remains under the previously-broken lower purple resistance line, which suggests that the current upswing could be nothing more than a verification of the earlier breakdown. Additionally, (…) the sell signals generated by the weekly indicators remain in place suggesting lower values of USD/CAD in the coming days. If this is the case and the exchange rate declines from here, (…), it seems that the exchange rate will move lower once again and test the lower border of the blue rising tend channel (seen on the daily chart) in the coming days.
On the daily chart, we see that currency bears pushed USD/CAD lower (as we had expected) and the pair slipped to our downside target. Although the exchange rate rebounded yesterday, the previously-broken lower border of the purple declining trend channel encouraged currency bears to act, which resulted in a pullback. Earlier today USD/CAD extended losses, which suggests a re-test of the blue support line. At this point it is worth noting that the Stochastic Oscillator generated a sell signal, which suggests that the bears could try to push the pair even lower. If this is the case and the exchange rate drops under this support line, the next downside target for the sellers will be around 1.2893, where the 61.8% Fibonacci retracement based on the entire May-December upward move is.
Very short-term outlook: bearish
Short-term outlook: mixed
MT outlook: mixed
LT outlook: mixed
Trading position (short-term; our opinion): No positions are justified from the risk/reward perspective.
AUD/USD


Looking at the daily chart, we see that AUD/USD broke above the upper border of the blue consolidation earlier today, which means that our Tuesday’s commentary on this currency pair is up-to-date also today:
(…) taking into account the buy signal generated by the Stochastic Oscillator, it seems that currency bulls will try to push the pair higher in the coming days. If this is the case, and the exchange rate breaks above the upper border of the consolidation, we’ll see not only a test of the recent highs, but also an increase to the resistance zone created by the 76.4% and 78.6% Fibonacci retracement levels (around 0.7629-0.7643). If this area is broken, the next target will be around 0.7677, where the size of the upward move will correspond to the height of the blue consolidation.
Finishing today’s commentary please keep in mind that as long as there are no sell signals further improvement is likely. Therefore if AUD/USD climbs above 0.7677, the next upside target will be the yellow resistance zone marked on the weekly chart.
Very short-term outlook: bullish
Short-term outlook: mixed
MT outlook: mixed
LT outlook: mixed
Trading position (short-term; our opinion): No positions are justified from the risk/reward perspective.
Thank you.
….related: Weaker US$ Could Send Gold & Gold Stocks to Higher Targets

In recent years, deflation was considered one of the biggest threats to the global economy. These fears are vanishing. As deflation becomes the thing of the past (there was even the end of deflation in Japan at the end of 2016), reflation is now attracting the attention of investors. What does it mean? According to the most popular definition, reflation is an increase in economic activity and inflation, usually caused by using inflationary measures to reverse deflationary trends. We simply take reflation to be acceleration in the rate of inflation, i.e. the opposite of disinflation, which is a decrease in the rate of inflation.
Is the inflation rate increasing in the world economy? Well, let’s look at the chart below. As one can see, inflation has recently risen both in the U.S. and the euro area. In the former, the annual inflation rate has increased from 0 percent in September 2015 to 2.1 percent in December 2016. In the euro area, the acceleration has come a bit later due to stronger deflationary forces, but the inflation rate has risen from -0.24 percent in April 2016 to 1.1 percent in December 2016. In particular, the consumer prices rose 1.7 percent in December in Germany, the euro area’s growth engine. This was the fastest pace since July 2013.
Chart 1: The CPI rate year-over-year for the U.S. (blue line) and the euro area (red line) over the last ten years.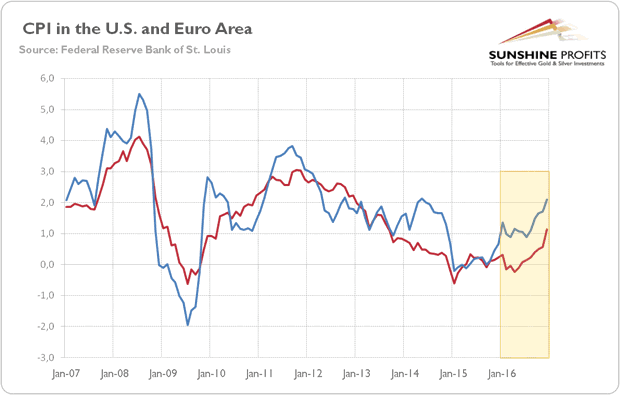
Inflation expectations also have risen significantly since the summer of 2016, as one can see in the chart below.
Chart 2: The monthly averages of U.S. spot inflation expectations derived from 10-year Treasuries (red line) and the forward inflation expectations derived from 5-year and 10-year Treasuries (blue line) over the last ten years. 
What are the drivers of the current reflation? First, global economic growth and industrial production have accelerated. According to the Fulcrum’s latest estimations, the global growth rate jumped to 4.4 percent in December 2016, the fastest pace since April 2011. Similarly, the Goldman Sachs Global Leading Indicator has reached its highest point since December 2010. Even the World Bank said that the growth forecast in 2017 showed “unusually strong pick up in global growth”. And U.S. manufacturing rose in December at its fastest pace in two years, as the chart below shows. Manufacturing also jumped in the U.K. and in the euro area in the fourth quarter of 2016, further improving in China as well.
Chart 3: US ISM Manufacturing Purchasing Managers Index over the last ten years.
Second, commodity prices have rebounded. The price of oil has doubled, rising from the bottom $26.11 in February 2016 to $53.75 at the end of year, while copper prices have jumped about 15 percent since November 2016. It may be an important signal, as copper is considered a leading indicator of the global economy.
Chart 4: The monthly average of the price of oil (red line, left axis, WTI, price per barrel) and the price of copper (blue line, right axis, price per ton) over the last five years.
To sum up, reflation is really happening. Economic growth has accelerated, which increased the demand for commodities. The rise in commodity prices has fueled the uptick in the headline inflation data. But the current macroeconomic environment and market sentiment are negative for gold prices. The yellow metal shines during economic slowdowns when investors are in a gloomy mood. This was the case at the beginning of 2016 when China was in the doldrums and markets were concerned about prospects for the global economy. Now, investors have adopted a much more optimistic stance as reflation is unfolding. As real interest rates rose, and risk aversion diminished, gold’s appeal tarnished. Therefore, if the reflation is lasting, the fundamental outlook for gold should be bearish. On the other hand, if it turns out to be another unstable short-term spike in global activity, then gold may rally again. It is difficult to determine with certainty the character of the global uptick in economic activity, but the current indicators are improving in a way not seen since the end of the financial crisis. The Trump rally may be short-lived, but reflation actually started before the U.S. presidential election (see the charts above). It implies that reflation could stay with us, even if the Trumponomics fails, which would be negative news for the gold bulls. They also hope that inflation will boost the price of gold, but the inflationary pressure does not pose a threat for the global economy so far. However, there is, of course, the risk of inflation getting out of control – in that scenario, gold may shine, although investors should remember that it is not a perfect inflation-hedge.
Thank you.
….related: Embry – A Jaw-Dropping 8.6 Million Ounces Of Paper Gold Longs Just Blew Up At The Comex!


-
I know Mike is a very solid investor and respect his opinions very much. So if he says pay attention to this or that - I will.
~ Dale G.
-
I've started managing my own investments so view Michael's site as a one-stop shop from which to get information and perspectives.
~ Dave E.
-
Michael offers easy reading, honest, common sense information that anyone can use in a practical manner.
~ der_al.
-
A sane voice in a scrambled investment world.
~ Ed R.
Inside Edge Pro Contributors

Greg Weldon

Josef Schachter

Tyler Bollhorn

Ryan Irvine

Paul Beattie

Martin Straith

Patrick Ceresna

Mark Leibovit

James Thorne

Victor Adair