
Energy & Commodities
Jan 31, 2017
- As I have noted for many years, gold has a rough general tendency to decline ahead of the US jobs report, and then rally in the hours and/or days following the release of the report.
- The next monthly jobs report will be released at 8:30AM on Friday. This report and the closure of the Chinese gold market for the New Year’s holiday should be quite negative for gold, but…
- The sell-off from the $1220 area is orderly, and gold feels firm.
- Please click here now. Double-click to enlarge. Gold did break down from a small double top pattern.
- The price target of the pattern is $1170, but there may be an uptrend channel forming. I’ve highlighted that in blue.
- Also, the lead line of the 14,7,7 Stochastics series oscillator that I use exclusively on daily bar and candlestick charts is now sitting at about 50, where momentum-based rallies can occur.
- With China offline and the jobs report dead ahead, why is gold acting so firmly? Well, please click here now. Double-click to enlarge. The US dollar looks very weak on this daily bars chart against the Swiss Franc.
- It’s broken down from a head and shoulders top pattern, and has not rallied since arriving at technical support yesterday.
- The rally could still happen, and that would likely push gold down to $1170 ahead of the jobs report.
- Given that gold has rallied from $1125 to $1220, a decline to $1170 is perfectly normal. An orderly decline like this should not make gold investors nervous.
- Please click here now. Double-click to enlarge this dollar versus yen chart.
- All gold community eyes should be focused on the 112.50 price level. A breakdown below that level would almost certainly usher in a gold price rally to my $1250 target zone.
- The Swiss franc, the Japanese yen, and gold bullion are all viewed as key “risk off” assets by bank FOREX traders.
- It’s clear that the dollar is struggling now against both the franc and the yen.
- Please click here now. Double-click to enlarge this weekly bars euro versus the dollar chart.
- The euro never rallied against the dollar in 2016 in the way that the franc, yen, and gold did.
- That’s partly because Europe’s economic recovery has been more anemic than America’s, but mainly because euro is not viewed as a safe haven currency by the large bank traders.
- Having said that, most gold price discovery takes place in US dollars, and a rally in the euro could add some zest to the gold price!
- The recovery taking place in Europe now could be enough to reverse the ECB’s policies of QE and low interest rates.
- That would create both European inflation and a euro rally.
- Please click here now. Double-click to enlarge this daily bars GDX chart.
- Gold stocks are performing exceptionally well since gold ran into resistance at my $1220 target zone.
- Can GDX rally to $25 if gold falls to $1170? I think that’s asking a bit much (for now), but GDX should easily rally to $25 if gold can climb back to $1220.
- A rally to $1250 would likely see GDX surge to $28, and a bigger move to $1650 for gold should see GDX make a new all-time high. That’s a bit further down the road, but eager gold stock investors should ensure they are building a solid block of core positions now, to partake in all the upside fun!
Special Offer For Website Readers: Please send me an Email to freereports4@gracelandupdates.com and I’ll send you my free “Senior Super Stars” report. I cover seven of the top senior gold stocks, with key buy and sell tactics for both short term traders, and long term core position enthusiasts!
Thanks!
Cheers
St
Stewart Thomson
Graceland Updates
Note: We are privacy oriented. We accept cheques, credit card, and if needed, PayPal.
Written between 4am-7am. 5-6 issues per week. Emailed at aprox 9am daily.
https://www.gracelandupdates.com
Email:
Rate Sheet (us funds):
Lifetime: $999
2yr: $299 (over 500 issues)
1yr: $199 (over 250 issues)
6 mths: $129 (over 125 issues)
To pay by credit card/paypal, please click this link:
https://gracelandupdates.com/subscribe-pp/
To pay by cheque, make cheque payable to “Stewart Thomson”
Mail to:
Stewart Thomson / 1276 Lakeview Drive / Oakville, Ontario L6H 2M8 Canada
Stewart Thomson is a retired Merrill Lynch broker. Stewart writes the Graceland Updates daily between 4am-7am. They are sent out around 8am-9am. The newsletter is attractively priced and the format is a unique numbered point form. Giving clarity of each point and saving valuable reading time.
Risks, Disclaimers, Legal
Stewart Thomson is no longer an investment advisor. The information provided by Stewart and Graceland Updates is for general information purposes only. Before taking any action on any investment, it is imperative that you consult with multiple properly licensed, experienced and qualified investment advisors and get numerous opinions before taking any action. Your minimum risk on any investment in the world is: 100% loss of all your money. You may be taking or preparing to take leveraged positions in investments and not know it, exposing yourself to unlimited risks. This is highly concerning if you are an investor in any derivatives products. There is an approx $700 trillion OTC Derivatives Iceberg with a tiny portion written off officially. The bottom line:
Are You Prepared?

The University of Michigan Final Consumer Sentiment for January came in at 98.5, up from the December Final reading. Investing.com had forecast 98.1.
Surveys of Consumers chief economist, Richard Curtin, makes the following comments:
Consumers expressed a higher level of confidence January than any other time in the last dozen years. The post-election surge in confidence was driven by a more optimistic outlook for the economy and job growth during the year ahead as well as more favorable economic prospects over the next five years. Consumers also reported much more positive assessments of their current financial situation due to gains in both incomes and household wealth, and anticipated the most positive outlook for their personal finances in more than a decade. Consumers have become more convinced that the stronger economy would finally prompt the Fed to increase interest rates at a quicker pace, which caused one-in-five consumers to favor borrowing-in-advance of anticipated increases in mortgage rates, the highest level in more than twenty years. Overall, the post-election surge in consumer confidence was based on political promises, and not, as yet, on economic outcomes. Moreover, over the past half century the surveys have never recorded as dominant an impact of partisanship on economic expectations. When the same consumers were re-interviewed from six months ago, the survey recorded extreme swings based on political party affiliation, with Democrats becoming much more pessimistic and Republicans much more optimistic. Such divergences will ultimately converge since consumers hold economic expectations to be useful decision guides, which will require both sides to temper their extreme views. [More…]
See the chart below for a long-term perspective on this widely watched indicator. Recessions and real GDP are included to help us evaluate the correlation between the Michigan Consumer Sentiment Index and the broader economy.

…read more from FinancialSense.com HERE
…also:

Strengths
- The best performing precious metal for the week was platinum, up 0.74 percent. Silver also clocked a positive gain of 0.28 percent. Economic growth in the U.S. slowed more than forecast last quarter on the biggest trade drag in six years, reports Bloomberg. Net exports subtracted 1.7 percentage points from expansion in the October – December period, as dollar strength likely was a drag on growth. Should the new Trump administration push for a weaker dollar, this could lend support to gold.
- China purchased a net 47 tons of bullion in November, according to data from the Hong Kong Census and Statistics Department and compiled by Bloomberg. Additionally, shipments of gold from Switzerland to China surged more than fivefold to 158 tons in December, Bloomberg continues, the highest since at least January 2014. Appetite for gold is soaring ahead of the Lunar New Year.
- According to Bloomberg, the four ETFs backed by gold that have attracted the most money this year are all based in Western Europe. Xetra-Gold, listed in Frankfurt, tops the list by bringing in around $544 million last week. Europeans are turning to the gold on fears that Trump’s “America first” rhetoric will impede global economic growth.
Weaknesses
- The worst performing precious metal for the week was palladium, down 6.65 percent. The metal is headed for its worst weekly drop in more than a year. CPM Group reported they see palladium and platinum in surplus for the next few years and estimated there are 25 million ounces of palladium in stockpiles, most held by investors.
- Physical gold demand fell in 2016 to its lowest level since 2009, reports Reuters, as increased prices weighed on appetite for the metal. GFMS, a research unit of Thomson Reuters, also notes that gold jewelry demand is at a 28-year low. Jewelry consumption is down 9.7 percent year-over-year at 551 metric tons in the fourth quarter.
- As U.S. equities looked to extend a rally on Friday, gold retreated for what might be a fourth-straight day of losses. However, real rates dropped a bit before the market open and gold eventually crawled into positive territory. “Gold was due for a short-term pullback, after rallying almost non-stop since late December,” Jordan Eliseo of Australian Bullion Co. said. “Strength in equity markets, with the Dow topping 20,000 points, soft physical markets and a greater focus on rate hikes from the Fed has seen the metal sell off.”
Opportunities
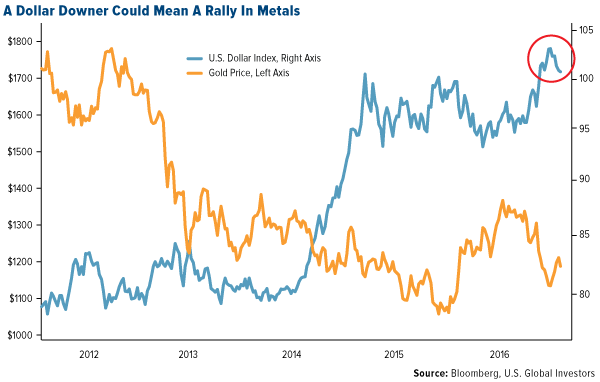
- UBS says the dollar has peaked and is likely to decline this year under President Trump, reports Bloomberg. The wealth management unit at UBS expects the currency’s future weakness to boost the price of base and precious metals. “We hold that view because we see real interest rates going deeper into negative territory.” Earlier in the week Steve Mnuchin also commented on the dollar, defying two decades of convention at the office of the U.S. Treasury Secretary by stating, “From time to time, an excessively strong dollar may have negative short-term implications on the economy.” In a similar note, Brown Brothers Harriman noted a recent St. Louis Fed study which showed how a strong dollar from 2014 to 2016 was associated with a drag on growth from net exporters.
- According to BlackRock, inflation is rising faster than many investors may realize, citing examples such as rising housing prices, uncontained medical inflation, rising wages and more. So what does this mean for investors? BlackRock says, “Should inflation expectations rise faster than nominal rates, gold is likely to continue to merit a place in most portfolios.”
- The World Gold Council believes the Indian government should lower the taxes on gold, currently at 13 percent, to help curb smuggling and promote transparency in local gold trade, reports Bloomberg. With a high customs duty, gold is being imported through the unofficial channel, the article continues. If India wants to eliminate corruption, a high tariff only encourages smuggling.
Threats
- BNP Paribas SA, the top gold and precious metals forecaster in the fourth quarter according to Bloomberg, expects the Federal Reserve to go “rapid-fire” on interest rates, boosting them every quarter in 2018. This tightening will strengthen the U.S. dollar and push gold down toward $1,000 an ounce, reports Bloomberg.
- The forecasted gold demand recovery from a seven-year low in India has been delayed, according to the World Gold Council. The WGC says gold consumption in the country will not return to normal levels until 2018, as a liquidity squeeze tightens spending this year, reports Bloomberg. In a report published Tuesday, the group estimates India’s usage between 850 metric tons to 950 tonnes by 2020 versus demand of 650 to 750 tonnes in 2016.
- Two of the biggest gold producers in South Africa, Sibanye Gold and AngloGold Ashanti, have been accused of putting workers’ lives at risk, reports Bloomberg. The Department of Mineral Resources argues that the companies are unwilling to follow the laws, while the two miners have criticized government inspectors for being too heavy-handed in temporarily closing mines for safety breaches, the article continues. AngloGold won a court ruling in October that blocked one such closure and Sibanye is suing Minister Mosebenzi Zwane and other officials for compensation after its Kroondal platinum mine was closed. Over the past decade AngloGold has reduced operating fatalities by more than 80 percent.

Our recent analysis bases on a previous report of the potential for a further run in the US markets based on a number of technical and fundamental factors leads to the question of “what could happen with Gold and Silver”. A broad US market rally may put some pressure on the metals markets initially, but, in our opinion, the increase in volatility and uncertainty will likely prompt more potential for upward price action in precious metals.
As with most things in the midst of uncertainty and transition, the US Presidential election has caused many traders to rethink positions and potential. As foreign elections continue to play out, wild currency moves are starting to become more of a standard for volatility. Combine this with a new US President and a repositioning of US global and local objectives and we believe we are setting up for one of the most expansive moves in recent years for the US general markets and the metals markets. This week, alone, we have seen a flurry of action in DC and the US markets broke upward on news of the Dakota Pipeline and other Executive actions.
As we wrote week or so ago, we believe the US markets will push higher in 2017 a business investment, US strategy and foreign capital runs back into the US equity market chasing opportunity and gains. Additionally, we believe the strength of the US market, paired with continued strength of the US Dollar, will drive a further increase in global volatility and wild swings in foreign markets. This volatility, uncertainty and equity repositioning will likely drive Gold and Silver to continued highs throughout 2017 – possibly much longer if the new trend generates renewed follow-through.
Our belief that the US markets will continue to melt-up while certain foreign markets deteriorate relates to our belief that currency variances will become more volatile and excessive over the next few months. This, in combination with a renewed interest in developing US economic solutions, will likely drive the US markets higher while the metals markets will continue to become a safe-haven for US and foreign investors to protect against deflation and foreign market corrections.
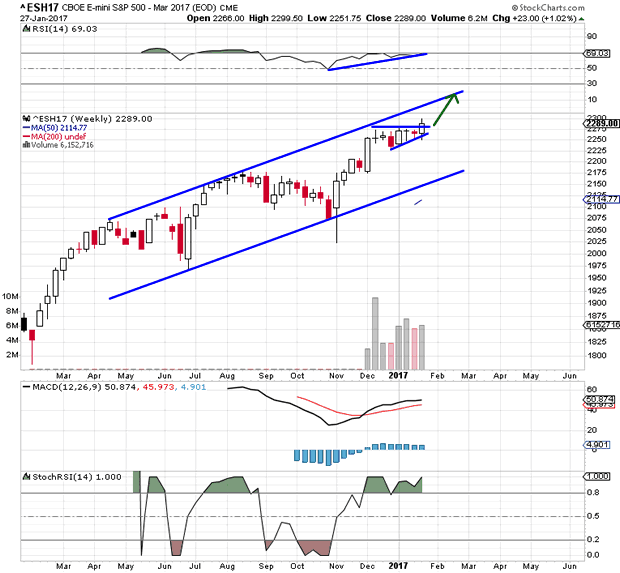
S&P Futures are setting up a clear bullish pennant/flag formation that will likely prompt an explosive price move within 2~3 weeks. This bullish flag formation is likely to drive the ES price higher by roughly 100+ pts. Currently, strong resistance is just above 2275, so we’ll have to wait for this level to be breached before we see any potential for a bigger price move.
SP500 Weekly Chart
SP500 Daily Chart

GOLD is channeling in a very clear and narrow upward price channel and trading in the middle of a support zone. The recent reversal, near the end of 2016, was interesting because GOLD trailed lower after the US election, but then reversed course just before the new year. The interesting fact about this move is that this new upward swing in GOLD correlates with the beginning of the Bullish Flag in the S&P Futures as well as a decrease in volatility. We believe as this Bullish Flag will prompt a jump in volatility and price action that will result in is a strong push higher in GOLD.
GOLD Weekly Chart

Gold Daily Chart

SILVER is setting up in a similar manner as GOLD. Although the SILVER chart provides a clearer picture of the downward price channel that is about to be breached – and likely drive both SILVER and GOLD into a new bullish rally. The support Zone in SILVER, between $16.60 ~ $17.40 is still very much in play. SILVER will likely stay within this zone while the Bullish Flag plays out. Yet, when the breakout begins, a move above $18.00 will be very quick and upside targets are $18.50~18.75 and $19.50~$20.00 (possibly much higher in the long run).
Silver Weekly Chart

Silver Daily Chart

EUR/USD correlation to the US moves should be viewed as measure of strengthening US economy/USD as related to foreign market volatility and potential. As the USD strengthens, this puts pressure on foreign governments and global transactions based in USD. This also puts pressure on the METALS markets because billions of people around the globe consume precious metals as a “safe-haven” related to currency volatility. We expect the EUR/USD levels to fall near “parity” (1.00) again and possibly dip below parity based on future foreign election results. This volatility and uncertainty will translate to increased opportunity for GOLD and SILVER to run much higher over the next few months.
EURUSD Daily Chart

USDMXN Daily Chart

USDGBP Daily Chart

Right now is a fantastic opportunity to take advantage of these lower prices. We may see rotation near to the lower support zone levels as price rotates over the next few weeks. The key to any trade in the metals market is to understand the potential moves and watch for confluence and volatility in other markets. We believe the next few weeks/months will be very telling. If we are correct, we’ll see new highs in the US markets fairly quickly and we’ll see a new potential bullish breakout in GOLD and SILVER.
You can follow our weekly analysis and trade ideas at www.TheMarketTrendForecast.com

Fund manager John Hussman is always good for dramatic charts. Here’s a recent one:

This ratio is even scarier than it looks, says Hussman:
Historically-reliable valuation measures now approach those observed at the 2000 bubble peak. Yet even this comparison overlooks the fact that in 2000, the overvaluation featured a subset of very large-capitalization stocks that were breathtakingly overvalued, while most stocks were more reasonably valued (see Sizing Up the Bubble for details). In many ways, the current speculative episode is worse, because it has extended to virtually all risk-assets. To offer some idea of the precipice the market has reached, this chart shows the median price/revenue ratio of individual S&P 500 component stocks. This median now stands just over 2.45, easily the highest level in history. The longer-term norm for the S&P 500 price/revenue ratio is less than 1.0. Even a retreat to 1.3, which we’ve observed at many points even in recent cycles, would take the stock market to nearly half of present levels.
One of the reasons share prices have risen so dramatically relative to revenues is that corporations are earning a lot more on each dollar of sales these days. How are they doing that? By squeezing their workers. The following chart, from the Economic Policy Institute shows labor’s share of corporate income plunging recently.

The next chart illustrates the same point from a different angle. Workers, it seems, have been producing more per hour but their pay hasn’t kept up as their bosses held onto more of the resulting profit.

A big part of this has been due to offshoring. If you close a factory where the workers make $30 an hour and set up in a place where your new workers make $5, then the $25 difference flows to the bottom line. Other contributors are automation, which is both inexorable and hugely favorable for the guys who own the robots, and the fact that the minimum wage in many states has kept up with neither the true inflation rate nor the increase in free-trade driven corporate earnings.
As EPI’s Josh Bivens puts it:
This 6.8 percentage-point decline in labor’s share of corporate income might not seem like a lot, but if labor’s share had not fallen, employees in the corporate sector would have $535 billion more in their paychecks today. If this amount was spread over the entire labor force (not just corporate sector employees) this would translate into a $3,770 raise for each worker.
For stock market investors, the scary thing about this imbalance between capital and labor is that it’s only temporary. As the details and magnitude of the scam have been exposed, the political tide has shifted. At the national level, fed-up US workers have installed an anti-free trade administration that is already tilting the playing field towards domestic workers. At the state and local level, calls for a higher minimum wage are being heard and acted upon. A major French party has even nominated a presidential candidate who wants to tax robots.
So it’s safe to assume that the above charts will develop serious inflection points going forward, as a rising share of profits flow to the nether regions of the org chart and investors respond by lowering the value they place on a given dollar of corporate revenues.
As Hussman notes, just a return to 1990s valuation levels would cut the average US stock in half.


-
I know Mike is a very solid investor and respect his opinions very much. So if he says pay attention to this or that - I will.
~ Dale G.
-
I've started managing my own investments so view Michael's site as a one-stop shop from which to get information and perspectives.
~ Dave E.
-
Michael offers easy reading, honest, common sense information that anyone can use in a practical manner.
~ der_al.
-
A sane voice in a scrambled investment world.
~ Ed R.
Inside Edge Pro Contributors

Greg Weldon

Josef Schachter

Tyler Bollhorn

Ryan Irvine

Paul Beattie

Martin Straith

Patrick Ceresna

Mark Leibovit

James Thorne

Victor Adair