
Asset protection
 The latest readings from the weekly American Association of Individual Investors survey show a drop in bullish opinion among mostly self-directed investors. At the same time, “everyone else” remains steadfastly, and extremely, bullish. While individuals are looked down upon as the dumb money, that has not been an accurate statement, especially over the past decade…

 We see the forensic “finger prints” all over the economic and financial data that the Federal Reserve through a proxy likely Citadel Capital (or the Fed’s CBOE Volume Options Agreement) has highly likely been buying the US equity market since its QE 3 “TAPER” ended in October 2014. We do know for a fact that the BOJ, SNB, PBOC, Norwegian and other central banks have been doing this as matter of normal monetary policy for some time and that 80% of all these central banks said they plan on buying more stocks this year. Why not the Federal Reserve? To see the forensic economic evidence more clearly, consider the following US indicators:
Ratio of Capital Goods To Consumer Production
Pater Tenebrarum via Acting-Man.com points out, the ratio of capital goods to consumer goods production is a reflection of the policy-driven credit bubbles of recent decades. We have annotated his chart below to show more clearly both the “control channel” underway since the Greenspan era, as well as the late 2014 QE “TAPER” ending “inflection point”. Tenebrarum reports:

Currently the ratio is in a sideways channel at an extremely high level, as strong money supply growth and credit expansion have continued almost unabated since 2008. There is a natural limit to this trend though, provided the central bank does not opt for extreme inflation (we currently assume that it won’t, but this assessment may have to be changed in the future).
There is a strong and not exactly unreasonable suspicion that most of the economic policies favored by the Trump administration (at least some of which will presumably be backed by the Republican-controlled legislature) are likely to push price inflation up. Higher government spending, tariff hikes, the possible deportation of cheap illegal workers, etc., are all deemed to lead to higher consumer prices.
Keep in mind in this context that the inter-temporal price distortions along the production structure triggered by the Fed’s loose monetary policy in recent years are fated to eventually shift and reverse anyway.
Resources have been miscalculated as too much has been invested in the higher stages of the economy’s capital structure relative to the lower stages.
Eventually a bottleneck should emerge in terms of the demand for and supply of final goods, in conjunction with hitherto suppressed natural interest rates reasserting their influence on market rates.
The problem is that the real savings needed to support and maintain a lengthened production structure never existed – they were an illusion created by the printing press. The same holds for the decline in consumer demand implied by an increase in savings – it simply hasn’t happened (at least not to the extent indicated by market interest rates). The real funding for long term investment projects still needs to come from somewhere though.
It such investments are not supported by an increase in real savings, capital will be consumed. The falsification of economic calculation engendered by prices that have been distorted by credit expansion inter alia leads to the reporting of illusory accounting profits – later it turns out that capital maintenance has been lacking and the previously reported profits turn into very large losses (think about 2008/2009 as the most recent example of such an “unmasking”). At some point the capital consumption will be reflected by a surge in market interest rates and a shift in prices. Many of Trump’s policy proposals (if implemented) are likely to hasten this process, ceteris paribus.
Economic Output Composite Index
The following chart is from Lance Roberts which we have also taken the liberty to mark-up. here we can see the impact of the Fed ending its various programs and then being forced to start yet another program to keep the US Economic engine from stalling and plunging the US into a recession — or worse! On the surface it would appear that after QE “TAPER” ended the Fed completely moved to the sidelines.
But is this in fact the case?

Earning Divergence
At precisely the end of the QE “TAPER” program we again witness another inflection point. This time it is the divergence of the S&P 500 from earnings as measured by the 12 month trailing EPS.
Something or someone began supporting and lifting the market at the end of the Fed’s QE “TAPER” program.
Who would have had the motive, money and means to do this – and also chose this timing to do it???

Circumstantial evidence? I suspect the court of public opinion would return a conviction.
Federal Reserve Programs
We have been expecting this type of Fed action and suspected it was occurring for some time, especially after Janet Yellen suggested this as a real possibility and “benefit” in September 2016.
If this is in fact the case, it will become more pronounced going forward and drive the markets potentially into “Minsky” type melt-up.

Signup for notification of the next MATASII Macro Insights

Tonight I would like to update the Basic Materials sector as this area now looks like it’s ready to resume its bull market. Also with the stock markets breaking out today, especially the INDU, this adds another layer of confirmation that the breakout is the real deal. As we’ve discussed previously there are many big cap Dow stocks that make up the XLB, Basic Materials fund, and with the INDU making a new all time high today there will be some individual components making new all time highs as well.
Lets start by looking at a weekly chart for the XLB, Basic Materials fund, that is breaking out of a bullish rising flag this week. This bull flag has been building out since last spring and now the price action is trading into new all time highs. There was a conventional bull flag that formed between 2015 and 2016 that sloped down.
That down sloping black flag started to form after the 7 point bearish rising wedge completed.

 “Dow Jones 20,000 thanks to The Donald…To the Moon, Alice…whew-hew!”
“Donald Trump slays all dragons: mainstream media, leftists and doubters!”
“Donald Trump is the cause of all evils real and imagined, past, present and future!”
The first headline is partly real and timely, the second is my paraphrasing the recent coverage from supportive media outlets. The last one is from every other media outlet, including the CBC…your income tax dollars at work!
I’m starting with these three “headlines” because they illustrate both the spirit of the current environment, and the risks of our media-pervasive modern society. All of this noise is a big distraction from the real action, and it’s very dangerous. Times like these remind us that “mass media mimics – and sometimes manipulates – mass mania.” For some, the mania is a victory parade, and for others it’s a lynch-mob delicately described as a “march” with vulgar hats.
Here’s why you should care: when we are in a highly emotional state, we ALL make emotionally-based decisions; this extends to investment decision making as well. No one is immune to good or bad emotions, and we cannot mask or restrain negative/destructive emotions without doing the same to positive/constructive emotions. For curious minds, please look up Brene Brown’s various TED Talks.
Too much optimism is dangerous, especially if it’s connected to a story, person or movement that we identify with passionately; call it attachment of our ego. Don’t get me wrong, I’m happy that Hillary Clinton didn’t win the Whitehouse, but this isn’t about Donald Trump…despite the fact that he’s showing himself to be a man of swift action, and appears to be following through on his major campaign promises.
This aspect alone has opposing pundits in awe, bewildered, whining and enraged. Thus, Trump supporters are highly likely to be the most at-risk here in terms of buying near a short-term top since their political exuberance is masking their “higher-order executive functions” that produce disciplined investment decision making. While the MSM attacks him on every issue (petty and material), his supporters are growing emotional blinders via over-confidence. Go ahead and enjoy the victory parade, but be smart about it, please.
Why the wet blanket language? Since risk and reward are directly connected to price movements in the medium of time, we know from history that true investment risk is lowest when prices are lowest (and fear of loss of capital is highest) and conversely that risk is highest when prices are highest.
Most describe the emotion of market tops as “Greed” but that’s a misnomer; I believe what most investors feel near market tops (especially at new all-time highs) is actually fear of missing out on gains. This fear of missing out is exacerbated for those who sold near the last bottom based on fear of loss of capital…and they repeat their destructive behaviours of selling low and buying high.
Regardless of who’s in political power, it’s the underlying economic trends that matter. Money is a form of energy, and we know that energy moves in waves and cycles in a dynamic and complex inter-play. This is the entire basis of Martin Armstrong’s ECM and Socrates™ computer models, which remove human emotion, bias and opinion from the mix. The mainstream chatter is a dangerous distraction from the underlying reality, so we need to focus on the data.
What’s happening right now with currency, equity and government bond markets and US-bound capital flows has been forecasted in Marty’s models for many years, long before Donald Trump announced his campaign in the summer of 2015. Donald J. Trump is merely the lead actor is this grand screenplay of energy flows.
So, whether you’re sitting on a lump sum that is “missing out” on recent gains, or fully invested and wondering about de-risking your portfolio, this is the time to go back to your carefully crafted Investment Policy Statement that you agreed to when your emotions were in a more subdued state, and your decision making was dominated by your higher-order executive functions. This is the time to return to your fundamentals, to your Life Goals; and to re-affirm your commitment to making intelligent investment decisions…not emotional decisions.
Patience and Discipline are accretive to your wealth, health and happiness – so focus on these.
I’m looking forward to participating in The World Outlook Financial Conference next week, including presenting a couple of Personal Finance Workshops on investing lump sums and other timely topics.
Cheers,
Andrew H. Ruhland, CFP, CIM

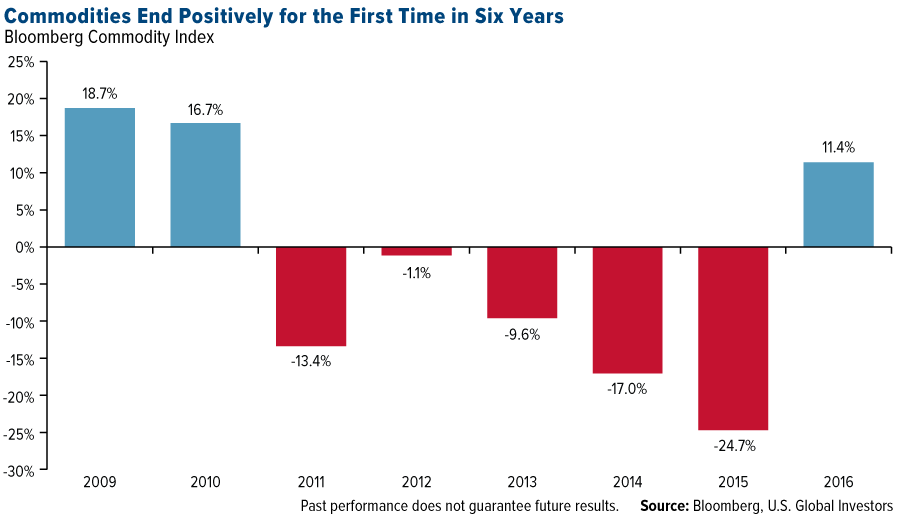
Commodity investors have had to endure a dry spell for a while now, but those days are starting to look as if they might be behind us. We see encouraging signs that a bottom has been reached and a new commodities super-cycle has begun, as global manufacturing expansion and inflation are finally gathering steam following the financial crisis more than eight years ago.
As a group, commodities had their first positive year since 2010, ending 2016 up more than 11 percent, as measured by the Bloomberg Commodity Index.
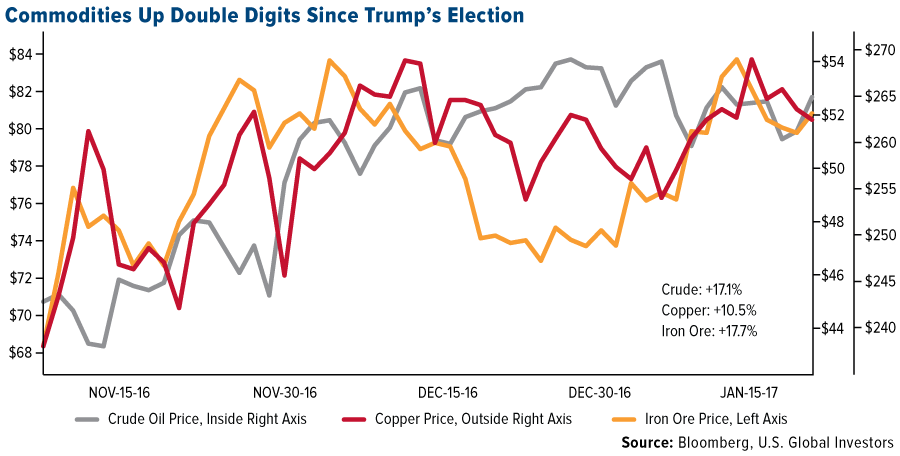
A large percentage of this growth occurred in the days following the U.S. election, suggesting the reflation trade is officially in motion, which should be supported in the coming weeks and months by President Donald Trump’s pro-growth policies.
Just this week, Trump signed executive orders to proceed with the controversial Keystone XL and Dakota Access pipelines, emphasizing that the steel to be used in their construction will be American-made. Following the announcement, stock in energy infrastructure company TransCanada, which is expected to resubmit plans for the pipeline after it was rejected by the Obama administration, immediately hit a new high, while shares of several steel companies traded up.
Between Election Day and Inauguration Day, the commodities index rose 5.4 percent, with double-digit growth in crude oil (up 17.1 percent), copper (10.5 percent) and iron ore (17.7 percent).
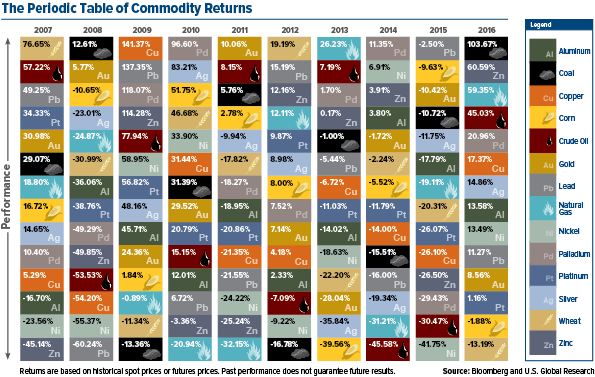
Of the 14 commodities that we track in our ever-popular Periodic Table of Commodity Returns—which has been updated for 2016 and is available for download—only two ended the year down: corn and wheat. All this, following the group’s worst annual slump since the 2008 financial crisis.
Investment Banks Turn Bullish on Commodities
Back in May, Citigroup was first to say that the worst was over for commodities, and in December it made the call that most raw materials were poised to “perform strongly” in 2017 on global fiscal stimulus and economic expansion.
Now, for the first time in four years, Goldman Sachs has recommended an overweight position in commodities, following reports that revenue from commodity trading at the world’s 12 biggest investment banks jumped 20-25 percent in the fourth quarter of 2016 compared to the same period in 2015.
As reported by Bloomberg, Goldman’s head of commodities research, Jeffrey Currie, drew attention to the “cyclical uptick in global economic activity,” which is “driving demand, not only for oil but all commodities.”
“U.S. and China are focal points where we’re seeing the uptick,” Currie continued, “but even the outlook for Europe is much more positive than what people would have thought six months to a year ago.”
Indeed, manufacturing activity continues to expand at a robust pace, with January’s preliminary purchasing managers’ index (PMI) for the U.S. and the eurozone registering an impressive 55.1 and 54.3, respectively. We won’t know China’s January PMI until next week, but in December it improved at its fastest pace in nearly four years. As I shared with you earlier this month, the global manufacturing PMI expanded for the fourth straight month in December, reaching its highest reading since February 2014. I’m optimistic that it will expand again in January.
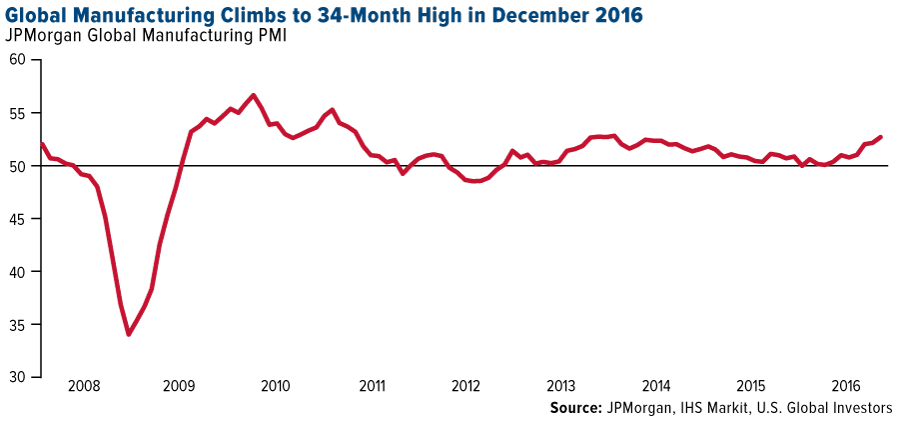
Again, we closely monitor the PMI, as our research has shown that it can be used to anticipate the performance of commodities and energy three and six months out. It looks as if the world’s big banks have begun to acknowledge this correlation as well. With the health of global manufacturing trending up, we see commodities demand following suit in the coming months.
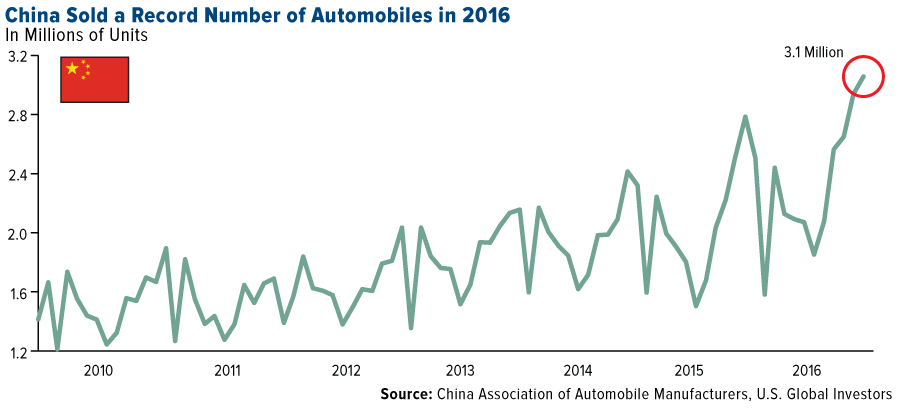
Number of Auto Sales Hits an All-Time High
Case in point: auto sales. Last year marked a new record high, with 88.1 million cars and light commercial vehicles driven off of car lots. That figure was up 4.8 percent from 2015.

China was the standout, which increased sales 13 percent and saw 3.2 million new units sold. It should be noted, however, that sales were assisted by a 50 percent tax cut on smaller vehicles, which is no longer in place.
But consider this: Here in the U.S., the average age of cars and light trucks continues to creep up and is now 11.6 years, as of January 2016, according to IHS Markit. Improvements in quality is the main reason for the increase.
Even so, these aging vehicles will need to be replaced in the next few years, meaning domestic auto sales should remain strong. This bodes well for platinum and palladium, both of which are used in the production of catalytic converters.
But what about electric cars, which have no need for catalytic converters since they’re emissions-free? As I’ve shared with you before, electric cars—the demand for which continues to climb—use three times more copper wiring than vehicles with a conventional internal combustion engine.
There’s always an opportunity if you know where to look!

-
I know Mike is a very solid investor and respect his opinions very much. So if he says pay attention to this or that - I will.
~ Dale G.
-
I've started managing my own investments so view Michael's site as a one-stop shop from which to get information and perspectives.
~ Dave E.
-
Michael offers easy reading, honest, common sense information that anyone can use in a practical manner.
~ der_al.
-
A sane voice in a scrambled investment world.
~ Ed R.
Inside Edge Pro Contributors

Greg Weldon

Josef Schachter

Tyler Bollhorn

Ryan Irvine

Paul Beattie

Martin Straith

Patrick Ceresna

Mark Leibovit

James Thorne

Victor Adair