Economic Outlook

The End of Big Government?

On President Trump’s first day in the Oval Office, he made good on his campaign promise to “rip up” trade deals he thinks are unfavorable to the U.S. economy by withdrawing from the Trans-Pacific Partnership trade negotiations.

And mark my words, this is only the beginning.

Not long after Trump’s election win – a surprise to most investors, but an outcome I predicted in advance thanks to my cycle analysis – I’m on record saying: “I have no doubt that he will follow through on this promise. He was clear about one goal throughout his campaign: Getting much tougher on trade relations.”

My cycles and AI models warned you to expect chaos in the global economy and financial markets, including a worldwide sovereign bond crisis. This was long before Mr. Trump even decided to run for president.

Screen Shot 2017-01-25 at 7.06.47 AMThe truth is, we were heading down this path no matter who became our next Commander in Chief. But the fact that Donald J. Trump is our 45thpresident at this critical time in our nation’s history, indeed in the annals of world history, fits in perfectly with my cycle analysis.

Look, this is the guy who authored “The Art of the Deal” and “The Art of the Comeback.” So make no mistake, he fully intends to use the same hard-ball negotiating tactics when it comes to a broad range of issues including:


  • Foreign trade talks…
  • Confronting China …
  • Levying tariffs and taxes on imports …
  • Even combating Isis and terrorism in general


As I said, this is just the beginning. Going forward, expect more divisive politics and social unrest that will make the million-women march look like a tea party. Ultimately, you can expect an end to the era of big government, not just in the U.S., but worldwide.

The old order that has been in place since WWII is about to come crashing down. The era in which governments amassed an unsustainable $275 trillion in total debts and obligations is quickly coming to a painful end.

Best wishes,

Larry

P.S. We are in for five years of chaos in the economy, the markets and in our business and personal lives. As this supercycle courses through the world economy in the months ahead, the investors our governments count on for loans will snap their wallets shut. Even now, investors are reading the handwriting on the wall: Government debt is simply too massive. It can never be repaid. It would be financial suicide for them to continue loaning their money to Brussels, Tokyo or Washington; insane to throw good money after bad. And so, governments — including our own — will simply run out of money. Read more here …

Financial markets, global currencies, even our societies have been built on this shaky foundation of debt, and it’s about to topple. Over the next four years, President Trump and his policies will play a key role in these events, just as my cycles forecast.

Be Aware Of These Crowded Trades: WTI Crude, Natural Gas, And The U.S. Dollar

Summary

– Commodities: Money managers are extremely long copper and WTI crude futures. Commodity producers are actively hedging future cotton and natural gas production at current prices.

– Currencies: Everybody’s long the U.S. Dollar relative to other foreign currencies.

– Stocks: Surprisingly, hedge funds have shorted a ton of S&P futures over the past two weeks. Net positioning levels are still quite optimistic though.

This is the 43rd weekly update that outlines how traders are positioned and how that positioning has recently changed. I break down the updates by asset class, so let’s get started.

Commodities

Money managers are extremely bullish on copper (NYSEARCA:JJC).

47125416-14851148707904203

…..to view all assett classes & larger charts go HERE

…also:

Crude Oil – Maxed Out & On The Brink of a Significant Move

First published Sat Jan 21 for members:  Bulls and bears in this complex probably need a Xanax by now.  This market has swung so dramatically over the last several years that many are probably so whipsawed that they don’t know which way is up.  But, for now, the market is setting up in a manner to take us up even further in 2017, and potentially even further than many believe. 

As I noted last weekend, silver has finally joined the party, and has completed quite a full 5 waves up off the lows, and potentially even more.  And, as stated last weekend, since everyone was looking for a pullback coming into this past week, the market did just the opposite and continued higher early in the week.  So, can we see more of a pullback in the coming week?

Well, I will say that a further pullback in silver would provide us with a really nice inverted heads and shoulders in the silver chart.  But, again, that just may be too easy.  You see, when the greater market sees the potential for any type of heads and shoulders patterns, especially bearish ones, they rarely play out as most expect.  Most of the time, they simply set up the bears on what seems to be an initial trigger of the pattern by a break of the neckline, only to see a strong reversal catching all the shorts by surprise as the heads and shoulders invalidates and turns the market up strongly.  This is what I warned about months ago in the GDX, and exactly what happened in the complex over the last month.

But, since inverted heads and shoulders are not as closely followed, it does have a better shot at working out.  Moreover, as standard heads and shoulders do not usually have a high probability of playing out, one that is supported by an Elliott Wave count usually has a much higher probability of triggering.  And, if we do see this inverted heads and shoulders playing out, it will be supported by a strong bottoming structure in silver, followed by a (1)(2) impulsive bullish structure, as presented on the 144-minute chart.  The support for such a wave (2) pullback in silver resides between 16.10-16.50.

As far as the GDX is concerned, our main support resides between 20.50-21.65.  As long as any further drops maintain over that support region, we must view the market bullishly, and setting up to head back towards the highs of August 2016.  Moreover, any immediate break outs through the 24 region, with strong follow through over 25.10, without any further pullbacks early in the upcoming week, would suggest we are on way back to the August high sooner rather than later.  Such a break out would be confirmed by silver breaking out through the downtrend line on the 144-minute chart, which is approximately within the 17.50 region.

In GLD, the relevant support resides between 110.50-112.65.  And, as long as we remain over that support, we need to continue to view this market bullishly.

So, while we can certainly see more downside consolidation in the upcoming week in the metals complex, and even have micro set-ups for it to occur, my suggestion is to be positioning yourself on the long side of the market as long as we remain over the relevant support cited above.  A strong break out in silver over the 17.50 region is the main signal for which I will be watching to suggest that the consolidation is over, and we are on our way back to the August 2016 highs before the next larger consolidation I expect later this year, potentially in the spring of 2017.

See charts illustrating the wave counts on the GDX, GLD and Silver (YI) at https://www.elliottwavetrader.net/scharts/Charts-on-GDX-GLD-Silver-201701231473.html.

Avi Gilburt is a widely followed Elliott Wave technical analyst and author of ElliottWaveTrader.net (www.elliottwavetrader.net), a live Trading Room featuring his intraday market analysis (including emini S&P 500, metals, oil, USD & VXX), interactive member-analyst forum, and detailed library of Elliott Wave education.

2017’s Real Milestone (Or Why Interest Rates Can Never Go Back To Normal)

Forget about NAFTA or OPEC or TPP or crowd size or hand size or any other acronym or stat or concept that obsesses the financial press these days. Only two numbers actually matter.

The first is $20 trillion, which is the level the US federal debt will exceed sometime around June of this year. Here’s the current total as measured by the US Debt Clock:

Debt-clock-Jan-17-2

To put $20 trillion into perspective, it’s about $160,000 per US taxpayer, and exists in addition to the mortgage, credit card, auto, and student debt that our hypothetical taxpayer probably carries. It is in short, way too much for the average wage slave to manage without some kind of existential crisis.

It’s also way more than it used to be. During his tenure, president George W. Bush (2000 – 2008) nearly doubled the government’s debt, which is to say his administration borrowed as much as all its predecessors from Washington through Clinton combined. At the time this seemed like a never-to-be-duplicated feat of governmental profligacy. But the very next administration topped it, taking the federal debt from $10 trillion to the soon-to-be-achieved $20 trillion. And the incoming administration apparently sees no problem with continuing the pattern.


Federal-debt-Jan-17

The other meaningful number is 6.620. That’s the average interest rate the US government paid on its various debts in 2000, the year before the great monetary experiment of QE, ZIRP and all the rest began. When talking heads at the Fed and elsewhere refer to “normalizing” interest rates they’re proposing a return to this 6% average rate.

But of course the last time that rate prevailed our debts were just a little lower. Run the numbers on today’s obligations and you get, well, let’s see:

$20 trillion x 6% = $1.2 trillion a year in interest expense. To put that in perspective…

  • It’s $15,000 a year per family of four, or about a fourth of what the typical American family earns.
  • It’s 31% of the federal budget, which would mean massive cuts in every other spending program.

The conclusion: It can’t happen without causing one of the following:

  • Government spending cuts and/or tax increases that impose Greek-style austerity on Americans who won’t respond well to their sudden demotion to Third World status.
  • A new round of monetary experiments involving the “forgiveness” of the government’s debts, financed with newly-created dollars. This will work – as long as dollars remain universally accepted as a store of value. History offers no examples of such a thing.
  • An overt effort to devalue the dollar, with the goal of paying the interest in full, but (again) with newly- created, much-less-valuable currency.

The resulting dilemma: If we hope to live within our means interest rates can never be allowed to rise. But if interest rates don’t rise, the Fed is forced to create a tsunami of new dollars to keep rates low, and must take its chances with inflation, currency war, crack-up boom, and all the other black swans that live in the land of monetary excess.

Which is why the sound money community keeps harping on gold. All the politically-acceptable policy options have inflation/devaluation at their core, and those things are always and everywhere great for real assets.

…related: Bill Gross: Bond Fundamentals Confusing

“America Works… Never Bet Against America”

COMM-never-bet-against-america-warren-buffett-01202017

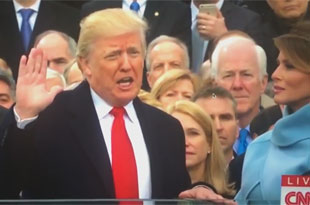
And like that, it happened. Despite the polls, despite what anyone believed was possible, including many of his own supporters, billionaire developer Donald J. Trump was sworn in as the 45th President of the United States.

Whether you agree with him not, he’s now leader of the world’s largest economy and commander of history’s most powerful military force.

This is something that could only happen in the U.S.

President Trump and now-former President Barack Obama couldn’t be more different in their backgrounds, visions and leadership styles—more so than any other two men whose administrations happen to adjoin the other’s.

And yet the transition went remarkably smoothly and orderly.

I don’t believe there’s ever been such a meaningful and potentially consequential transfer of power in U.S. history, with the incoming president all but promising to undo every last policy of his predecessor, line by line. That Obama peacefully and cordially handed over the executive office to a man who led the charge in questioning his legitimacy for a number of years is a testament to the strength and durability of our democratic process.

It’s a process that’s key to America’s exceptionalism.

Although I don’t always agree with Trump, it saddens me to see so much negativity about him in the media and protests in the streets. Now that he’s president, the time has come to unite behind him and root for his success. If he succeeds, America succeeds. If he fails—as many seem to hope for—America fails.

Take Warren Buffett. He backed Hillary Clinton throughout the primaries and general election. And yet on the eve of Trump’s inauguration, he said he supported the new president and his cabinet “overwhelmingly,” adding that he’s confident America “will work fine under Donald Trump.”

I think what Buffett recognizes is that the vast majority of people who voted for Trump did so for the right reasons. Throughout his campaign, Trump’s promise to bring back American jobs and secure the nation’s borders resonated with everyday folks who have begun to feel overlooked. Entrepreneurs, small business owners and those working in the financial industry found hope and encouragement in his pledge to lower corporate taxes and roll back regulations.  (Just today, Trump told a room full of CEOs that he promised to cut regulations “by 75 percent, maybe more.”) I believe most Americans, regardless of political ideology, want these things—which is why we saw such a large number of people who previously voted for Obama give Trump their vote this time.

As I often say, government policy is a precursor to change, and we’re likely about to see some sweeping changes. But as investors, it’s as important as ever that we don’t panic or get distracted by the noise. Instead, continue to focus on the fundamentals and keep your eyes on the long-term prize.

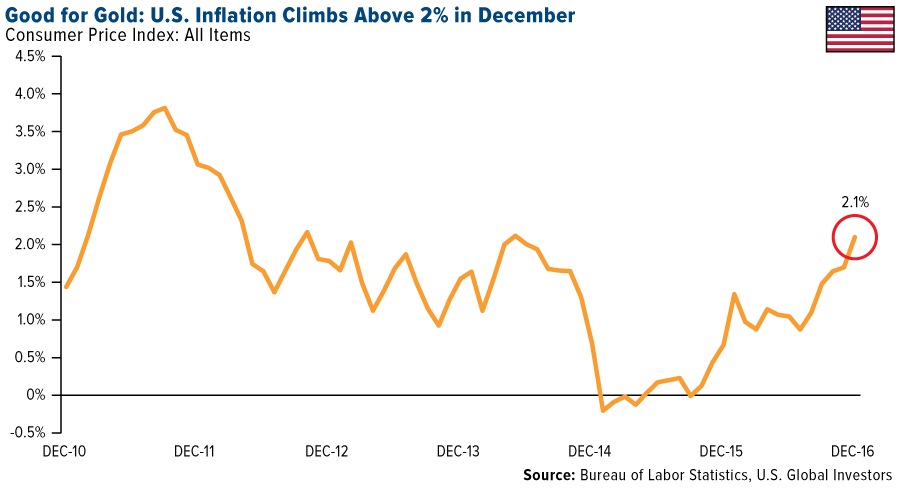
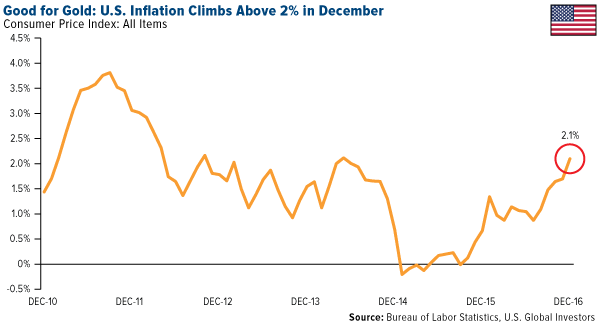
Inflation Plays Catch-Up

Inflation, as measured by the consumer price index (CPI), got a strong jolt in December, rising 2.1 percent year-over-year, its fastest pace in at least two-and-a-half years. Higher gasoline prices—which rose more than 8 percent in December—and health care costs were the main culprits, with medical bills surging the most in nine years.

Good for Gold: U.S. inflation climbs above 2% in December
click to enlarge

Although they might hurt your pocketbook, pricier goods and services have historically been constructive for gold, as I’ve explained many times before. In August 2011, when gold hit its all-time high of $1,900 an ounce, inflation was running at 3.8 percent and the government was paying you an average 0.23 percent on the 2-year T-Note. That means investors were earning a negative 3.5 percent return, which helped boost gold’s “safe haven” status.

I expect CPI to continue to climb throughout this year and next, supported by additional interest rate hikes—two or three in 2017 alone—and President Trump’s protectionist policies.

The metal’s investment case could be strengthened even more now that Trump has officially been sworn in. His personal shortcomings and public office inexperience might raise more than a few “unknown unknowns” for some investors, prompting them to seek an alternative to stocks and bonds. Scotiabank hinted at this in a recent note, saying it expects gold holdings “to increase as investors look to diversify their portfolios in what seems likely to be a challenging year for investors.”

On Inauguration Day, gold rose a little under 1 percent to close at $1,210.

Whether you support the new president’s policies or not, it’s still prudent to maintain a 10 percent weighting in gold, with 5 percent in gold stocks, the other 5 percent in coins and bullion.

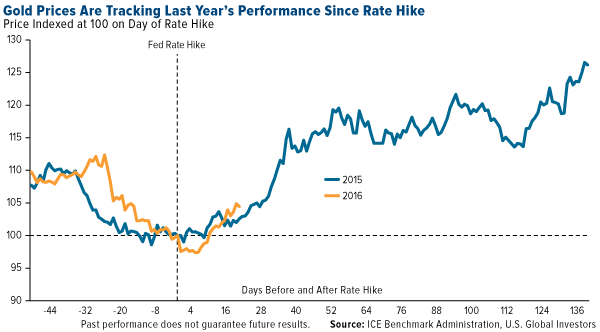
Another Gold Rally in the Works?

Look at the chart below. It’s indexed at 100 on the day the Federal Reserve raised rates in 2015 and 2016 (December 16 and 14, respectively). Although past performance doesn’t guarantee future results, gold prices so far this year appear to be tracking last year’s performance pretty closely, suggesting further upside potential. 

gold prices are tracking last year's performance since rate hike
click to enlarge

In the first half of 2016, gold rallied more than 31 percent, from a low of $1,046 in December 2015 to a high of $1,375 in July. With mid-December 2016 as our starting point, a similar 31 percent move this year would add close to $360 to the price of gold, taking it to above $1,520 an ounce.

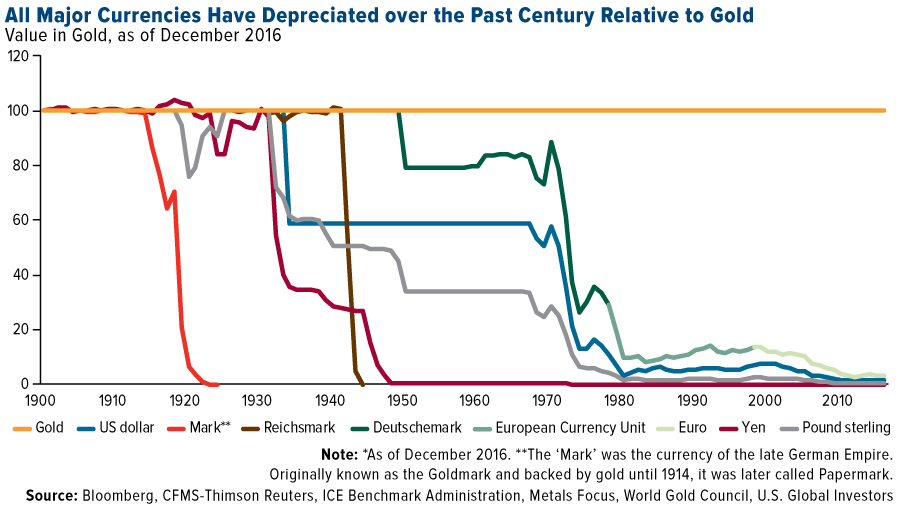
Gold Has a 100-Year History of Outperforming All Major Currencies

In its 2017 outlook, the influential World Gold Council (WGC) listed six major trends that will likely support gold demand throughout the year, including heightened geopolitical risks (Brexit, Trump, the global rise of populism), a potential stock market correction, rising inflation expectations and long-term Asian growth.

The group also calls out currency depreciation. Over the past 100 years, gold has strongly outperformed all major currencies. Whereas global gold supply grows at an annual average of only 2 percent, there’s no limit to how much fiat money can be printed.   

all major currencies have depreciated over the past century relative to gold
click to enlarge

Inflation and currency depreciation are among the Fear Trade’s triggers that I often write and speak about.

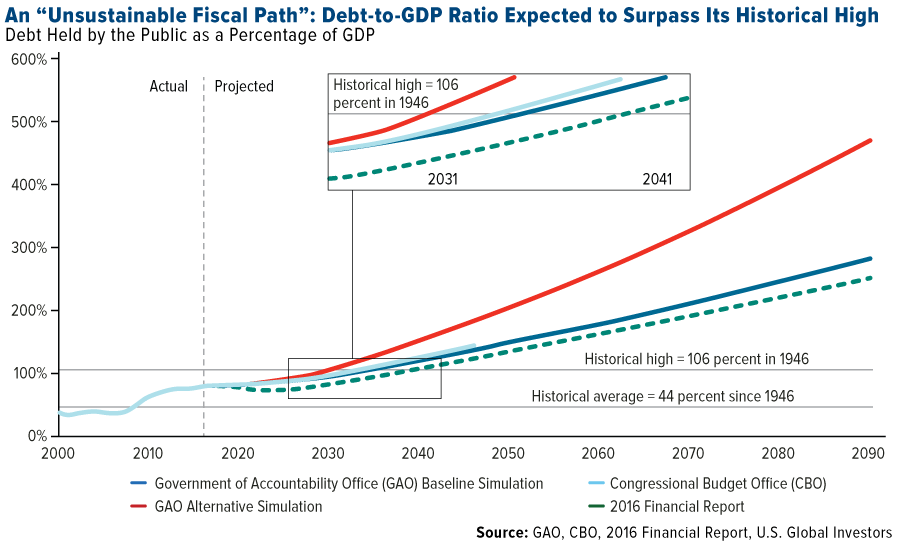
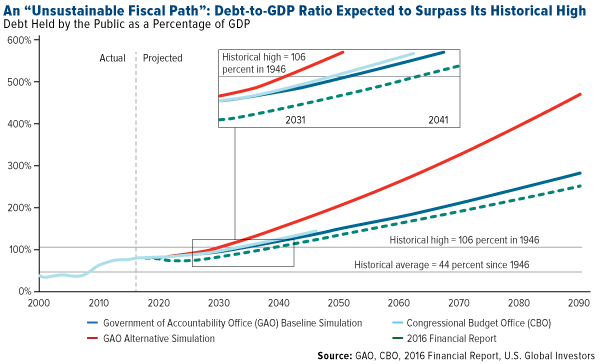
Spending Watchdog: U.S. Is on an “Unsustainable Fiscal Path”

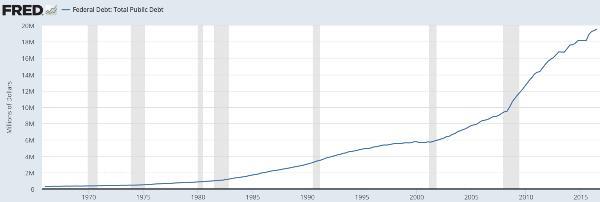
This point about currency depreciation is especially relevant in light of an alarming new report from the U.S. Government Accountability Office (GAO), the nation’s watchdog. According to the report, the federal government’s spending is “unsustainable,” and if no action is taken to rectify the problem, the debt-to-GDP ratio will soon exceed its historical high of 106 percent, set in 1946.

To be clear, that means our nation’s debt will be larger than its economy.

an unsustainable fiscal path debt-to-gdp ratio expected to surpass its historical high
click to enlarge

The federal deficit increased to $587 billion in 2016, after six years of declining deficits. Spending increases were driven by entitlement programs such as Medicare and Medicaid, which surged 4.9 percent and 5.3 percent, respectively, during the year.

Whether Trump can change any of this, we’ll just have to wait and see. He seems interested in lowering costs and bringing some fiscal sanity to the government, as demonstrated by his criticism of Boeing over the perceived cost of Air Force One. At the same time, massive tax cuts, coupled with a $1 trillion infrastructure package, will likely drive up deficit spending even more.

All the more reason to have a portion of your portfolio invested in gold and gold stocks.

In the meantime, I wish President Trump all the best!

All opinions expressed and data provided are subject to change without notice. Some of these opinions may not be appropriate to every investor. By clicking the link(s) above, you will be directed to a third-party website(s). U.S. Global Investors does not endorse all information supplied by this/these website(s) and is not responsible for its/their content.

The Consumer Price Index (CPI) is one of the most widely recognized price measures for tracking the price of a market basket of goods and services purchased by individuals.  The weights of components are based on consumer spending patterns.

Holdings may change daily. Holdings are reported as of the most recent quarter-end. The following securities mentioned in the article were held by one or more accounts managed by U.S. Global Investors as of 12/31/2016: The Boeing Co.