Wealth Building Strategies

Investing legend Jim Rogers says dump stocks if Trump launches trade war

MW-FE146 Trump  20170120122344 MGExpects dollar to continue to shine

A veteran investor, who has witnessed several crises over the past half-century, is worried.

“There is a lot of optimism,” said Jim Rogers, chairman of Rogers Holdings. “People are focusing on the good stuff when it comes to [Donald] Trump,” he said. 

But there is no telling what Trump will do once in office and that unknown bothers Rodgers the most.

“He very much wants a trade war. And if that happens, sell everything,” Rogers told MarketWatch. 

By everything, he means U.S. stocks, which rode Trump’s coattails to record levels following his November victory on euphoria over Trump’s promises to cut taxes, eliminate regulations and boost infrastructure spending.

….continue reading HERE

…related from Michael Campbell:

Donald’s Impact On Canada


Divergence Between Oil and Oil Stocks Signals Decline in Oil-Related ETF’s

Technical analyst Jack Chan reports the energy sector cycle is down and a multiweek correction is in progress, and discusses what that means.

Chan5-16-16-1

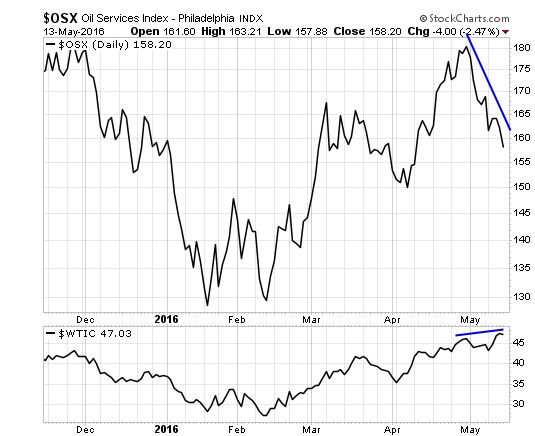
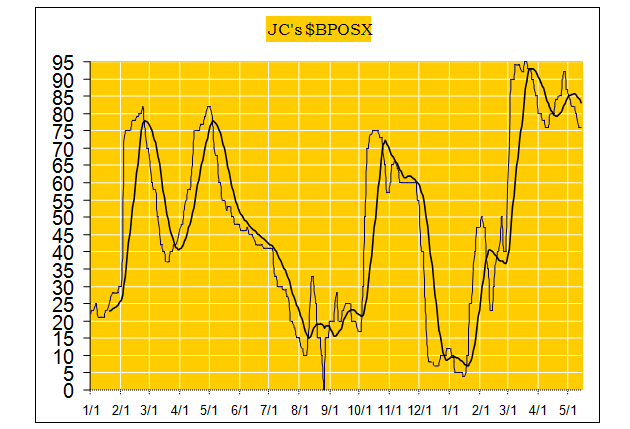
Our proprietary energy cycle indicator turned down last week from the divergence as noted previously

OSX Oil Services Index

We have a serious divergence this week between oil and oil stocks. Such divergences have almost always led to a substantial decline in prices in oil-related ETFs. 
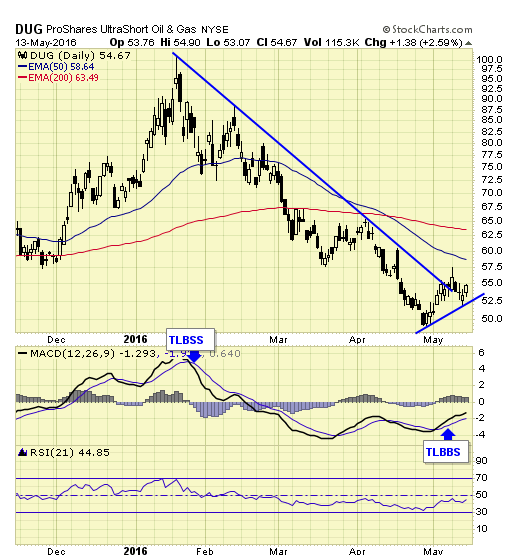
DUG ProShares UltraShort Oil & Gas

It so happens that we have a new buy signal and set up on the inverse ETF this week. 

Summary
The energy sector cycle is down and a multiweek correction is in progress. Traders can consider shorting the sector via an inverse ETF, and manage their risk by using stops. 

Related Articles


Jack Chan is the editor of Simply Profits at www.simplyprofits.org, established in 2006. Chan bought his first mining stock, Hoko Exploration, in 1979, and has been active in the markets for the past 37 years. Technical analysis has helped him filter out the noise and focus on the when, and leave the why to the fundamental analysts. His proprietary trading models have enabled him to identify the NASDAQ top in 2000, the new gold bull market in 2001, the stock market top in 2007, and the U.S. dollar bottom in 2011.

Want to read more Energy Report interviews like this? Sign up for our free e-newsletter, and you’ll learn when new articles have been published. To see a list of recent interviews with industry analysts and commentators, visit our Streetwise Interviews page.

Disclosure:
1) Statement and opinions expressed are the opinions of Jack Chan and not of Streetwise Reports or its officers. Jack Chan is wholly responsible for the validity of the statements. Streetwise Reports was not involved in any aspect of the article preparation or editing so the author could speak independently about the sector. Jack Chan was not paid by Streetwise Reports LLC for this article. Streetwise Reports was not paid by the author to publish or syndicate this article.
2) This article does not constitute investment advice. Each reader is encouraged to consult with his or her individual financial professional and any action a reader takes as a result of information presented here is his or her own responsibility. By opening this page, each reader accepts and agrees to Streetwise Reports’ terms of use and full legal disclaimer. This article is not a solicitation for investment. Streetwise Reports does not render general or specific investment advice and the information on Streetwise Reports should not be considered a recommendation to buy or sell any security. Streetwise Reports does not endorse or recommend the business, products, services or securities of any company mentioned on Streetwise Reports.
3) From time to time, Streetwise Reports LLC and its directors, officers, employees or members of their families, as well as persons interviewed for articles and interviews on the site, may have a long or short position in securities mentioned. Directors, officers, employees or members of their families are prohibited from making purchases and/or sales of those securities in the open market or otherwise during the up-to-four-week interval from the time of the interview until after it publishes.

All charts courtesy of Jack Chan.


Great Rotation and Gold

The performance of gold in 2017 depends largely on whether the Trump’s presidency will lead to lasting shift in the markets. What changes do we mean? Some analysts mention the reflation, others point out the ‘risk on’ sentiment and the ‘great rotation’ out of bonds and into stocks. Ray Dalio, the founder and chairman of Bridgewater, claims that the Trump’s victory was a turning point ending the period characterized by increasing globalization, free trade, and global connectedness; relatively innocuous fiscal policies; sluggishGDP growth, low inflation, and falling bond yields. The new period is believed to be characterized more by decreasing globalization, free trade, and global connectedness; aggressively stimulative fiscal policies; increased economic growth, higher inflation, and rising bond yields.

Indeed, the U.S. Treasury yields, stock prices and inflation expectations have increased since the U.S. presidential election, which may really signal that we had already made the secular low in bond prices and inflation. We do not argue with that. The million-dollar question is whether these changes will be permanent, or, in other words, whether the expectations of Trump’s pro-growth policies are realistic.

You see, the whole reasoning is based on three premises. First, the new president will inaugurate a heavy schedule of fiscal spending. Second, this fiscal stimulus will significantly contribute to the economic growth and force the Fed to accelerate its tightening cycle to prevent the economy from overheating. Third, the tax cuts and boosted government spending will lead to higher inflation and, thus, higher long-term interest rates. Fourth, Trump will trigger a new ‘Reagan revolution’.

However, there are serious problems with these assumptions. First, Trump’s proposals would take a lot of time and political negotiation to be implemented and it would take even more time to influence the U.S. corporations’ profits. If they are introduced at all, because Republicans may actually not support higher fiscal deficits. Similarly, infrastructure projects have never been high on the Republican’s agenda. Actually, Trump did not say anything about more government spending. Instead, he proposed tax incentives for private companies to invest in infrastructure. Second, assuming that the U.S. economy is close to full employment (as the Fed argues), the increased government spending (if it happens and if it is funded by direct or indirect money printing) may only increase inflation instead of accelerating real economic growth (by the way, government projects are often ineffective). Third, it is not clear how the mere redistribution of funds from the private sector to the government or vice versa should increase inflation. However, assuming that it will, the widely expected higher inflation would increase nominal interest rates, but not real interest rates, which are crucial for the gold market. Fourth, the macroeconomic situation is now completely different than under Reagan when interest rates and inflation were much higher, while the public debt was relatively low. Therefore, Reagan had fiscal room to increase indebtedness and had a major tailwind in the form of potentially lower interest rates, in contrast to Trump who will face rising interest rates and an already high debt-to-GDP ratio, as one can see in the chart below.

Chart 1: The U.S. public debt-to-GDP ratio (green line, left axis, in %) and the 10-year Treasury yield (red line, right axis, in %) from 1980 to 2016.

1-public-debt-to-gdp-interest-rates

Hence, it would be mad to expect that Reagan-like policies will lead to similar effects in a completely different macroeconomic environment. Actually, investors should be careful what they wish for, since after the Reagan victory the stock market initially reacted positively, but then had a reality check in 1981.

The bottom line is that the prospects of gold in 2017 depend partially on broader market trends, asset reallocation, and investor sentiment. The stock market rally after Trump’s victory led to the belief that we are entering into period of higher economic growth, real interest rates, and great rotation from bonds to stocks, which would be negative for the shiny metal. Although there might be some reflation, and asset reallocation might be justified, the current market excitement could simply be difficult to sustain, given the high stock market valuation, many unknowns about the Trump’s policies, and different economic conditions than in the 1980s. As Benjamin Graham once said, in the short run, markets are a voting machine, but in the long run, they are a weighing machine, which implies that any longer-term trends must be supported by actual developments rather than mere expectations. Therefore, the outlook for gold in 2017 is not as bad as some analysts believe. To be clear, we do not call for a bull market in gold, but simply point out that investors may overestimate the potential for reflation under the Trump’s presidency and the bearish perspective for gold.

We invite you to sign up for our gold newsletter and stay up-to-date with our latest free articles. It’s free and you can unsubscribe anytime.

Arkadiusz Sieron

Volatility Insights: What Can You Learn From The Big Short Interest In The VIX Futures?

Summary

– VIX shorts are currently near a 5-year high.

– Spot VIX has been realizing low volatility.

– There is a better relationship between the net positioning and the market.

I have been a regular contributor on SA when it comes to the topic of volatility. Naturally, I receive a number of questions being posed to me in regards to various topics. However, as of late, I have been getting questions about the heavy short interest in the VIX futures and whether this means anything. Of course, the question can be posed more bluntly. Does the heavy short interest in the VIX futures mean that we are about to see a bout of increased volatility in the near future?

Now I have my opinions and thoughts. However, I also let the data educate me. In this case, I will walk through the historical data on the VIX futures with you and perhaps we can answer some questions, and perhaps we can get some more interesting questions coming out of this exercise.

Now let’s look at where the VIX shorts currently stand:

526047-14848357958554265 origin

….for more and larger charts go HERE


Major Markets at Turning Points

Bonds have risen in a 35 year bull market. That bull market looks tired and probably peaked in July of 2016.

The U.S. Dollar Index recently hit 14 year highs. Has the dollar finally peaked? Has it turned downward since January 3, 2017?

Stocks have been rising since the 2009 crash lows. Rounded to the nearest point, the Dow hit 20,000. Was that enough to make a final top before a major turn downward?

Gold made an important low over a year ago but we continually hear chatter about gold falling below $1,000, perhaps to $700 or even $350. I believe it has turned upward and the chatter will dissipate.

Let’s speculate about turning points in these important markets.

T-Bonds:

The global bond market is perhaps $100 trillion. Derivatives tied to interest rates are perhaps another $500 trillion. Yes, these are big numbers and interest rates affect practically everything – student loan debt, consumer spending, sovereign nation borrowing, housing sales, mortgage rates, credit card rates, bank profitability, availability of credit and more.

The global bond market is the largest financial bubble in history. A crash would be important …

Examine this chart of the U.S. T-bond.

F-Bonds-768x538

….for larger charts and analysis of all Major Markets go HERE

…related:

Marc Faber: Take a Gamble on Trump