
Energy & Commodities
Here’s one of the most important charts we might see in oil and gas this year. New this week from industry watchdog Wood Mackenzie — showing how many offshore petroleum projects will likely see final investment decisions (FIDs) during 2017.
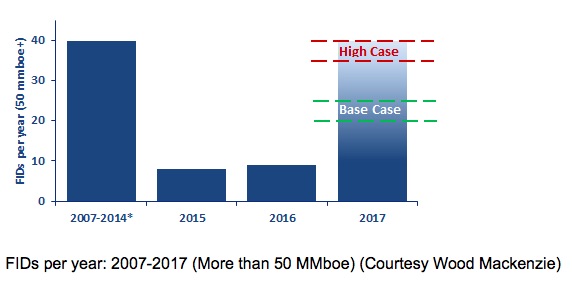
Wood Mackenzie sees a major surge coming this year in investment decisions on offshore oil and gas projects
There are a few important things to note here. First, approvals of new petroleum projects were running strong between 2007 and 2014 — with the blue bar on the left showing how FIDs during this period averaged 40 projects per year.
Move to the 2015 however, and approvals for new project construction fell off a cliff. With only 8 projects getting off the ground that year.
The past year wasn’t much better — with only 9 projects reaching FIDs during 2016.
That drop-off was triggered by falling crude prices globally. But here’s the good news — even with oil still languishing at $50 per barrel, Wood Mackenzie thinks the coming year will be very good for new projects.
These experts see at least 20 offshore projects reaching a final investment decision this year. With FIDs potentially reaching as high as 40 projects — returning to pre-oil crash levels.
Why are so many projects making a comeback even at lower oil prices? Two words: lower costs.
Wood Mackenzie points out that capital costs for offshore projects have fallen 20% since 2014. A fact they say will raise internal rates of return on new projects to an average 16% this year, well above the 9% average IRR for projects launched three years ago.
All of which shows lower commodities prices are manageable, for the right projects. The consultants say the biggest winners will be smaller projects that benefit most from cost reductions — watch for announcements on project go-aheads for small to mid-sized fields (and likely a few bigger ones) as the year goes on.
Here’s to finally investing,

Dave Forest
dforest@piercepoints.com
…also from Larry Edelson: Gold’s fate as Western society cracks apart …

For of all sad words of tongue or pen, the saddest are these: ”It might have been!”
John Greenleaf Whittier
For a long time, our theme was to view all sharp pullbacks through a bullish lens as the trend based on our trend indicator was trading firmly in bullish territory. Secondly, onecritical psychological component was in our favour too- the masses were either bearish or they cursed this market from the sidelines (neutral camp); hence the slogan the most hated bull market in history. We must deter for a second by stating that a mild or brutal correction comes down to what level you embraced this market. If you embraced this Stock Market Bull in the early stages from 2009 -2011, then a mild correction would seembrutal or back breaking in comparison to someone who just jumped into the market. A 15-20% correction would knock the socks out of them, but for you, it would appear to be nothing but a blip; this is why we have consistently stated that the best time to open long positions when the masses are in a state of despair.
Having said that what does the future hold?
Towards the end of last year around Dec, we stated that we were getting a tad bit nervous as the crowd had started to embrace this bull market. Up until the Trump win, which we saw as a bullish event for the markets, while most experts viewed it as a death omen, the masses were either bearish or sitting on the sidelines. Bullish sentiment was generally below 40%, and the combined score of the individuals in the bearish and neutral camp was almost always above 55% and in most cases above 65%. After Trump had won the markets experienced an initial shock but recouped twice as fast as they did with Brexit and never looked back since. During this monstrous rally, the sentiment gradually started to improve, and for the past 11 weeks, the percentage of individuals in the bullish camp hasalways been above the 40% mark. On three occasions in the past 11 weeks, the bullish sentiment soared above the 50% mark something we had not experienced even once over the past 30 months. As we pay close attention to the masses, this had to be treated as a significant development.
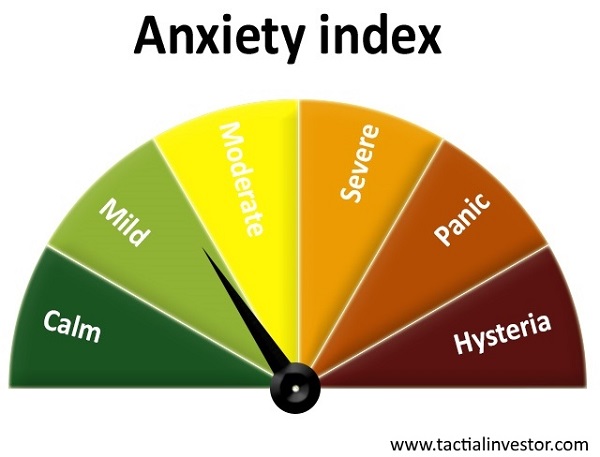
The anxiety index for the past 24 months has oscillated between the severe and hysteria zones. At the moment the gauge is sitting in the mild zone. When we combine this with the fact that more individuals are embracing this market, it suggests that being cautious might for the 1st time in many months be the most prudent form of action. Additionally, the markets are extremely overbought and are begging for any excuse to let out some steam.

The Dow has experienced a new vertical takeoff after the results of the election results were announced; -fast, furious breaks outs are usually followed with substantial pullbacks. As can be seen in the above charts the technical indicators are trading in the extremely overbought ranges and given the massive change in sentiment over the past two months caution is warranted. The risk to reward ratio is not in favour of the average investor anymore. The market needs to let out some steam; a 10% pullback would be quite nice and would pull it back to the point of the current break out-former resistance turned into support. This would be enough to scare the living daylights out of the masses. In this case, we would favour an even stronger correction, perhaps a test of the 200-daymoving average which would put the fear of God in almost 90% of investors and thus creating a splendid buying opportunity for the astute investor. Our goal is not to focus on ideal targets but the mass sentiment, and that is why we have developed a host of tools to monitor the masses one of which we have posted above. If the Dow drops down to 18,000 ranges, but the masses are not fearful, then we would not view the situation as a buying opportunity.
A weekly close below 19,600 will signal that of the 18,200-18,600 ranges is likely. If the markets close below 18,200 on a weekly basis, it is possible they could trend much lower, but we do not want to look that far into the future and will address that hurdle when and if the Dow touches that zone.
Buy the rumour and sell the news factor
The masses panicked when they found out that Trump had won. The fake news media sites started huffing and puffing about the dire consequences the markets would face if Trump won. Several weeks earlier we went on a limb and in an article titled “Mass Psychology states Trump win Equals stock market buying opportunity” we made the following comments.
A Trump win will create uncertainty, and the lemmings will flee for the exits; markets will pull back sharply and viola the same old cycle will come into play. The cycle of selling based on fear which equates to opportunity for those who refuse to allow their emotions to do the talking. Full Story
We repeatedly advised our subscribers to view a Trump win through a positive lens. However, now we feel that the markets have priced in the all the positive factors associated with a Trump win (at least in the short term time frames) and some bloodletting is in order. In other words, it might be time to put the principle of “buy the rumour and sell the news” into use.
Conclusion
When you think about it, everything comes down to perception. Alter the angle of the observation slightly, and you modify the perception. What appears bullish to one could be viewed as an extremely bearish development by another. When it comes to investing the goal should be to determine what view the masses hold whether it is valid or not is irrelevant for the difference between a truth and deception comes down to perception also. If the masses are leaning strongly towards a particular outlook, history indicates that taking a contrary position usually pays off.
The masses have for the first time embraced this bull market. From a mass psychology perspective, this is alone is not a huge negative. Mass Psychology dictates that the masses need to turn euphoric before one abandons the ship. It is not the time to abandon ship, but it is time to take a breather and let the storm clouds pass.
The Dow industrials exploded upwards and have experienced a near vertical move over the past two months. Under such conditions, one should not be shocked if the markets let out a stronger dose of steam than they have over the past 24 months.
One man’s remorse is another man’s reminiscence.
Ogden Nash
….related: Stock Markets: Short Sharp Pullback


Summary
- Latest Eurozone data indicate a substantial jump in inflation in Germany in December , eliciting calls that ECB president Mario Draghi, end his ultra-loose policy and raise the policy rate.
- The reality is that with energy costs rising quickly, the strong disinflationary pulse that the globe had seen in 2015-2016 has been neutralized. The deflation meme is dead.
- The overwhelming impact of rate differentials still favor the USD, but there comes a time when significantly higher inflation rates in the US vs. Row starts to hurt the currency.
- The universal outlook of higher crude oil prices in the medium term has the potential effect of limiting future USD gains, if not weakening it outright against the euro.
- Our short-term outlook is for the US Dollar to strengthen until mid-February, after which the US currency should weaken significantly against the euro and other major currencies.
…related from Jack Crooks:


The chart above shows the average detached housing prices for Vancouver*, Calgary, Edmonton, Toronto*, Ottawa* and Montréal* (the six Canadian cities with over a million people each) as well as the average of the sum of Vancouver, Calgary and Toronto condo (apartment) prices on the left axis. On the right axis is the seasonally adjusted annualized rate (SAAR) of MLS® Residential Sales across Canada (one month lag).
….for larger chart and analysis go HERE
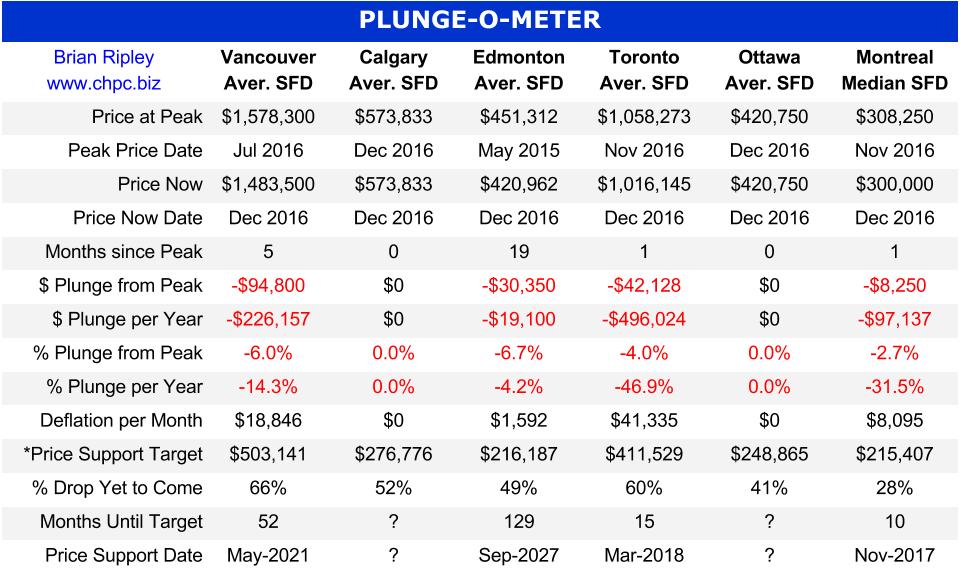
The Canadian Real Estate PLUNGE-O-METER
The Plunge-O-Meter tracks the dollar and percentage losses from the peak and projects when prices might find support. On the price chart in the spring of 2005 there was a 4-6 month plateau period while buyers and sellers twitched like a herd. When the credit spreads narrowed and the yield curve began its journey towards inversion, the commodity stampede began.
*The Price Support target represents prices at March 2005; the start of a 40 month period of ardent speculation in all commodities; then a full blown crash into the pit of gloom (March 2009); and then another 39 month rocket ship to the moon but then the crowd suddenly thinned out in April 2012. The revival of spirits erupted in 2013 as global money went short cash and long real estate on an inflation bet. Now we have a major sense of doubt about value in Vancouver and Toronto as sales and prices chill out as we move into 1Q 2017.
…for CDN Housing Priced in US Dollar go HERE
 – The Italians voted No in what is potentially a monumental referendum
– The Austrian rejected the far right anti-EU candidate in the December presidential election
– Donald Trump won the US presidential race
– The UK voted to leave the European Union
My point – Armstrong Economics has the only computer model that predicted every one of these events.
And knowing Martin Armstrong and his work for over 33 years I can tell you it’s not a fluke. I have a son who’s been managing money in London and the one piece of advice I gave him was that he didn’t have to invest in everything Marty recommended, but I warned him he should never bet against him.
You may have heard Marty on the air with me October 22 when he predicted that Trump would be the next president. It didn’t seem likely at the time. It was two days after Time Magazine had Trump on the cover in a total meltdown – but then the FBI announced the renewed investigation into Hillary Clinton’s classified emails sent over her private server – and presto the race was on again. I’m not commenting on the election – I commenting on the accuracy of his model.
Flashback to the World Outlook Financial Conference in 2013 where Marty predicted that Russia would invade Ukraine in the immediate aftermath of the Olympics in late February, 2014. Again, the model was correct.
I could go on but allow me to share one more story. I’m not sure if you’ve seen the documentary about Marty called The Forecaster. I remember sitting watching it for the first time, and up comes a scene where the interviewer looks at a computer slide from our 1998 World Outlook Conference. The slide read:
1998 Collapse of Russia
1999 Low in oil and gold
2000 technology collapse (like railroads in 1907)
2002 Bottom US share market
2007 Real Estate Bubble – Oil hits $100
2009 Start of Sovereign Debt Crisis
2011 – 2015 Japan Economic Decline
Euro begins to crack due to debt crisis
2015.75 – Sovereign Debt Big Bang
I sat there dumbfounded and as soon as the movie was over I phoned Grant Longhurst, who produces the Outlook Conference, and asked him to go to the archives and get a copy of the slide. There it was…absolutely amazing.
I could go on chronicling Armstrong’s computer model’s incredible record of prediction including calling the massive drop in gold, the move to new highs in the stock market, the return to dominance of the US dollar and the relentless fall in the euro. The point is that when Marty’s model points to an important date I pay attention. As do money managers, government officials and investors from around the world.
His understanding of history, currency movements and the interaction of the widest range of variables on different investments is second to none. And you get to hear from Marty at the 2017 World Outlook Financial Conference not once – but twice!
The Coming Year
I have literally never been more interested in hearing what Marty has to say. Every major trend we’ve been predicting on MoneyTalks and at the World Outlook Financial Conference is in full force headlined by a decreasing level of confidence in government.
The probability of that trend reversing itself is extremely low. On the contrary, the anti-establishment trend is accelerating – but the question is how will stocks, bonds, gold, commodities, the loonie and other currencies react. I want to hear Marty’s take, which is just one of the reasons that I’m encouraging you to attend the World Outlook Financial Conference –CLICK HERE to order. Marty will join us from Princeton (or London or Tampa) – on Friday night for a special segment that specifically deals with the debt crisis, the dollar and gold.
Then on Saturday afternoon he will do another segment on where he sees stocks, interest rates and oil going. And you know I’ll have ask him where he sees the greatest money making opportunity and the biggest danger.
But That’s Not All
While I’m writing today about Martin Armstrong, the complete group of keynote speakers is equally impressive. Let’s start with two words – Jim Dines …the legend…enough said. I’m also looking forward to hearing James Thorne, Mark Leibovit , Don Vialoux, Ozzie Jurock and of course Ryan Irvine, who will present the 2017 World Outlook Conference Small Cap Portfolio (last year’s was up over 30%).
I hope to see you there on Friday, February 3rd and Saturday, February 4th, 2017. Our goal is make a huge difference to your financial well being and make 2017 your best year ever – and I have complete confidence that the Outlook Conference features the people to do it.
Sincerely
Mike
P.S. Getting the chance to hear Marty is one of the best reasons to bring a younger person to the conference. It will be an amazing eye opener that he or she won’t get at university or the mainstream media. Student tickets are FREE when you purchase your own general admission pass.
P.P.S. Can’t attend in person? Our four camera video crew produces HD videos of all the keynote speakers, panels and intros including their charts and presentations. We guarantee to have the videos uploaded for viewing online within 48 hours of the Conference and you have unlimited access for a minimum of 6 months. CLICK HERE to order the video subscription.


-
I know Mike is a very solid investor and respect his opinions very much. So if he says pay attention to this or that - I will.
~ Dale G.
-
I've started managing my own investments so view Michael's site as a one-stop shop from which to get information and perspectives.
~ Dave E.
-
Michael offers easy reading, honest, common sense information that anyone can use in a practical manner.
~ der_al.
-
A sane voice in a scrambled investment world.
~ Ed R.
Inside Edge Pro Contributors

Greg Weldon

Josef Schachter

Tyler Bollhorn

Ryan Irvine

Paul Beattie

Martin Straith

Patrick Ceresna

Mark Leibovit

James Thorne

Victor Adair