
Timing & trends
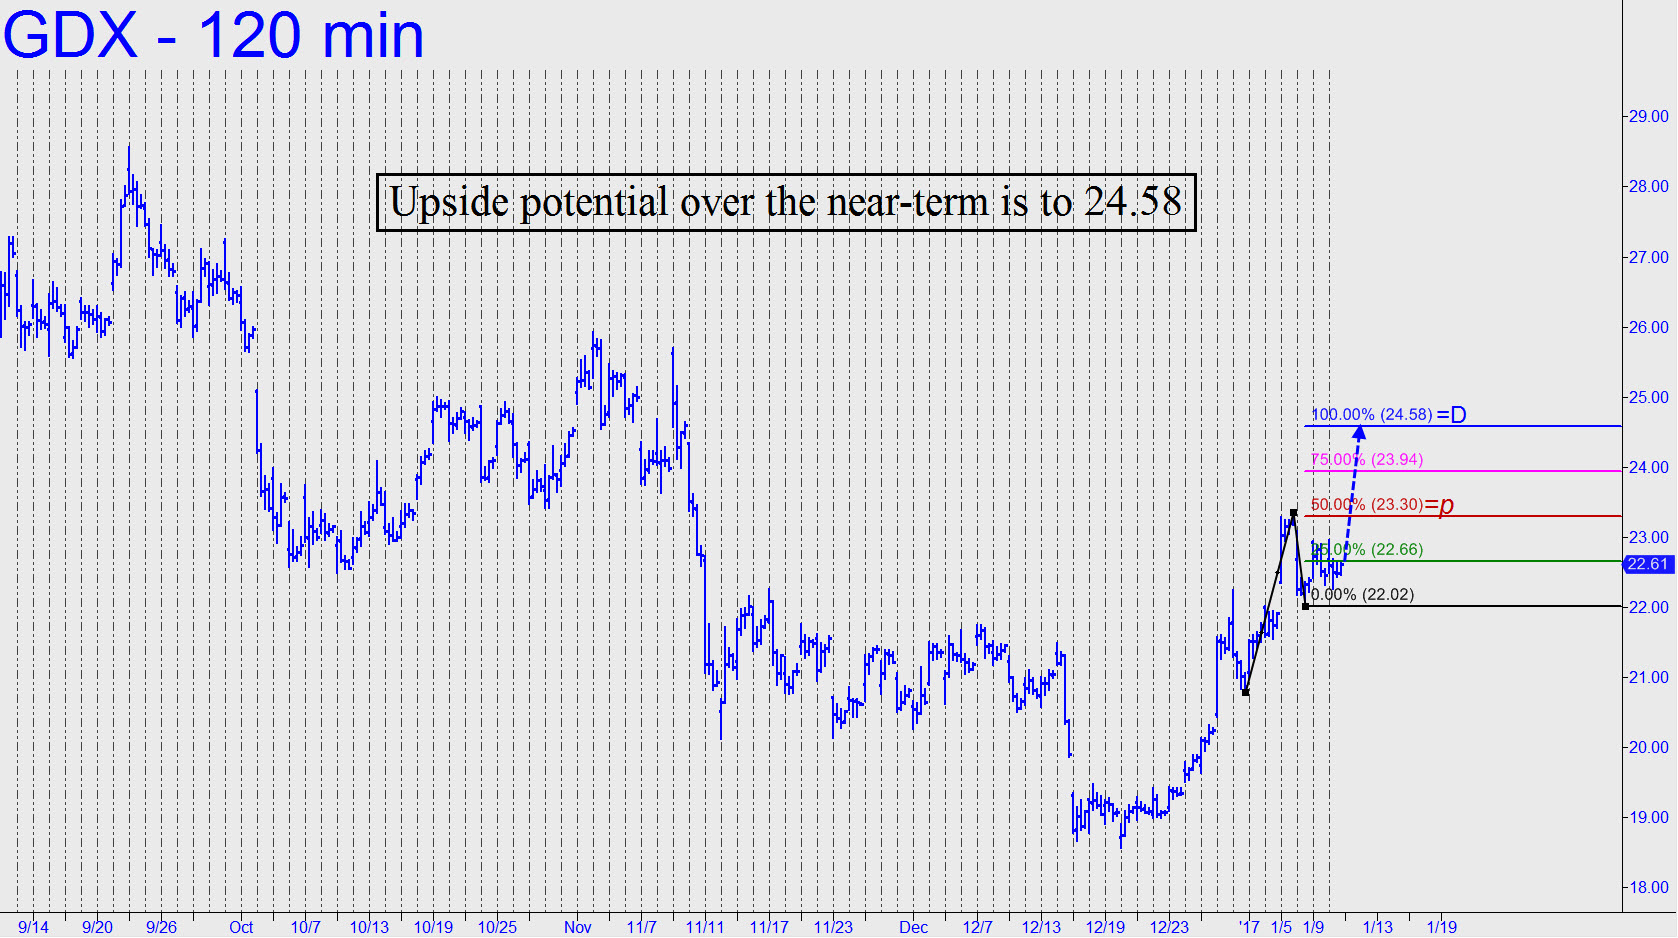
Subscribers are long 400 shares from 22.61, stop 22.01, based on a real-time guidance for a ‘mechanical’ entry that was posted to chat room Scoreboard at 11:21 a.m. GDX, an ETF proxy for the gold mining sector, is having trouble getting airborne, but if the buying should catch fire, it has the potential to reach 24.58 (see inset) over the near term. For now, I’d suggest entering an order to sell half the position at p=23.30, the pattern’s ‘midpoint Hidden Pivot’ resistance. The order should be held o-c-o with a 22.01 stop-loss on the whole position. You should also offer another 100 shares at 24.58 g-t-c. If the order fills, we’d be left with 25% of the original position — or 100 shares, based on the original order.
Click here for a no-risk, two-week trial subscription.
….related: More short term trading ideas from Victor Adair: Live From The Trading Desk: Long & Short Term Positions Now

 Jan 10th 8:45 PM
“Despite New Year bullishness from our early January indicators and our expectation for full-month January Barometer gains that will support our modestly bullish 2017 Forecast, a mid-January break in equities is looking increasingly likely. Since 1996 this January break has been more pronounced and more consistent. This trade, last featured in the Commodity Trader’s Almanac 2013, is beginning to set up nicely right now.
The stock market has demonstrated a tendency to retreat after the first of the New Year, especially when there has been a strong fourth quarter gain. Once the New Year begins we often see a profit taking correction. Investors tend to sell stocks to lock in profits in order to defer taxes from capital gains after the New Year begins. Even though the best time to be long the overall equity markets lasts from October through late April, this January break can certainly give short-term, nimble traders a nice return. With stocks struggling to move higher this week this trade is setting up a little later this year.
Also consider that since the New York Stock Exchange began observing the Martin Luther King, Jr. holiday on the third Monday in January in 1998 that the stock market has exhibited strength in the days before the market is closed on that third Monday and weakness after. This also coincides with the pattern of weakness during January’s expiration week. S&P 500 has been down 13 of the last 18 years during the week, while suffering some heavy losses on expiration Friday in 10 of the last 18 years.”
Mark Leibovit
….related: Buy C-R-A-P

“In my whole life, I have known no wise people (over a broad subject matter area) who didn’t read all the time — none,” Charlie Munger, the vice chairman at Berkshire Hathaway, once said.
With that in mind, we’ve highlighted 27 classic works that every Wall Streeter should read.
Many of these books show up time and again in lists of books recommended by the pros themselves.
Topics covered include everything from the most important principles of investing to inside stories of the worst financial crises in modern history.

 Despite a small decline yesterday, the U.S. Henry Hub natural gas benchmark rate is now up 36.7% for the month.
At close yesterday, the price was $3.61 per 1,000 cubic feet or million BTUs (British Thermal Units), the standard measurement in the U.S.
To put that in some perspective, the price was $1.96 as recently as May 26, and the year-to-date low was $1.65 on March 3. Meanwhile, the $3.65 level reached at close on Monday, December 5 was the highest in two years.
Traditionally, the price for natural gas in the U.S. has been heavily by the seasons, with the severity of winters generally being the main determinant of how high prices would go.
But that’s no longer the case…
With demand for natural gas coming from many new sources, the price is no longer tied to the weather – setting prices up to go higher.
Here’s exactly how high the price of natural gas will go in 2017…
Believe It or Not, People Used to Worry About a Lack of Gas
Almost a decade ago, prices jumped above $13 as the result of something else…
Back then, the concern was supply. There was not enough natural gas to meet expected demand, even without considering the newer end-uses for natural gas that we’ll talk about in a moment.
I remember siting in a 2005 meeting of market experts where everyone around the table agreed that at least 15% of natural gas consumed in the U.S. would have to be imported as liquefied natural gas (LNG) by 2020. At least 40% of the rest was expected to come from Canada via pipeline.
Well, along came shale and tight gas – and the picture was fundamentally changed. Today, significant reserves of this “unconventional” natural gas have fundamentally altered the domestic market mix.
This massive shift has led to two results. First, surplus supply inside the U.S. ballooned. Second, the price started coming down – and fast.
As the cost of drilling declined and the amount of extractable gas consistently exceeded estimates, serious discussion emerged about America becoming energy independent, a target likely to become reality even quicker when the prospects for a similar Canadian shale boom is taken into account.
But this rush into shale came with its own cost…
Natural Gas Drillers Became the Victims of Their Own Success
In addition to environmental concerns over the fracking necessary to bring the gas up, the sudden additions to the national surplus produced significant pressure on the sector itself. A rising number of operating companies were threatened by the sheer size of the changes underway.
A natural gas well, even one in a shale play, is much cheaper to drill than anything beyond a very shallow (2,000 foot) oil well. However, a shale well’s primary production comes in over the first 18 months, after which it quickly declines. So producers have a much bigger front loaded volume flow.
The combination of these two factors has run through smaller producers like a wild fire. Combined with the knock-on effect of a major move down in crude oil prices, a rising number of companies came under siege.
Producers needed to replace declining production rates with new wells that were justified as replacement but hardly by the market as such. The combined spike in surplus production just put additional downward pressure on the price of natural gas and further reduced the profitability at the well head (where companies get paid well below the final market price).
Now, companies will regularly hedge contracts forward to shield themselves from declining prices. But that approach only works if there are genuine prospects that prices will improve. Otherwise, the cost of hedging becomes untenable.
At the current price for natural gas, companies are once again getting access to money (through debt and issuing new stock) needed to subsidize forward operations. This used to be the norm, with most producers operating cash-poor – bringing in less from gas sales than current operations cost. The difference was covered by debt or selling new stock, with sale revenue used for acquisitions, dividends, or stock buy-backs.
Increasing field efficiency and new technology has further lowered costs. With natural gas trading north of $3.50, wells in basins such as the Marcellus are now profitable. But this is still a precarious balance…
My Natural Gas Price Forecast for 2017
All analysts understand that natural gas is in the early stages of major expansion in its usage.
The demand side is no longer dictated only by how cold winters get. While seasonal considerations are still important, we have discussed here in Oil and Energy Investor on several occasions that the future use of natural gas lies elsewhere.
The transition from coal to gas for electricity generation is already well underway. In addition, the export of LNG from the U.S. to higher-priced markets has begun, with the guarantee of adequate supply for the establishment of spot markets elsewhere likely to offset the higher cost of bringing U.S. LNG into competition.
Decisions to construct cracker plants outside Pittsburgh and on the Gulf Coast are the latest indicators of a rise in using natural gas value-added products to replace those made from oil in the production of petrochemicals.
Then there is the widening industrial use for gas and the transition from gasoline to LNG and compressed natural gas (CNG) for vehicle fuel – both in normal and hybrid engines. That exchange has been accelerating on the large-end truck side of the scale, along with metropolitan buses and taxis. The smaller car engine part of the spectrum will still take a bit longer.
As for the surplus, in the U.S. it currently stands at about 4 trillion cubic feet. While high, it’s been stable and is now only slightly above the five-year average. This should be enough to provide a floor supporting a slowly strengthening price.
On the other hand, all of this depends on operators being able to strike their own balance between immediate revenue needs and longer-term market trends. The supply is certainly there and the demand is increasing.
Yet an improving natural gas picture is now in the hands of the producing companies.
I estimate natural gas prices will test $4.50 before the current cycle flattens out. By that point, probably mid-2017, the demand for broader uses will determine the next price level.
….related: Calling Putin’s Bluff


-
I know Mike is a very solid investor and respect his opinions very much. So if he says pay attention to this or that - I will.
~ Dale G.
-
I've started managing my own investments so view Michael's site as a one-stop shop from which to get information and perspectives.
~ Dave E.
-
Michael offers easy reading, honest, common sense information that anyone can use in a practical manner.
~ der_al.
-
A sane voice in a scrambled investment world.
~ Ed R.
Inside Edge Pro Contributors

Greg Weldon

Josef Schachter

Tyler Bollhorn

Ryan Irvine

Paul Beattie

Martin Straith

Patrick Ceresna

Mark Leibovit

James Thorne

Victor Adair