
Economic Outlook
 To broaden the debate given the number of disagreements posted on Facebook since the article posted on this site January 4th titled “Peer-Reviewed Survey Finds Majority Of Scientists Skeptical Of Global Warming Crisis”, I am sending links to three articles below, 1 for, one against, and one fascinating youtube by a scientist that illustrates the amount of Carbon Dioxide in the atmosphere (.038%):
For: From NASA – Study sheds new insights into global warming trends (2016)
Factual information on Carbon Dioxide in the Atmosphere: Carbon Dioxide in perspective by The Galileo Movement
Robert Zurrer
Editor
Moneytalks.net
Late addition: As Donald Trump Denies Climate Change, These Kids Die of It

 1. Peer-Reviewed Survey Finds Majority Of Scientists Skeptical Of Global Warming Crisis
by Forbes Magazine
It is becoming clear that not only do many scientists dispute the asserted global warming crisis, but these skeptical scientists may indeed form a scientific consensus.
2. The War On Kids
by Michael Campbell
“In talking to a group of 19 – 20 year old students over the holiday I was reminded of the alternate ace in the hole for our status quo power groups is the collective ignorance of economics & finance”
3. 2017 is Looking More Optimistic Than Ever
by Martin Armstrong
The net capital movements around the world are showing clear signs that things will be intensifying and the net capital movement is headed for the dollar

I don’t think so. Here again, most analysts got the Shanghai Gold Exchange (SGE) completely wrong.
The SGE was established in October 2002 by China’s central bank, the People’s Bank of China (“PBOC”) upon approval by State Council and supervised by PBOC.
Officially and fully open for business in September 2014, I personally was the first foreigner to visit the SGE in October 2004 and spoke with the president. Construction was underway, communications, quote pits for the different products and more. It was an interesting visit, under armed guard.
But for the record, let me explain the myth that the SGE is going to boost gold demand and send it to the moon.
The chief reason for the SGE is to officially allow two
types of cross-border trade in gold in China:
To promote general trade and processing trade.
In a nutshell, that means the gold is not brought in to the SGE for investment …
But instead, for manufacturing or assembling purposes after which the finished goods are required to be exported.
On BullionStar.com, columnist Koos Jansen reveals the byzantine details of the Chinese gold trade:
Usually processing trade is conducted through Customs Specially Supervised Areas (CSSAs) – also called Free Trade Zones, Customs Specially Regulated Areas, Special Customs Supervision Areas or Customs Special Supervision Regions, these are all the same.
When processing trade is performed outside CSSAs (the rest of the mainland, non-CSSA) the materials will be strictly monitored by Chinese customs. Through processing trade gold cannot enter the Chinese domestic gold market where the SGE operates. Processing trade and CSSAs are strictly separated from the Chinese domestic gold market.
Processing trade is meant for China’s manufacturing industry to efficiently connect with the rest of the world. The Chinese and foreign companies engaging in processing trade are exempt from, in example, import duties and Value-Added Tax (VAT).
General Gold in China Trade
When gold is imported into the Chinese domestic market, this is referred to as general trade. The agency that controls all forms of gold in general trade is China’s central bank, the People’s Bank of China (PBOC).
Only financial institutions and gold enterprises that carry the Import and Export License of the People’s Bank of China for Gold and Gold Products (the License hereafter) can get gold to pass customs into the Chinese domestic gold market.
The rules for cross-border gold trade in general trade have been lastly drafted by the PBOC in March 2015 and are called Measures for the Import and Export of Gold and Gold Products (the Measures hereafter). In the Measures it’s stated:
For the import and export customs clearance of gold and gold products as included in the Catalogue for the Regulation of the Import and Export of Gold and Gold Products, the Import and Export License of the People’s Bank of China for Gold and Gold Products issued by the People’s Bank of China or a People’s Bank of China branch shall be submitted to the Customs.
The Catalogue for the Regulation of the Import and Export of Gold and Gold Products describes all forms of gold (coins, ore, bullion, unwrought, scraps, jewelry) that can cross the Chinese border. For all gold to be imported into the Chinese domestic gold market the material is required to be accompanied by the License.
Currently there are 15 commercial banks that are approved by the PBOC to apply for the License to import standard gold, which in China is bullion in bars or ingots of 50g, 100g, 1Kg, 3Kg or 12.5Kg, having a fineness of 9999, 9995, 999 or 995. The 15 commercial banks are:
Agricultural Bank of China
ANZ
Bank of China
Bank of Communications
Shenzhen Development Bank/Ping An Bank
Bank of Shanghai
China Construction Bank
China Merchants Bank
China Minsheng Bank
Everbright
HSBC
Industrial and Commercial Bank of China
Industrial Bank
Standard Chartered
Shanghai Pudong Development Bank
All standard gold imported through general trade into the Chinese domestic gold market is required to be sold first through the SGE (the core of the Chinese domestic gold market). In the Measures, it’s stated:
… An applicant for the import and export of gold … shall have corporate status, … it is a financial institution member or a market maker on a gold exchange [SGE] approved by the State Council.
… The main market players with the qualifications for the import and export of gold shall assume the liability of balancing the supply and demand of material objects on the domestic gold market. Gold to be imported … shall be registered at a spot gold exchange [SGE] approved by the State Council where the first trade shall be completed.
Next to standard gold there are non-standard gold (for example bullion bars weighing 200g 9999 fine and doré bars), gold products (jewelry, coins and ornaments) and ore.
Non-standard gold, gold products and ore are not required (and not allowed) to be sold through the SGE when imported into the Chinese domestic gold market. Only a limited number of gold enterprises can apply for the License to import non-standard gold, gold products and ore under general trade. Although, the Measures released in March 2015 by the PBOC loosened the requirements for such enterprises.
An example of a gold enterprise that can import non-standard gold into the Chinese domestic gold market: On May 26, 2015, Zijin Mining Group bought a 50% stake in Barrick Gold Corp’s Porgera mine in Papua New Guinea for $298 million.
On October 9, 2015, China Gold Network wrote that Zijin Mining was one of the first mining companies to be granted the qualification by the PBOC to import gold under general trade, allowing Zijin to import doré from Papua New Guinea into the Chinese domestic gold market.
Either way, you can clearly see this is all about regulation, not boosting demand. And indeed, demand through the SGE has declined, pretty much year-over-year, per this table, courtesy of BullionStar.com
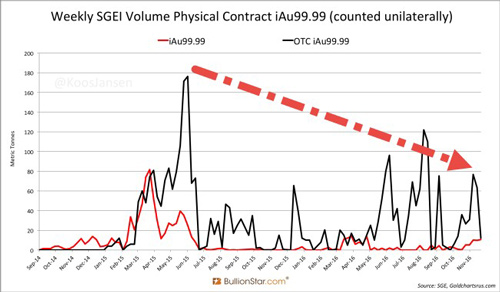
You can see the surge in trading in mid-2015, but from there on out, it’s pretty much a downtrend.
The SGE will NOT boost gold demand, at least not enough to turn a bear into a bull. And neither will the new Sharia law on gold you’re hearing about.
The only three things that will turn gold around to the upside are …
1. A crash in the dollar. Highly unlikely, though a short-term pullback is in order.
2. A collapse in global stock markets. Unlikely.
3. A new black market in gold, which is forming.
Best wishes,
Larry
P.S. Make sure to click here to download my new free report Stock Market Tsunami!
I was planning to write an article today about the shape of the yield curve. Since the Global Financial Crisis, the Treasury curve has been very steep – in early 2010 the 2y/10y spread reached almost 300bps, which is not only unprecedented in absolute terms but especially in relative terms: a 300bp spread when 2-year yields are below 1% is much more significant than a 300bp spread when 2-year yields are at 10%.

But what I had planned to write about was the phenomenon – well-known when I was a cub interest-rate strategist – that the yield curve steepens in rallies and flattens in selloffs. The chart below shows this tendency. The 5-year yield is on the left axis and inverted high-to-low. The 2y/10y spread is on the right axis. Note that there is substantial co-movement for the recession of the early 1990s, throughout the ensuing expansion (albeit with a general drift to lower yields), in the recession of the early 2000s, the ensuing expansion, and the lead-up to the GFC.

I was ready to point out that the steepening and flattening trends tend to be steady, and I was going to illustrate that they feed on themselves partly for this technical reason: that when the curve is steep, steepening trades (selling 10-year notes and buying duration-weighted 2-year notes, financing both in repo) tend to be positive carry and therefore easier to maintain, while on the other hand when the curve is flat the opposite tends to be true. So the actual causality of the relationship between steepening and rallies is more complex than it seems at first blush.
It would have made a very good article, but then I noticed that since 2010 or so the tendency has in fact reversed!
Specifically, from 1987-1995 the correlation of the level of the 5-year spread to the level of the 2s/10s spread was -0.78. From 1995-1999, the correlation flipped to +0.48 (but I didn’t bother to de-trend the data and I suspect that correlation stems more from the strong, 350bp decline in interest rates from 1995-1999). From 1999-2009, the correlation was -0.81. Since 2010, the correlation is +0.60: the curve has tended to flatten in rallies and steepen in selloffs. And, in the recent bond market selloff, the curve steepened as long rates rose further than short rates.
This is interesting. Clearly, carry dynamics cannot explain why the relationship is inverted. I think the answer, though, is this: since 2010, the overnight has been anchored. That isn’t different than in the past – from late 1992 to early 1994, the Fed funds target was anchored at 3%. But the difference is that back then, traders acted as if the Fed might eventually move the overnight rate in a meaningful way. Since 2010, investors and traders have attributed no credibility to the Fed, with virtually no chance of a substantial move over a short period of time. Accordingly, while short interest rates historically have tended to be the tail wagging the dog, while longer-term interest rates move around less as investors assume the Fed will remain ahead of the curve and keep longer-term inflation and interest rates in a reasonable range…in the current case, short term rates don’t move while longer-term rates reflect the market belief that rates will eventually reach an equilibrium but over a much longer period than 2 years as the Federal Reserve is dragged kicking and screaming.
I happen to agree, but it isn’t a great sign. I suppose it was destined, in a way – “open mouth” operations can only work in the long run if the Fed is credible, and the Fed can only be credible in the long run if it delivers on its promises. But it hasn’t. This is probably because the Fed’s forecast have been worse than abysmal, meaning its promises were based on bad forecasts. In such a case, changing one’s mind when the data changes is the right thing to do. But even more important, if your forecasts are frequently wrong, is to shut up and stop trying to move markets where you want them with “open mouth” operations. I have said it for 20 years: the worst thing Greenspan ever did was to make “transparency” a goal of the Fed. They’re just not good enough at what they do to make their activities transparent…at least, if they want to maintain credibility.
Administrative Note: On Monday I will be conducting the third and final in a series of webinars on inflation and inflation investing. This series will be done on the Shindig platform, sponsored by Enduring Investments, in cooperation with Investing.com. This webinar is on “Inflation-Aware Investing.” You can sign up directly with Shindig here, or find the webinar link at Investing.com.
P.S. Don’t forget to buy my book! What’s Wrong with Money: The Biggest Bubble of All. Thanks!
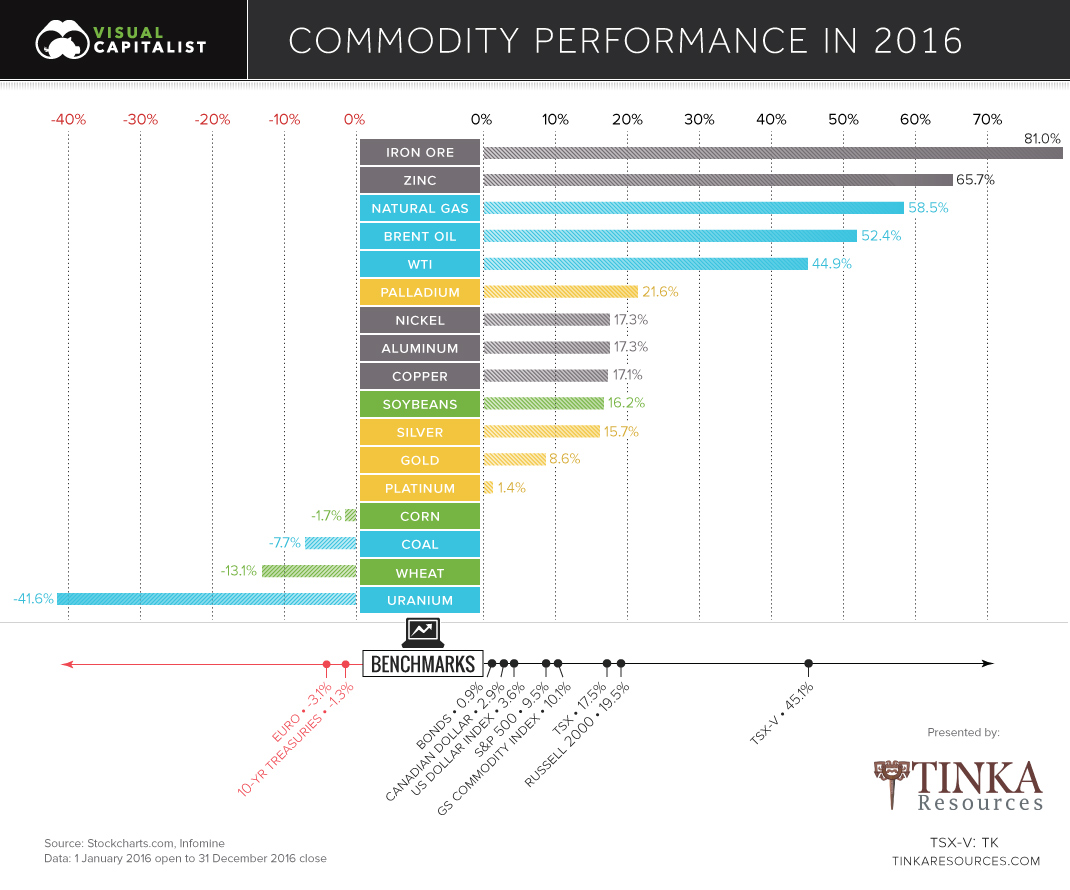
2016 Commodity Performance
It was an up and down year for commodities, but things ultimately finished in the black.
The S&P Goldman Sachs Commodity Index (GSCI) climbed 10.1% on the year – it was just enough to edge out the S&P 500, which ended 2016 with a 9.5% return.
Winners in 2016
The biggest winners on the year were base metals and the oil and gas sector.
Here’s how base metals did:
| Base Metal | Q1 | Q2 | Q3 | Q4 | 2016 |
|---|---|---|---|---|---|
| Iron Ore | 37.0% | -6.2% | 6.3% | 31.1% | 81.0% |
| Zinc | 20.0% | 13.1% | -3.2% | 26.1% | 65.7% |
| Nickel | -3.1% | 13.9% | 11.9% | -5.0% | 17.3% |
| Aluminum | 3.8% | 7.2% | 1.4% | 4.0% | 17.3% |
| Copper | 0.1% | 3.9% | -0.5% | 13.1% | 17.1% |
Iron ore and zinc were the best performing commodities on the face of the planet in 2016. Iron finished up 81%, its first calendar gain in four years. Meanwhile, zinc shot up 65.7% on the year as major zinc mines shut down, and supply stockpiles dwindled.
Oil and gas also posted a major comeback in 2016:
| Energy | Q1 | Q2 | Q3 | Q4 | 2016 |
|---|---|---|---|---|---|
| Natural gas | -17.0% | 53.3% | -2.7% | 28.0% | 58.5% |
| Oil (Brent) | 0.6% | 35.1% | -1.2% | 13.6% | 52.4% |
| Oil (WTI) | -3.2% | 37.3% | -2.1% | 11.4% | 44.9% |
It was a volatile year overall, but it appears that the worst of the downturn in energy prices is over.
Losers in 2016
Not all energy-related commodities could be so lucky.
Uranium continued its epic nosedive, losing -41.6% on the year. U3O8 now trades for $20.25/lb, a tiny fraction of its previous highs of over $100/lb in 2007.
| Energy Losers | Q1 | Q2 | Q3 | Q4 | 2016 |
|---|---|---|---|---|---|
| Uranium | -16.0% | -7.4% | -12.0% | -14.7% | -41.6% |
| Coal | 0.5% | -9.3% | 1.3% | 0.0% | -7.7% |
Coal has also performed abysmally, at least in North America where CAPP prices finished down on the year -7.7%. We previously showed the decline of coal in three charts, and it seems that coal will likely continue to be an unpopular choice for utility companies in the U.S. and Canada.
That said, it is worth mentioning that Australian coal prices went bonkers earlier this year due to a Chinese administrative oversight.


-
I know Mike is a very solid investor and respect his opinions very much. So if he says pay attention to this or that - I will.
~ Dale G.
-
I've started managing my own investments so view Michael's site as a one-stop shop from which to get information and perspectives.
~ Dave E.
-
Michael offers easy reading, honest, common sense information that anyone can use in a practical manner.
~ der_al.
-
A sane voice in a scrambled investment world.
~ Ed R.
Inside Edge Pro Contributors

Greg Weldon

Josef Schachter

Tyler Bollhorn

Ryan Irvine

Paul Beattie

Martin Straith

Patrick Ceresna

Mark Leibovit

James Thorne

Victor Adair