
Gold & Precious Metals
Gold, Silver, & T-Bond Charts & Analysis
SF Trader Time Key Charts & Analysis
SF Juniors Key Charts & Analysis
For today’s videos and charts (double click to enlarge) above:
Thanks,
Morris
website: www.superforcesignals.com

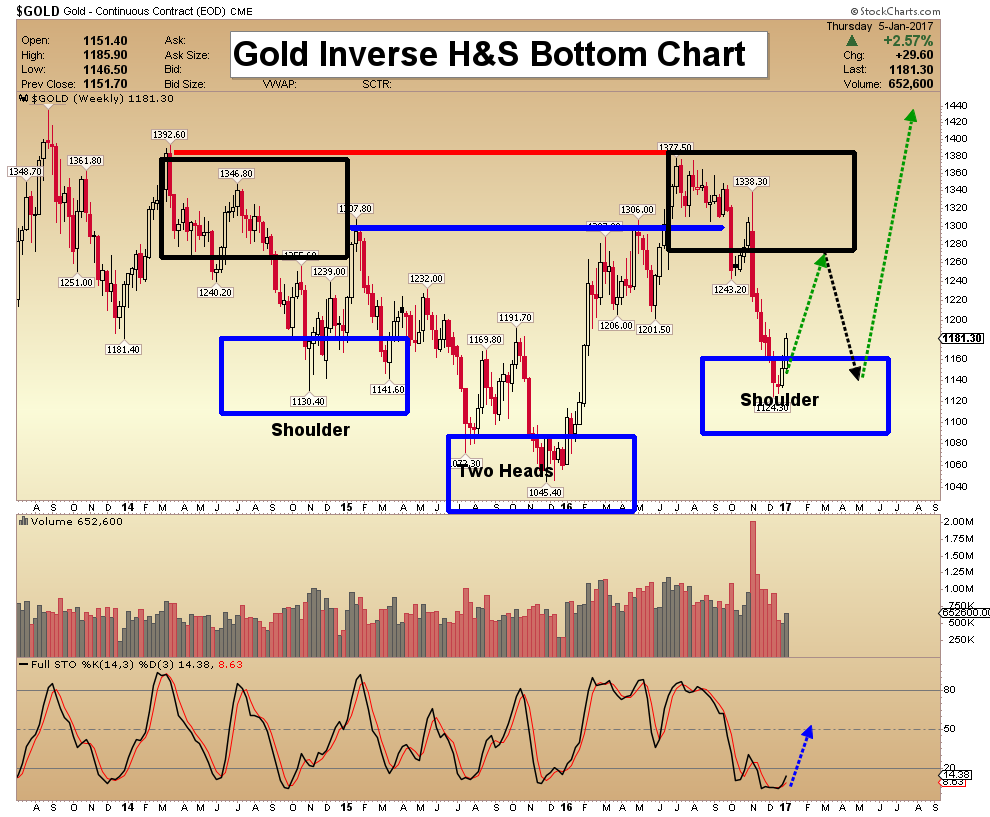
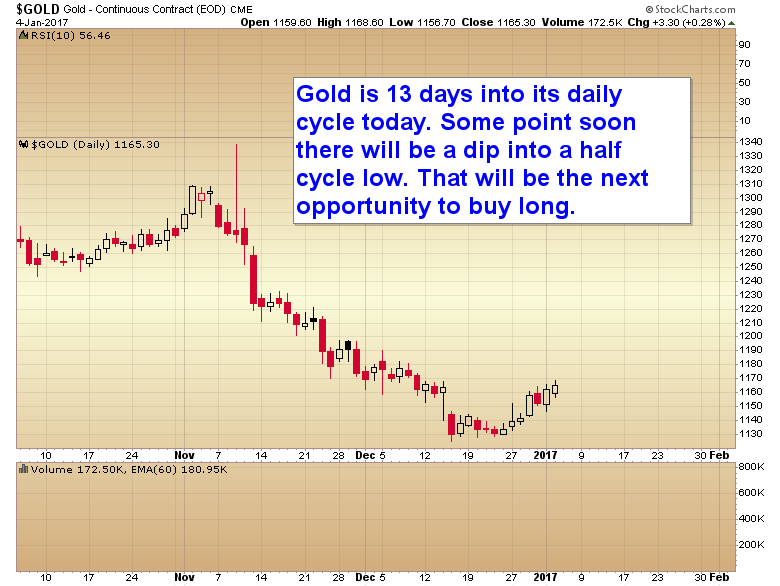
Gold is 13 days into its daily cycle. At some point soon there will be a dip into a half cycle low. That will be the next opportunity to buy long.
…related: US Jobs Report: Key Driver For Gold
 Despite the millions of dollars Wall Street plowed into the Clinton campaign in vain, the financial industry has nevertheless now become downright giddy with the prospects of a Donald Trump presidency. The imperative question investors need to determine is will the Trump presidency be able to generate viable growth. And, if he cannot produce robust and sustainable growth imminently, are the markets now priced for perfection that simply may never arrive?
Let’s look at the President Elect’s proposals to find an answer.
A top priority of the Trump presidency will be a reduction in the tax rate for the repatriation of foreign earnings on U.S. companies. According to Credit Suisse, the cumulative earnings parked by S&P 500 companies overseas is over $2 trillion.
First off, the entire $2 trillion will not be repatriated. This is because American companies use some of this money for normal business operation overseas. However, the belief is that with a lower rate much of it will find its way back home. This could be a good thing, even though the last time this occurred the money went mostly for stock buybacks and acquisitions. But what is most misunderstood is the impact this transaction will have on the dollar. Much of U.S multinational earnings are sitting in foreign currencies. For example, when Apple Inc. sells a phone in the Eurozone it does so in Euros, not dollars. Therefore, repatriated capital must be converted into dollars and that will provide an even greater boost to the greenback, which is already trading at a 14-year high due to the trenchant difference between U.S bond yields and Fed monetary policy as compared to those overseas. This is going to increase the negative effect on multinational companies that lose in currency translation when foreign earnings are converted into dollars, and will offset to a great degree the positive effect of gaining access to that cash.
Next, Trump is set to reduce regulations from day one. And the regulation that Wall Street would like to see reduced substantially is the Wall Street and banking regulations know as Dodd-Frank, which includes the so-called Volcker Rule. This would free banks to lend more money and is one of the primary reasons why Wall Street is now so enamored by Mr. Trump.
Adding to this regulatory redux is the potential dismantling of the Environmental Protection Agency (the “EPA”). President-elect Trump has selected an EPA Administrator who is known for his vigorous opposition of a multitude of EPA regulations. These regulations are stifling growth and their abrogation would supply a boost to energy and manufacturing. However, although good news for refineries and factories, manufacturing accounts for only about 10% of the U.S. economy.
But what the stock market hasn’t factored into its equation is that there will be a whole new set of regulations for companies. For example, Trump has floated the notion of withdrawing from NAFTA and imposing a border tax on imports. If a U.S. Corporation outsources its manufacturing or labor resources overseas it may face some combination of fines, tariffs and taxes. This will negatively impact the margins of multinationals that produce products more cheaply overseas and could also result in a massive tax increase for American consumers.
Then we have Trump’s humongous Infrastructure vision that is set to include a great wall on our southern border with a beautiful door. And a refurbishing of bridges, roads and airports with a price tag of around $1 trillion dollars.
But before you invest in shovels you should know that Senate Majority Leader Mitch McConnell has already poured cold water on his plan; telling reporters recently that he wants to avoid such a $1 trillion stimulus package. Trump is also getting pushback from deficit hawks, including House Speaker Paul Ryan and the remnants of the Tea party in Congress. Even Trump’s appointee to the director of the Office of Management and Budget, Rep. Mick Mulvaney, is considered a hard-liner against deficit spending and would rather shut down the government before extending the national debt.
Trump’s original campaign pitch for infrastructure included using $167 billion in federal tax credits to engender that $1 trillion in private-sector infrastructure investment over the next decade. Trump is hoping to get the private sector on board. This may be a great idea, but one has to ask: if there exists a venture that is so profitable, why hasn’t the private sector taken them on already? After all, funds have been made available for virtually free for the past eight years thanks to the Fed. And, since the private sector will only be interested in projects that can actually make money, will consumers now pay to drive on newly paved roads that used to be free, and won’t they also balk at paying tolls on bridges to nowhere?
Also, if spending money on infrastructure was the pathway to prosperity, why has the Japanese economy been in a perpetually funk for decades; and how is it that the ghost infrastructures of China’s bubble economy are now crumbling under the weight of capital flight and a falling yuan? The reason why government-directed infrastructure spending doesn’t produce viable growth is that the money is just borrowed from the private sector from funds that would have been spent anyway–but in a much more productive manner. And massive deficit spending doesn’t stimulate the economy unless it is financed by the central bank. But this type of temporary and unbalanced “stimulus” eventually comes at the costs of higher inflation and spiking interest rates. Nevertheless, Trump’s infrastructure plans will come at a time when the Fed is raising rates, not reducing them. Therefore, surging borrowing costs will occur immediately and actually end up reducing GDP from the start.
Finally, at the heart of the Trumpian hype and hope are tax cuts for both the corporate and personal sectors. Tax cuts do incentivize growth. However, Paul Ryan has indicated that he wants to simplify the tax code by lowering rates a nd eliminating deductions; with the net effect being revenue neutral and keeping the effective tax rate the same. A simplification of the tax code is still a good thing, but this is not going to have anywhere near as big an effect on the economy as the Reagan tax cuts, which reduced the rate by 20 percentage points on the top tier.
The Trump Presidency has the potential to be bullish for the economy in the long run. However, the bottom line is GDP is a function of a growing labor force and productivity enhancements. It’s hard to imagine Trump will open the floodgates to immigration; and it takes time for tax cuts and reduced regulations to spur innovation.
But there exist some serious headwinds to this economy and massively overvalued stock market in the near term. The most troubling of which are the surging U.S. dollar and Treasury yields that have doubled over the past six months.
Of particular saliency is the pressure put on China and the emerging markets due to these factors, which is expediting capital flight. In fact, interest rates are surging across the globe. For example, the Chinese 10-Year bond yield recently surged the most on record (22 basis points in one day) to 3.45%–the highest level in 16 months. And China’s yuan has plunged 13% since January 2014 against the U.S. and Hong Kong dollars. Currency and interest rate chaos will act as kryptonite for the overleveraged economy of China, whose economic growth has accounted for one third of total growth worldwide since the Financial Crisis.
One of the other early casualties of Trumponomics could be the President elect’s beloved real estate sector. The typical fixed rate on a 30-year mortgage has risen to around 4.4%. Because of this, U.S. Bancorp, now expects mortgage revenue to decline between 25-30% in the fourth quarter compared with the previous three months, as fewer home owners refinance loans. In addition, groundbreakings for new homes in November fell by 18.7%, to a seasonally-adjusted annual rate of just 1.09 million units; and the MBA Mortgage Application Index dropped 12%, while the refinancing index plunged 22% in the final week of 2016.
History has clearly proven that systemic bubbles never break smoothly or harmlessly. And the epic worldwide bond bubble will not be the exception to the rule. Therefore, before any of the positive moves from the new Trump Administration can take hold it could run smack into a bond market and currency crisis in early 2017.
The stock market has already priced in Tumponomic perfection before he has even placed his hand on the bible. While that could spell huge trouble for markets and the economy in the short-run; it could also be a great opportunity for sage investors that are prepared to profit from the tumult.

Stock Trading Alert originally sent to subscribers on January 5, 2017, 6:56 AM.
Briefly: In our opinion, speculative short positions are favored (with stop-loss at 2,330, and profit target at 2,150, S&P 500 index).
Our intraday outlook remains bearish, and our short-term outlook is bearish. Our medium-term outlook remains neutral, following S&P 500 index breakout above last year’s all-time high:
Intraday outlook (next 24 hours): bearish
Short-term outlook (next 1-2 weeks): bearish
Medium-term outlook (next 1-3 months): neutral
Long-term outlook (next year): neutral
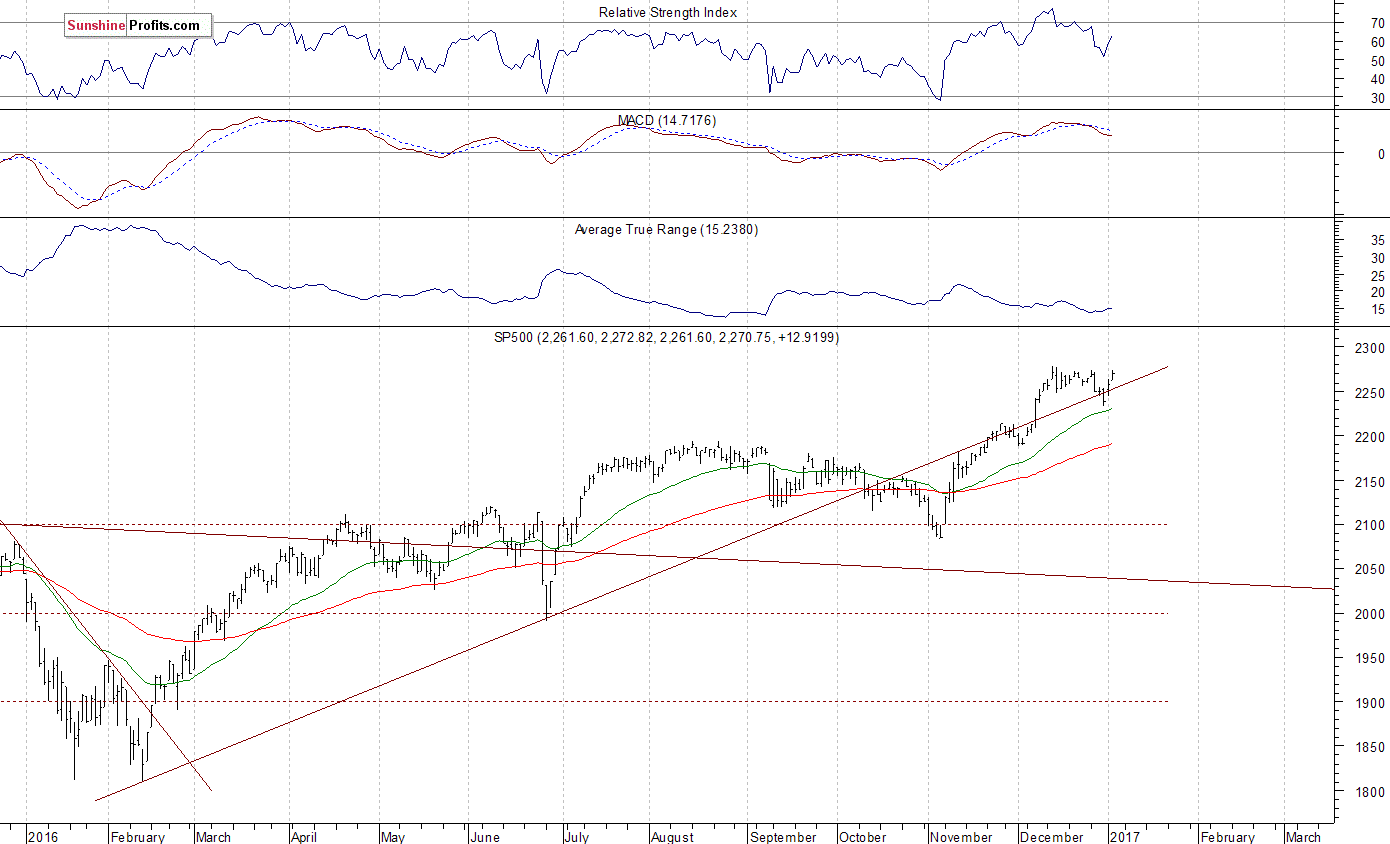
The main U.S. stock market indexes gained between 0.3% and 0.6% on Wednesday, extending their short-term uptrend, as investors’ sentiment remained bullish following Tuesday’s rally. The S&P 500 index continues to trade relatively close to its December 13 all-time high of 2,277.53. For now, it looks like a flat correction within an uptrend off last year’s early November low. But will the market extend its year-long uptrend even further before some more meaningful downward correction? The nearest important level of resistance remains at around 2,280, marked by record high, and the next resistance level is at 2,300 mark. On the other hand, support level is at 2,250, marked by recent resistance level. The next support level remains at 2,200-2,220. The index continues to trade along its medium-term upward trend line. It also trades within a few-week-long consolidation, as the daily chart shows:
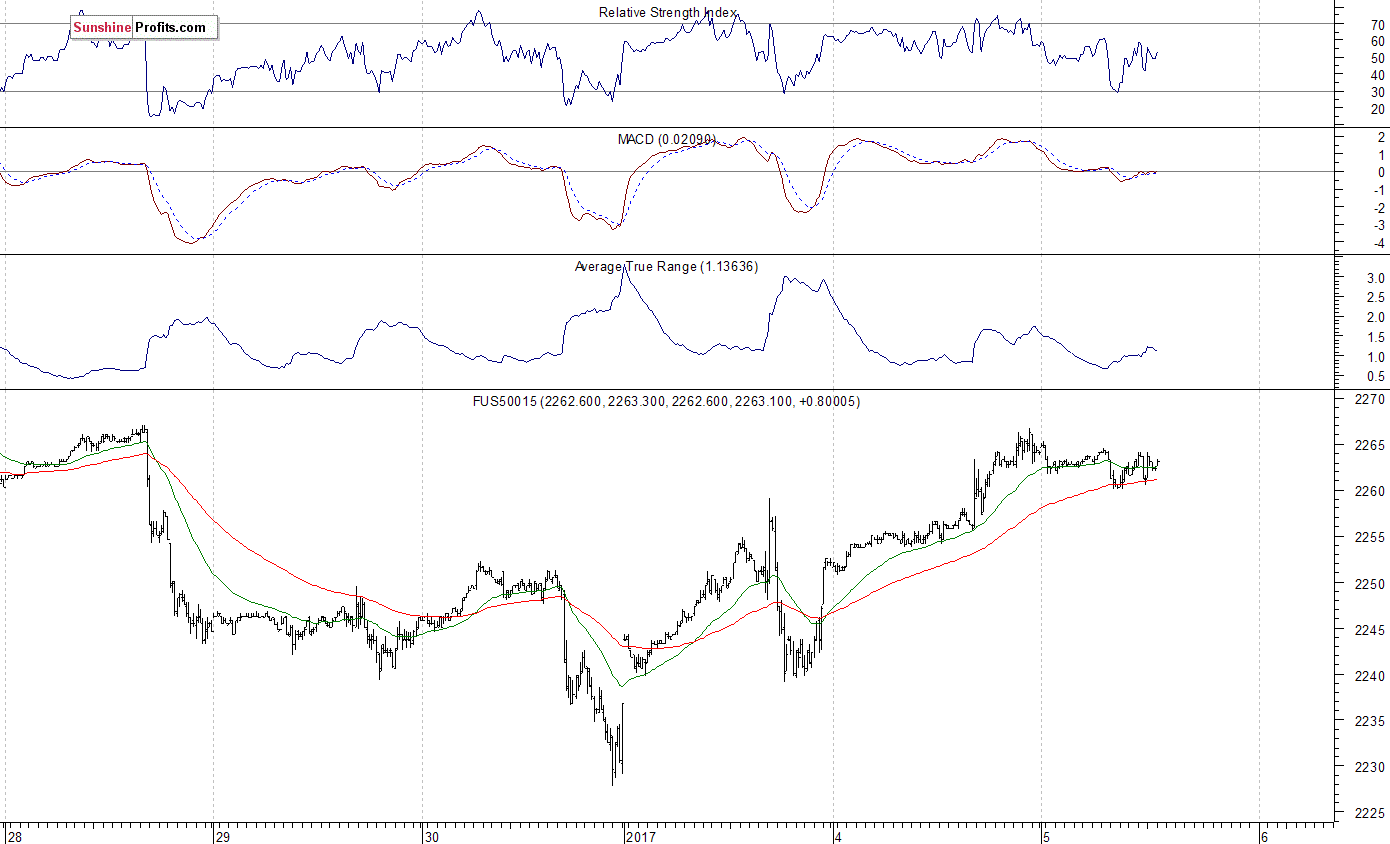
Expectations before the opening of today’s trading session are virtually flat, following yesterday’s move up. The index futures are currently down 0.1%. The European stock market indexes have been mixed so far. Investors will now wait for some economic data announcements: ADP Employment Change at 8:15 a.m., Initial Claims at 8:30 a.m., ISM Services number at 10:00 a.m. The ADP Employment Change report is a measure of the change in non-farm, private employment. It is a relatively important announcement ahead of tomorrow’s monthly jobs data release from the U.S. Bureau of Labor Statistics. The S&P 500 futures contract trades within an intraday consolidation, as investors take some short-term profits off the table following this week’s advance. It continues to trade above Friday’s local highs along the level of 2,250. The next important level of resistance is at around 2,270-2,280, marked by previous consolidation along record highs. On the other hand, support level is at 2,250-2,255, marked by yesterday’s consolidation, among others. The next support level is at around 2,240, marked by recent local low. For now, it looks like a flat correction within a short-term uptrend. However, the market remains below the resistance level marked by December consolidation. Will it break above its record highs?
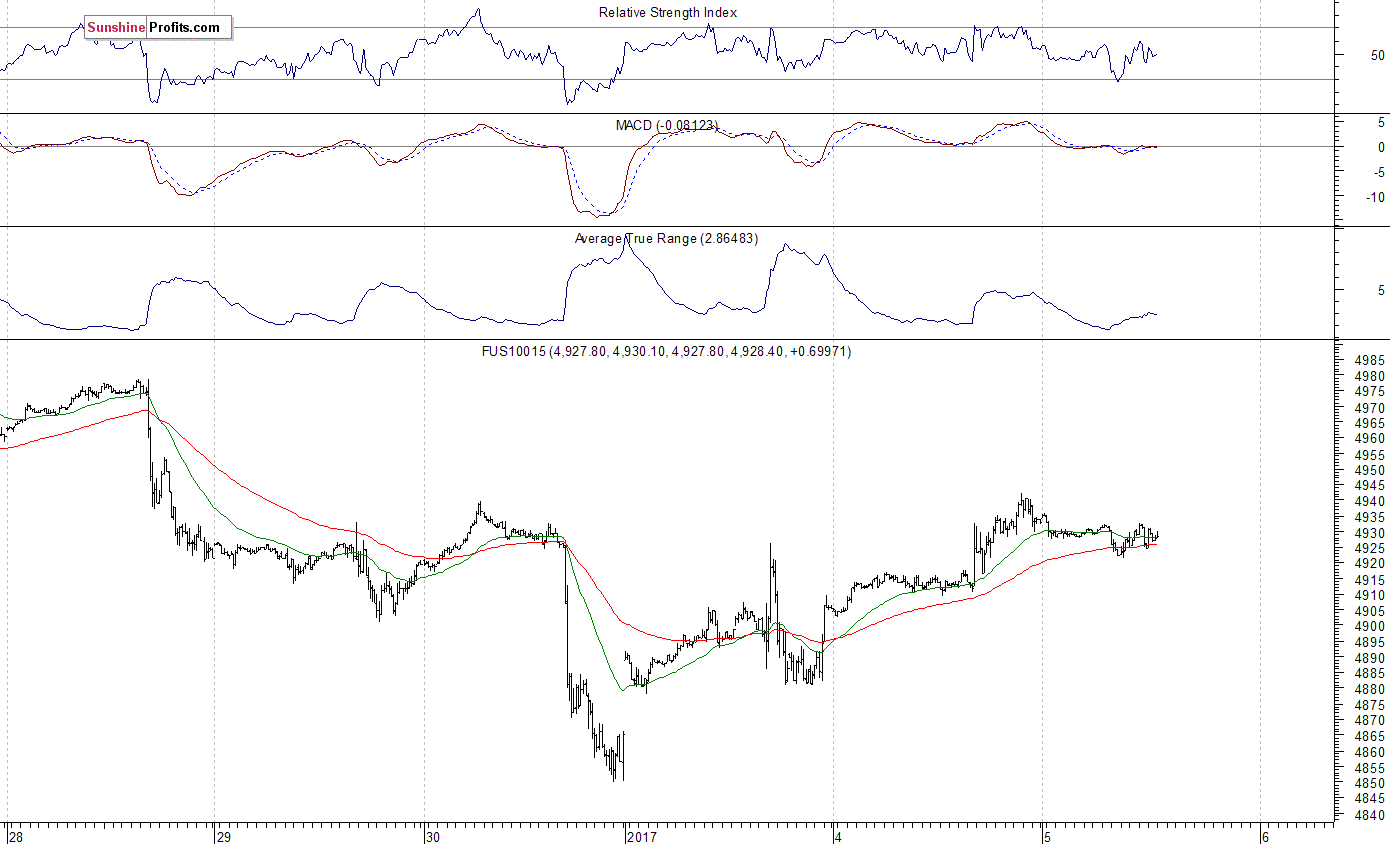
The technology Nasdaq 100 futures contract follows a similar path, as it currently trades within an intraday consolidation. The market has retraced its Friday’s sell-off following a bounce off support level at around 4,850. The nearest important level of resistance is at around 4,920-4,940, marked by local highs, and the next resistance level is at 5,000 mark. For now, it looks like an upward correction within a short-term downtrend. Will the technology Nasdaq 100 futures contract resume its medium-term uptrend and break above round resistance level of 5,000? The technology stocks continue to fluctuate following November – December rally, as we can see on the 15-minute chart:
Concluding, the broad stock market retraced its late December decline over the past two days, as investors’ sentiment improved sharply following global stock markets rally. Is this a new short-term uptrend or just upward correction? The S&P 500 index got back to its December trading range, marked by record high of 2,277.53. We still can see some medium-term overbought conditions accompanied by negative technical divergences. Therefore, we continue to maintain our speculative short position (opened on December 14 at 2,268.35 – opening price of the S&P 500 index). Stop-loss level remains at 2,330 and potential profit target is at 2,150 (S&P 500 index). You can trade S&P 500 index using futures contracts (S&P 500 futures contract – SP, E-mini S&P 500 futures contract – ES) or an ETF like the SPDR S&P 500 ETF – SPY. It is always important to set some exit price level in case some events cause the price to move in the unlikely direction. Having safety measures in place helps limit potential losses while letting the gains grow.
To summarize: short position in S&P 500 index is justified from the risk/reward perspective with the following entry prices, stop-loss orders and profit target price levels:
S&P 500 index – short position: profit target level: 2,150; stop-loss level: 2,330
S&P 500 futures contract (March 2017) – short position: profit target level: 2,145; stop-loss level: 2,325
SPY ETF (SPDR S&P 500, not leveraged) – short position: profit target level: $214; stop-loss level: $232
SDS ETF (ProShares UltraShort S&P500, leveraged: -2x) – long position: profit target level: $16.35; stop-loss level: $14.00 (calculated using trade’s opening price on Dec 14 at $14.78).
Thank you.
Paul Rejczak
Stock Trading Strategist
Stock Trading Alerts

Quotable
“We know from chaos theory that even if you had a perfect model of the world, you’d need infinite precision in order to predict future events. With sociopolitical or economic phenomena, we don’t have anything like that.”
–Nassim Nicholas Taleb
Commentary & Analysis
The Fed’s Fake News: Inflation Risks. Buy bonds!

It’s an interesting aspect of the human condition—clinging to our view despite the fact reality has already invalidated them. The Federal Open Market Committee seems to have this characteristic firmly embedded in its DNA.
To wit, today’s headline from Reuters:
Now, not to be too critical of this august body of Ph.D.-laced economists, but if you are on the Federal Open Market Committee it seems you should be aware of the latest research that shows increased fiscal spending when debt-gdp levels are already high doesn’t lead to inflation; but in fact adds to deflationary pressures for the economy.
I place into evidence the following from Hoisington Research; a fixed income investment rd management firm who is arguably the best bond manager in the world. This is from their 3 Quarter 2016 Economic Review and Outlook:
Fed policymakers agree Trump fiscal boost poses inflation risk
WASHINGTON, Jan 4 (Reuters) – Almost all Federal Reserve policymakers thought the economy could grow more quickly because of fiscal stimulus under the Trump administration and many were eyeing faster interest rate increases, minutes from the central bank’s December meeting showed.
If new fiscal measures are enacted, debt-to-GDP ratios will be increased and will further depress growth, thereby causing interest rates to move lower, not higher. In a highly incongruous development, governments will therefore be able to finance their new debt offerings at lower costs. While this may seem to be a good thing for the individual governments, the great majority of their constituents will be harmed. The higher debt will set off a chain reaction of unintended consequences. The 70-75% of the households that receive the bulk of their investment income from interest bearing accounts will have fewer funds for retirement. This, in turn, will cause older members of the workforce to work longer and save more, blocking job opportunities for new entrants into the labor force. Thus, fiscal decisions, which result in higher deficits, are likely to perpetuate and intensify our underlying economic problems.
Impressive scholarly research has demonstrated that the government spending multiplier is in fact negative, meaning that a dollar of deficit spending slows economic output. The fundamental rationale is that the government has to withdraw funds, via taxes or borrowing, from the private sector, to spend their dollars. When that happens, the more productive private sector of the economy has fewer funds to use to make productive investments. Thus the economy slows along with productivity when government spending increases.
*************************************************************************
If you are seeking excellent independent trading ideas covering the key global asset classes, you have found it in our Key Market Strategies service. At $89 per year, most all of our subscribers would tell you it’s a massive bargain. That bargain now is only going to get better, as we are adding coverage of key futures markets in addition to the ETFs we presently cover. But we are also raising our price for the service, accordingly. So, between now and the first week in 2017 you have a chance to subscribe at our current price of $89 per year and be grandfathered in to the service no matter future price increases (as are our current subscribers). So, subscribe today to Key Market Strategies and don’t miss another good idea. Plus, we are putting the finishing touches on our 2017 Forecast Issue covering stocks, bonds, gold, oil, and currencies. Don’t miss it.
This offer expires on Sunday, January 7th. Our 2017 Forecast issue for stocks, bonds, gold, oil, and the major currency pairs is due out tomorrow. And we plan to offer a live webinar next week for subscribers only to discuss this forecast and take questions.
**************************************************************
Let’s face it. There will be disappointment when it comes to the Trump agenda. The Democrats will do all they can to block key parts; and maybe some of Trump’s own party will throw up a few roadblocks. And even if enacted, the benefits of tax cuts and regulation (which is where the benefits flow to the real economy) will take time to flow through. In addition, much of the benefits
Black Swan Capital’s Currency Currents is strictly an informational publication and does not provide personalized or individualized investment or trading advice. Commodity futures and forex trading involves substantial risk of loss and may not be suitable for you. The money you allocate to futures or forex trading should be money that you can afford to lose. Please carefully read Black Swan’s full disclaimer, which is available at http://www.blackswantrading.com/disclaimer
will likely be overwhelmed by existing debt levels and the increased drag from Trump’s infrastructure plans.
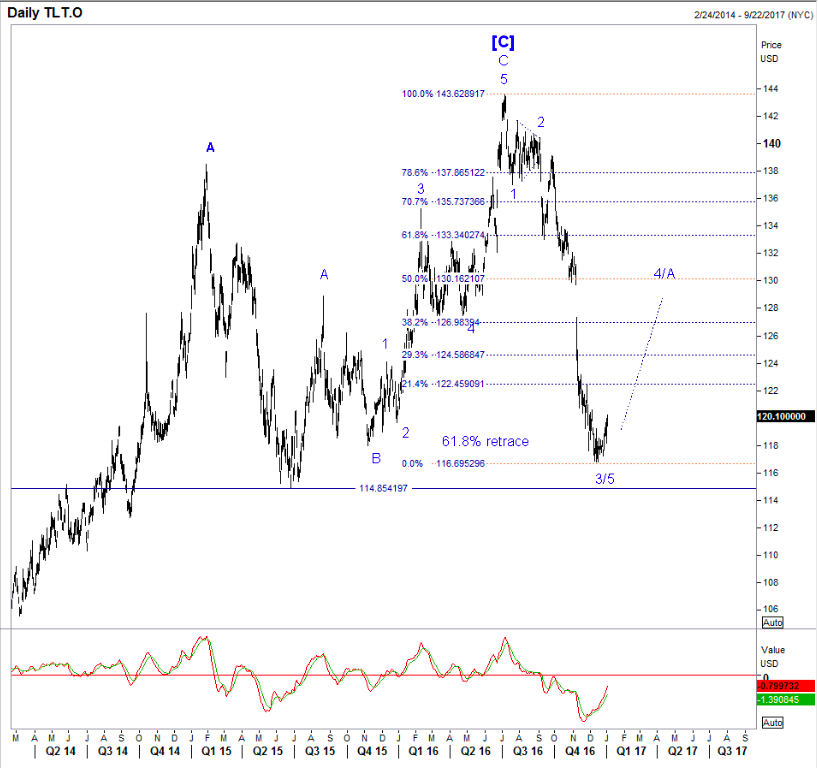
So, buy bonds. If the Fed is forecasting inflation, what better contrary indicator do you need?
TLT (iShares 20+ Year Treasury Bond ETF) daily wave view:
Jack Crooks
President, Black Swan Capital

-
I know Mike is a very solid investor and respect his opinions very much. So if he says pay attention to this or that - I will.
~ Dale G.
-
I've started managing my own investments so view Michael's site as a one-stop shop from which to get information and perspectives.
~ Dave E.
-
Michael offers easy reading, honest, common sense information that anyone can use in a practical manner.
~ der_al.
-
A sane voice in a scrambled investment world.
~ Ed R.
Inside Edge Pro Contributors

Greg Weldon

Josef Schachter

Tyler Bollhorn

Ryan Irvine

Paul Beattie

Martin Straith

Patrick Ceresna

Mark Leibovit

James Thorne

Victor Adair