
Wealth Building Strategies
By listening to President-elect Trump we can anticipate the effect his administration will have on the US economy.
Here is what we know: Mr. Trump plans to beef up the military, and improve US infrastructure, including a wall at the southern border.
While there are other priorities, such as improving on healthcare, just his two main goals will require many billions of dollars.
Being a successful businessman is his asset, and no doubt the new president will surprise us with funding that will be new and novel, such as enticing US companies with overseas assets to repatriate those funds and put them to work in the USA.
Nevertheless, we can be assured that whatever new sources of revenue the new administration comes up with, government spending will increase and so will the Federal Deficit.
The total US Federal Deficit will top 20 trillion before long. This will be accommodated with more printing press money. Congress and the Senate are likely to go along with spending plans. Already the ongoing monetary inflation is causing price inflation, and the expectation is that this price inflation will accelerate.
Our ’investing for maximum profits’ therefore must include stocks and commodities that will grow during a period of price inflation.
Charts are courtesy Stockcharts.com unless indicated.
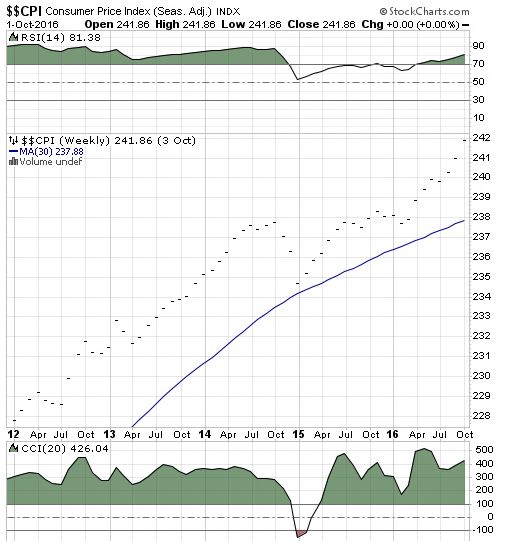
Featured is the monthly US CPI chart. Even though this official government Consumer Price Index is ‘tweeked’ to make it appear as benign as possible, the trend is clearly rising higher.
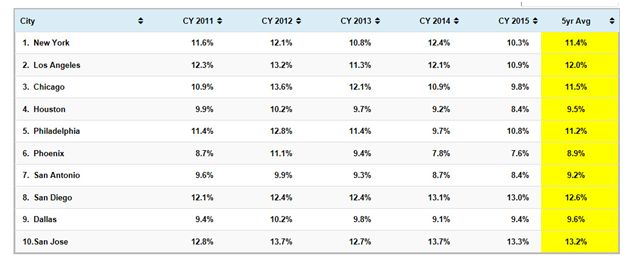
Featured is the Chapwood index of price inflation in 10 US cities. This index www.chapwoodindex.com tracks items that are used or consumed on a daily basis, compared to the components of the index used by the government, which are ‘massaged’ to produce a desired outcome. From these two charts (and especially the Chapwood chart) it is obvious that price inflation is ‘here to stay’.
Following are some charts that feature commodities which will benefit from increased inflation. Our personal portfolio is centered around these commodities and this portfolio has increased by over 52%, during the past 12 months. In order to stay ahead of price inflation, our assets need to grow faster than the rate of inflation.
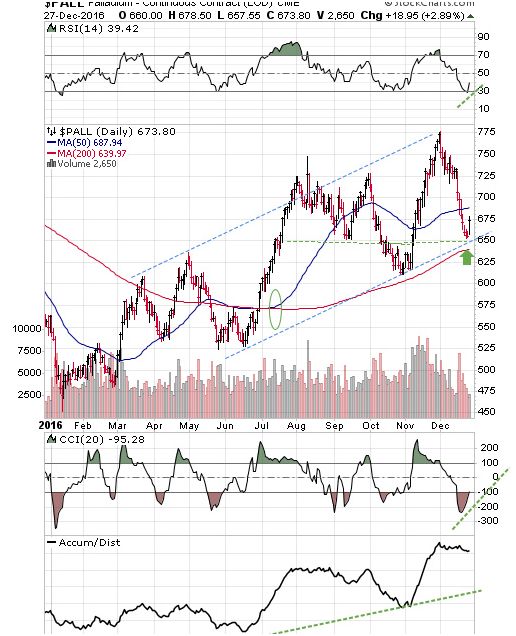
Featured is the Palladium chart. Palladium is used in catalytic converters and price inflation will continue to cause the price of Palladium to increase as people decide to buy a new car before the next price increase. This chart is bullish, as can be seen by the rising channel. The moving averages are in positive alignment (green oval), and rising, along with the supporting indicators. Price is turning up at the green arrow.
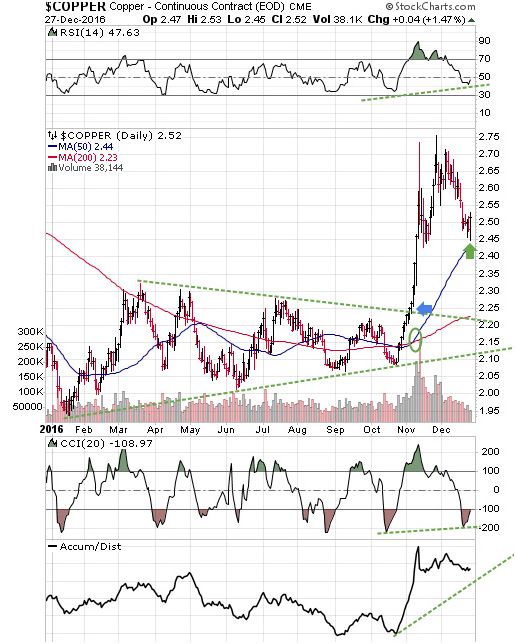
Featured is the copper chart. Price broke out from a large triangle, at the blue arrow. Up volume during the breakout was the highest in years. The rush into copper appears to have been somewhat over-done and the pullback from 2.75 has just now found support at 2.45, where price carved out a strong upside reversal on Tuesday (green arrow). The moving averages are in positive alignment and rising (green oval). The supporting indicators are ready to turn positive, including the important A/D line at the bottom. In any event it is obvious from this chart that copper is benefiting from price inflation. (One of the stocks in our “Model Portfolio” – Western Copper – increased by 50% for a while on Tuesday).
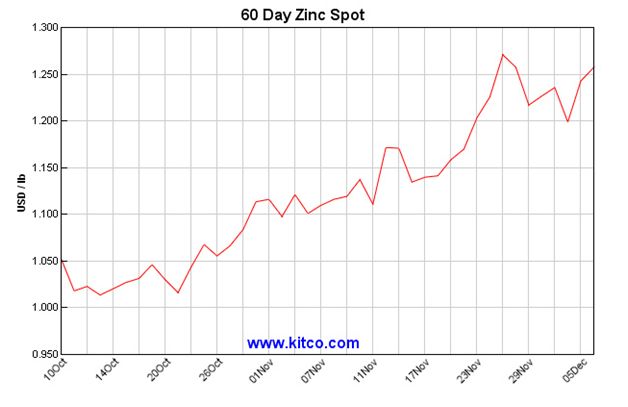
This chart is courtesy Kitco.com and it shows Zinc to be in a bull market. New spending on improving the US infrastructure will benefit zinc along with copper.
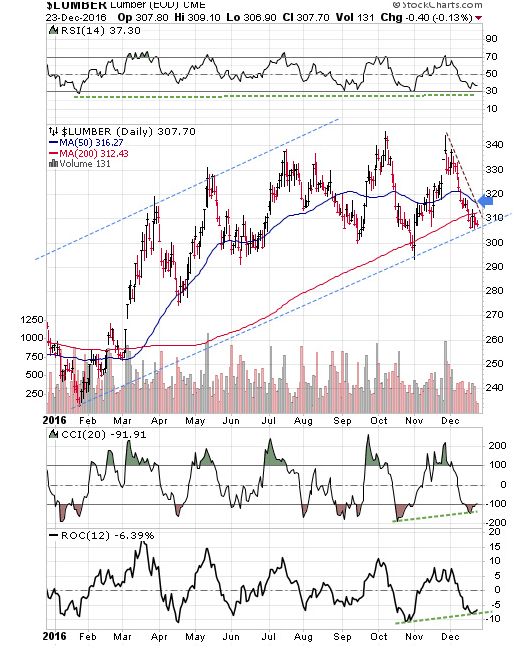
Featured is the lumber chart. The trend is higher, as can be seen by the blue channel. A close above the blue arrow will tell us that the uptrend is ongoing. The supporting indicators are ready to turn positive.
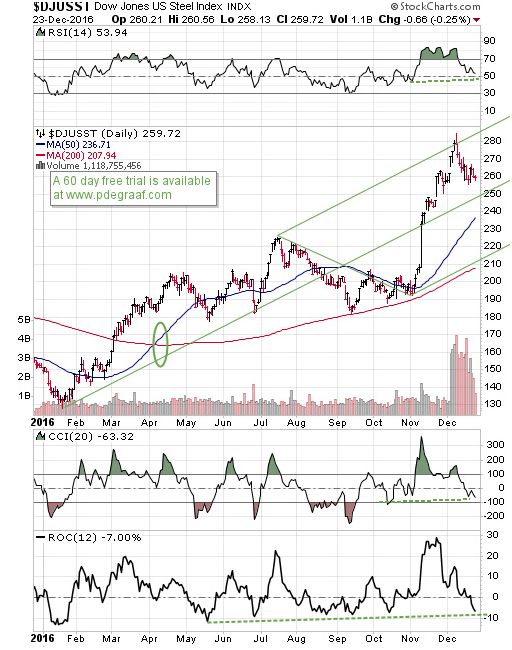
Featured is the Dow Jones US steel index. Price has been in a bull market since January, and the Andrews Pitchfork analysis supports the rising trend. The supporting indicators are back at support levels. The moving averages are in positive alignment and rising.
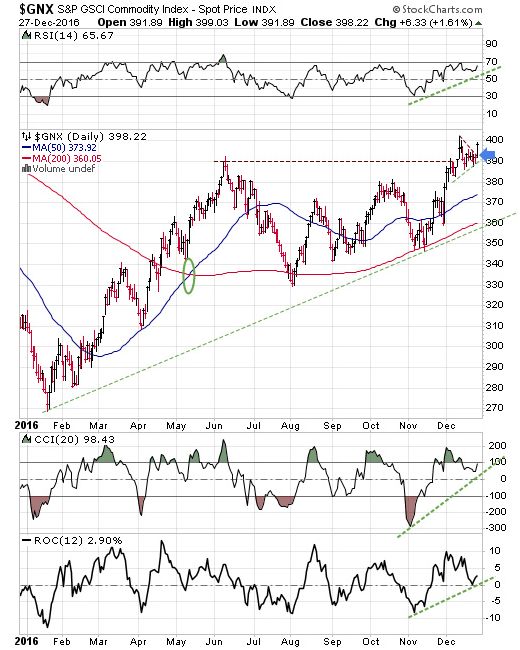
Featured is GNX the commodity index. Price has been rising all year, while carving out a bullish Advancing Right Angled Triangle (ARAT). The supporting indicators are positive and the moving averages are in positive alignment and rising. The breakout at the blue arrow turns the trend back to bullish, with a target at 690!
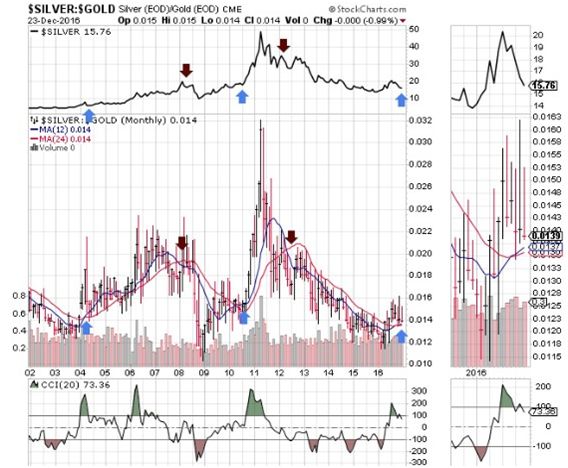
Featured is the index that compares silver to gold, with two moving averages. The silver chart is at the top. The blue arrows point to bullish crossovers (blue above red) that turn out to be buying signals for silver. The purple arrows point to bearish crossovers (red above blue), that turned out to be sell signals. The blue arrow at the right points to a buy signal that is developing. The close-up chart at the right shows this in detail. Because silver is sought by investors as a hedge against price inflation, silver will benefit from the new presidency.
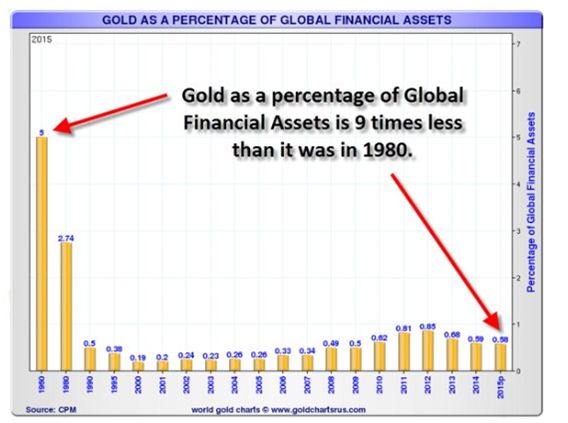
This chart courtesy goldchartsrus.com and annotated by I.M. Vronsky at Gold-eagle, shows gold as a percentage of financial assets.
There are at least four reasons why gold will rise again:
- Protection against inflation.
- Reaction against Federal Deficits
- A beneficiary of negative ‘real interest rates’, currently at – 1.22%
- Several billion new investors since 1980. Most of these reside in Asia, where gold is appreciated as a ‘store of value’.
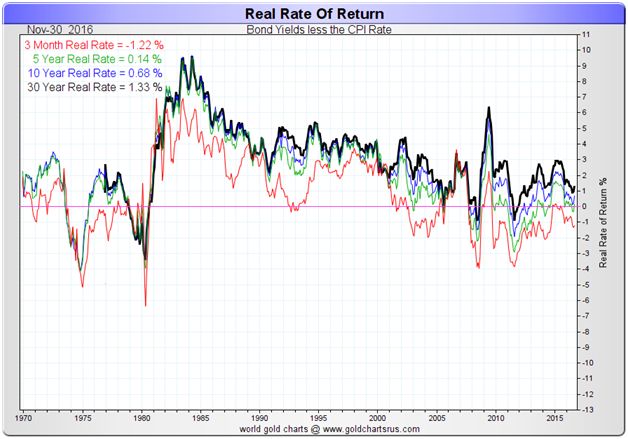
This chart courtesy Goldchartsrus.com shows the ‘real rate’ of interest. The three month rate is -1.22%, while using government supplied numbers. When actual cost of living numbers (such as the Chapwood index) are used, the ‘real rate’ is much lower. Gold thrives when ‘real rate’ are negative.
Disclaimer: Investing involves taking risks.
Peter Degraaf is NOT responsible for your investment decisions.
Peter Degraaf is an investor with over 50 years of experience. He publishes a daily report for his many subscribers, including a ‘model portfolio’ on Monday evening. For a sample copy please visit www.pdegraaf.com

 Richard Wyckoff – logic has rules, some folks like the short cuts, hence they wonder why their trade ends in a mess.
Previous Post: Richard Wyckoff logic not working, this maybe why?
Part 1
“Without specific, clear, and tested rules, speculators do not have any real chance of success.” ~ Jesse Livermore
“If you have trouble imagining a 20% loss in the stock market, you shouldn’t be in stocks.” ~ John (Jack) Bogle
“The stock market is filled with individuals who know the price of everything, but the value of nothing.” ~ Philip Fisher
“I buy on the assumption they could close the market the next day and not reopen it for five years” and “Much success can be attributed to inactivity. Most investors cannot resist the temptation to constantly buy and sell.” ~ Warren Buffet
“My experience has been that in successful businesses and fund management companies, which performed well over the long-term, some courageous decisions were taken. Courageous fund managers reduce their positions when markets become frothy and accumulate equities when economic and social conditions are dire. They avoid the most popular sectors, which are therefore over-valued, and invest in neglected sectors because being neglected by investors they are by definition inexpensive. The point is that it is very hard and that it takes a lot of courage for a fund manager to avoid the most popular sectors and stocks and to invest in unloved assets. Finally, every investor understands the principle ‘buy low and sell high’, but when prices are low nobody wants to buy.” ~ Marc Faber
More from RTT Tv

2016 was the year I finally decided to codify my niche as a psychology-focused market contrarian, putting the Alice, Red Queen and Rabbit components of NFTRH’s logo right there on my inner forearm, forever.
This is because I love the imagery and themes of NFTRH’s guiding metaphorical story, Alice in Wonderland, and because the weird technical tools I use are generally in service to one thing; being right when the herds are going the wrong way. The concept originally came to me as the markets were beginning their descent into the crash of 2008 as the newly launched market management service needed a view that was apart from the emotional herds then preparing to go down the drain. Alice’s quote (Lewis Carroll), a portion of which occupies my other inner forearm was perfect in this regard…
“If I had a world of my own, everything would be nonsense. Nothing would be what it is, because everything would be what it isn’t. And contrary wise, what is, it wouldn’t be. And what it wouldn’t be, it would. You see?”
2016 was a year that fit NFTRH’s niche to a tee and it is no coincidence that it has been a good one, performance wise (though in full disclosure, the last couple of weeks have taken a chunk of profits back as I give the markets some leeway through the ‘Santa’ seasonal). Let’s take a stroll through 2016 before taking a brief look ahead to 2017.
The year started with the topping pattern (that wasn’t, or isn’t yet) in the S&P 500. For all the world it looked like a top, walked like a top and quacked like a top. But it wasn’t a top! That was proven when SPX rebounded from its lower low to the 2014 and 2015 lows and then rose to cross the 20 and 50 week exponential moving averages back up again. This was similar to the 2011 whipsaw, but on a grander scale. Now of course, the would-be topping pattern may be a left shoulder to a bearish Head & Shoulders pattern in construction. But even if so, the ultimate high could be well higher (ref. the 1998-2000 situation). As of now, the market is bullish. Period.

But considering that Casino Patrons are momo’ing the market and dumb money is strongly over bullish, and the market is over valued (one important valuation metric being the greater interest being paid on ‘risk free’ Treasury bonds vs. the S&P 500) as the media TRUMPets a new promotion; namely bond-eroding inflation as far as the eye can see due to coming fiscal policy changes. The Treasury bond bull market is DEAD trumpet the mainstream financial media. Well, for another view, let’s compare what the public was doing last summer during the NIRP! hysteria vs. today.

Thanks to the data from Sentimentrader we are able to see that herds of dumb money (per the Public Optimism Index or OPTIX) were thundering into Treasury bonds despite historically low yields last summer because… BREXIT!!! and NIRP!!!. This was just in time to create a top in bonds prior to dynamic changes over the second half of the year. Now the public hates bonds because… Trump, because… inflation, because… media. Well, Trump’s election did not cause the bond market to fall apart; it was already bearish after last summer’s big, momentum-fueled sentiment event put the dumb money all in.
Now, who was taking the bearish side of the market last summer? The same people taking the bullish side today; the Commercial Hedgers AKA the smart money. For the sake of space, let’s not cover too much old ground. You can see the Hedgers’ general positioning in the post in which I poked the trend following, rabble rousing media in the eye as it used a simple line drawn by Louise Yamada to make a big declaration in order to get people all worked up (and emotional).
Above we have covered the early part of the year with respect to the stock market’s failure to do what it was ‘supposed’ to do, and some incredible contrarian bond market dynamics in 2016. Now switching back to stocks, we had two great sentiment events this year, which anecdotally at least, seemed to get the max number of players going the wrong way. Those would be the BREXIT and US Election hysterias. Common themes attended both of these events, keeping us on the bull side of the barn. We poked the media in the eye about these promotions as well…
For each situation sentiment was over bearish right into the actual event. The other common theme – for the broad US stock market at least – was that major technical support was completely intact, as we noted occasionally in public and constantly in NFTRH reports. What do they say about an intact uptrend? When pullbacks occur on over bearish sentiment during an uptrend, it is usually a buying opportunity.
Looking at a specific sector, when an industry (in this case Semiconductor Equipment) had positive fundamentals (as we tracked each month) and is technically intact, a bearish sentiment backdrop was a buy, as we noted back in May. AMAT and LRCX came to be our primary Semi Equipment picks.
AMAT Chirps, B2B Ramps, Yellen Hawks and Gold’s Fundamentals Erode
During the time frame of the above linked posts, I was being told that a renowned technology “expert” was exactly opposite my stance, bearish the semis and bullish on gold. You may or may not remember me grousing about that last summer. My belligerence even lost me a long-time NFTRH subscriber…
Today, I note small and large analytical sources falling all over themselves recommending these Semi Equipment companies. Trend followers all…
I would estimate that 90% of what you read in the financial media, whether at the big shops like Bloomberg and Marketwatch or out there in the blogsphere where we little guys think we can add value to your investment theses, is unadulterated trend-following. It’s what sells. And your eyeballs need to be sold.
The financial media complex is not set up to tell you what is likely to happen. It is set up to tell you what has happened or ishappening. From there it will often extrapolate to tell you what will happen, and with current events backing the extrapolation at any given time, 90% of information consumers will take it seriously, forgetting later just who provided the faulty information as it gets lost in the massive buzz of the electronic media industry.
2016 was mainly an exercise in maintaining discipline with respect to technical analysis signposts (most notably, simple support and resistance levels) and discipline from a contrary perspective.
“Nothing would be what it is, because everything would be what it isn’t. And contrary wise, what is, it wouldn’t be. And what it wouldn’t be, it would. You see?”
At this moment in time I cannot tell you whether the S&P 500 will proceed directly to our long-held operating target of 2410 or not. I cannot tell you whether it will get there in our lifetimes or get cut through like warm butter in January.
But that is the whole point; we are at the traditional time of year when the bizarre ritual of crystal ball and tea leave reading is put on display by the financial media as last year’s Wrong Way Corrigans attempt to get it right this year, knowing full well that media consumers do not take the time to go back and check records.
Here is my lone prediction; 98% of these predictions will prove totally bogus and my follow-on prediction is that only 5% of the reading audience will even care or remember come December 26, 2017.
So I’ll leave you with a simple note that in 2016, when the market was over bearish and people thought they knew bearish outcomes were in the offing, the opposite proved true. Today, at the dawn of a new year, sentiment analysis states that increasingly dumb money has made a commitment to what it thinks is a “new secular bull market” in the wake of the supposedly market-friendly Trump election and its fiscal stimulus to come.
NFTRH 427’s Wrap Up segment addressed this…
- The US market went bullish last winter and has remained bullish ever since, with an intervening major support test. We talked about that oncoming test for what seemed like forever, it came about and was successful. The US market is bullish.
- Will it go bearish? The contrary setup is there, with a majority believing fiscal policy will create a new secular bull. Meanwhile, there continue to be sectors that have been out of favor, which may be winners going forward. I’d remain open to continued bulling or a reversal to bearish. It is the market’s decision, not ours.
- But I’d continue to argue that you cannot have a new secular bull market when the old bull market, a short secular or long cyclical bull from 2009, never ended. That was why we gauged the ‘higher low’ major support test. A failure would have ended the bull. Support held and the bull remained intact.
If contrary sentiment analysis paves a way for a future risk ‘off’ view, the likes of Treasury Bonds and Gold, key components of the lowly risk ‘off’ trade, will have their day. I recommend you sit back, relax and let the contrarian signals come in without taking on the pressure and unrealistic expectations of pretending to know. It worked in 2016, after all.
Subscribe to NFTRH Premium for your 30-45 page weekly report, Biiwii.com

 The world has gotten so used to ultra-low interest rates that even economists and money managers seem to be shocked by what happens when rates start creeping back towards normal levels.
Some of the mini-bubbles that formed in an essentially free-money environment are now starting to leak. Notably:
US Housing
While the action in this sector is nothing like the raging mania of the 2000s, prices in many hot US markets are at all-time highs, while affordability is at or near an all-time low. And now rising mortgage rates are beginning to bite.
Pending Home Sales Reflect “Dispirited” Buyers
(Mortgage News) – Pending sales, which were widely expected to make a good showing in November, pulled back sharply instead. The National Association of Realtors® (NAR) said its Pending Home Sales Index (PHSI), a forward-looking indicator based on contracts for existing home purchases, declined 2.5 percent to 107.3 in November from 110.0 in October. NAR said “the brisk upswing in mortgage rates and not enough inventory dispirited some would-be buyers.” The decrease brought the PHSI to its lowest level since January of this year and it is now 0.4 percent below the index last November which stood at 107.7.
Analysts polled by Econoday had been upbeat about the November outlook. The consensus was for an increase of 0.5 percent with some analysts predicting as much as a 2.0 percent gain.
Lawrence Yun, NAR chief economist said, “The budget of many prospective buyers last month was dealt an abrupt hit by the quick ascension of rates immediately after the election. Already faced with climbing home prices and minimal listings in the affordable price range, fewer home shoppers in most of the country were successfully able to sign a contract.”
US Auto Sales
Cars and trucks have been one of the economy’s bright spots for several years — which seems to have gotten everyone just a little too excited. Auto financing practices have lately begun to resemble those of the subprime mortgage bubble: Today’s average loan is for more money, lasts much longer, and is held by a much weaker credit than ever before. Now, with interest rates rising and pretty much every potential buyer already locked into a car mortgage, the bubble optimism is evaporating.
GM Plant Closures Could Signal Trouble for U.S. Auto Industry
(NBC) – General Motors will temporarily idle five U.S. assembly plants next month in a bid to reduce bloated inventories.
The cuts focus on plants building sedans and coupes, such as the Chevrolet Cruze, Cadillac CTS and Chevy Camaro, which have been losing momentum as American motorists by the millions shift from passenger cars to utility vehicles and other light trucks.
But the move could also signal a broader slowdown of the U.S. automotive market after three consecutive years of record sales. The big questions are how fast and how far a slide the industry could be facing.
Forecasts by IHS Automotive and other research firms say sales could slide by 200,000 vehicles or more, with a variety of factors threatening to create even more of a downturn. These include rising fuel prices and increasing interest rates. Automakers could offset higher monthly payments by offering new loan and lease subsidies, but such moves would, in turn, impact industry profitability.
GM’s decision to cut production at plants in Michigan, Ohio, Kansas, and Kentucky comes as it watches inventories surge, in some cases, to nearly three times what the industry considers the norm: about 60 to 65 days’ worth of vehicles on dealer lots. The company has a 177-day backlog of Camaros, while its overall inventory grew from a 79-day supply in October to 84 days at the end of November.
China
That the world’s second largest economy — with a debt load that has quintupled in the past seven years — can be called a “mini-bubble” illustrates the size of the meta-bubble in which it has emerged.
The story in a nutshell is that China responded to the Great Recession by borrowing more money in the following half decade than any other country ever, and wasting a big part of the proceeds. Now its banking system is cracking under the strain of mounting bad debts, and newly-rich Chinese are getting their capital out of Dodge at a rate that if allowed to continue will bring on a full-scale credit crisis. Already-extant capital controls will apparently be tightened up shortly.
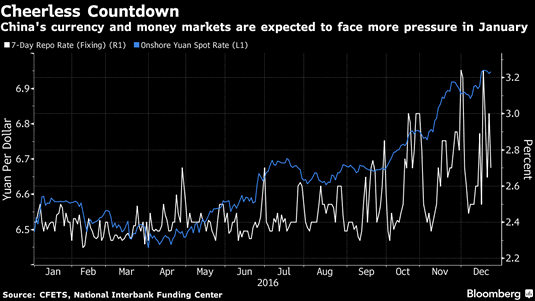
No Happy New Year in China as Currency, Liquidity Fears Loom
(Bloomberg) – China bulls could be facing a grim New Year’s eve.
China’s markets are seeing renewed pressure this month as the Federal Reserve projects a faster pace of rate increases for 2017 and its Chinese counterpart tightens monetary conditions to spur deleveraging and defend the exchange rate. The declines are capping off a tough year for investors during which bonds, shares and currency all slumped.
China’s 10-year government bond yield has surged 21 basis points in December, poised for its biggest monthly increase since August 2013, and its first annual gain since that same year, China bond data show. The yuan’s 6.6 percent decline in 2016 puts it on course for its worst year since 1994, while the Shanghai Composite Index is headed for its largest drop in five years.
The three-month interbank rate known as Shibor rose for a 50th day, its longest streak since 2010, to an 18-month high on Wednesday. The overnight repurchase rate on the Shanghai Stock Exchange jumped to as high as 33 percent the day before, the highest since Sept. 29. As banks become more reluctant to offer cash to other types of institutions, the latter have to turn to the exchange for money, said Xu Hanfei, an analyst at Guotai Junan Securities Co. in Shanghai.
The onshore yuan’s surging trading volume suggests outflows are quickening, according to Harrison Hu, chief greater China economist at Royal Bank of Scotland Group Plc. The daily average value of transactions in Shanghai climbed to $34 billion in December as of Wednesday, the highest since at least April 2014, according to data from China Foreign Exchange Trade System. The offshore exchange rate dropped 0.15 percent on Wednesday to trade near a record low, while the onshore rate was little changed.
None of these, not even China, are by themselves enough to destabilize a global financial system that’s still awash in new credit. But all three at once? Maybe.
And of course there are more potential eruptions waiting in the wings, what with the Italian bank bail-out getting harder as deposits flee those sinking ships and US stocks at record levels and thus (if – an admittedly big if – history is still a reliable guide) due for a correction.
So whether or not these current dramas amount to anything memorable, they clearly represent limits on the global financial bubble. More such limits will emerge shortly.
Gold has suffered recently in the wake of higher real interest rates while the US Dollar, thanks to higher yields has reached a 14-year high. Stronger real rates hurt Gold but so does a stronger US Dollar, which remains the dominant global currency. In addition to falling real interest rates Gold likely needs the US Dollar to approach a major peak. It may sound perverse to gold bugs but the sooner the US Dollar climbs and the stronger it gets, the closer Gold could be to the start of a new bull market.
Gold is now officially in its longest bear market ever. If we define a bull market as a multi-year advance then Gold has endured five bear markets over the past 45 years. Four of the five are plotted in the chart below. The current bear market has followed the trajectory of the 1987-1993 and 1996-2001 bears but with more downside.

Gold Bear Analog
Although Gold’s current bear market is the longest ever, its counterpart, the US Dollar is not yet in its longest bull market ever. It would need to rise for nearly another year to achieve that feat. The chart below shows that this run in the greenback has more room to rise. The trajectory of the current bull has closely mirrored that of the 1978 to 1985 bull. If that continues then the US Dollar index could reach 110 in the first half of 2017 and 120 by the end of the year.

US Dollar Index Bull Analog
The two major peaks in the US Dollar (1985 and 2001) coincided with important lows in Gold. However, it is important to note that essentially all of the price damage to Gold during the corresponding bear markets occurred well before the US Dollar peaked. The chart below was inspired by an article from ReadTheTicker. After Gold’s bottom in 1982, the US Dollar surged 37% but Gold only penetrated its previous low by 5%. From Gold’s low in 1999 the US Dollar advanced 17% while Gold did not make a new low.

US Dollar Index & Gold
The bottom line is Gold could be setting up for an epic bottom when the US Dollar becomes strong enough to cause global problems and induce policy more favorable to Gold. History shows that the majority of price damage in Gold bear markets has occurred in the earlier stages of US Dollar bull markets. A higher US Dollar will certainly push Gold lower from here but probably not too far below the 2015 low. A precursor to Gold’s turn will be when it shows strength against foreign currencies and equities while the US Dollar is rising.
We reiterate that we do not want to buy a bunch of investment positions until we see sub $1100 Gold coupled with an extreme oversold condition in bearish sentiment. We certainly see bearish sentiment and some good values in the gold stocks at present. However, some of these good values could become great values before next summer. For professional guidance from Jordan go HERE
Jordan Roy-Byrne, CMT, MFTA


-
I know Mike is a very solid investor and respect his opinions very much. So if he says pay attention to this or that - I will.
~ Dale G.
-
I've started managing my own investments so view Michael's site as a one-stop shop from which to get information and perspectives.
~ Dave E.
-
Michael offers easy reading, honest, common sense information that anyone can use in a practical manner.
~ der_al.
-
A sane voice in a scrambled investment world.
~ Ed R.
Inside Edge Pro Contributors

Greg Weldon

Josef Schachter

Tyler Bollhorn

Ryan Irvine

Paul Beattie

Martin Straith

Patrick Ceresna

Mark Leibovit

James Thorne

Victor Adair