
Asset protection
One thing that is going to become abundantly clear to every living soul on the planet over the next few years is how much loss of wealth is going to occur as a result of this great sovereign debt crisis that is unfolding …
And which I’ve been predicting since late 2015.
I may have been a bit early, but since its peak in July of this year, the 30-year U.S. Treasury has lost $226,984 of its value (based on $1,000,000 face value bond), an astounding 19 percent.
The velocity of the damage was even worse starting the day after the U.S. elections through December 15 — as I am penning this column early due to upcoming travel plans and the holidays …
With the 30-year U.S. Treasury losing $108,497 of its value (based on $1,000,000 face value bond), an astounding 10 percent — in just 26 trading days.
The yield on the 10-year Treasury note has shot up to 2.598 percent, a 40 percent jump since the elections. The 30-year yield has rocketed from a low of 2.616 percent on November 8 to its recent 3.18 high, a whopping 21.6 percent rise in just over a month.
That would be like gold rocketing from its recent low of $1,046 on December 3, 2015 to over $1,464 today. Or the Dow Industrials exploding higher from its recent high of 19,966.43 to 24,271 today. Astounding moves no matter how you measure it.
But it’s not just the 10-year interest rate that is rising. Rates on everything from two-year to 30-year terms are soaring. Plus, they’re not just rocketing higher in the United States. Interest rates are soaring all over the world.
So why are rates surging? The answers are simple:
 First, investors all over the globe are starting to see what I’ve been telling you all along: that the sovereign bond markets of Europe, Japan and the United States is the world’s biggest financial bubble ever and it’s bursting.
There’s simply no way investors are going to keep putting money in bonds with rates so low and Western-style socialist governments’ balance sheets in such horrible shape.
The selling is hitting the bond market from virtually every angle. Overseas investors in our bond market, our creditors, are getting out as fast as they can. According to latest data, they dumped a net $403 billion in U.S. Treasuries over the past 12 months.
Second, bond investors no longer believe central banks can contain the interest rate rise. They’re right. No matter what the Fed says or does, it will not be able to control the actions of tens of millions of investors. Or the actions of the free market.
When the free market forces take over and decide that U.S. bond markets are no longer a safe place to invest, as they are doing now, it’s lights out for Treasuries.
Third, and part and parcel of the interest rate rise, is the loss of confidence and wealth investors are now experiencing in sovereign bonds. That’s the ultimate motivation for dumping bonds.
Fourth, they’re worried — rightfully so — that President-elect Trump is going to hammer trade concessions from our big trading partners who are also our biggest creditors: Germany, the European Union in general, Japan and of course, China.
Fifth, and even more worried, are precisely our largest creditor nations. The EU, Japan and China. They know darn well Trump is going to squeeze them and renegotiate our debt. So the treasuries and central banks of those countries are likely already dumping our bonds.
I for one, am overjoyed bonds are crashing
and interest rates are rising.
Not because I might be able to earn more interest on idle cash. But because of the significance of crashing sovereign bond prices.
I have pounded my fist on the table about this all year. It should be music to your ears because …
A. It means trillions of dollars will be on the move, shifting mainly out of sovereign bonds and into U.S. equities, and lighting the force behind my Dow Industrials 31,000 plus forecasts for the next two years.
B. It also means that money and credit will start to move again in the general U.S. economy, that its velocity of turnover will improve, its heartbeat, bumping inflation a tad higher.
Not hyperinflation, just old fashioned rising inflation of, say, 3 percent maximum.
And how important is that? For investors, it’s critical.
It means further increases in the major stock indices. That I’ve made abundantly clear, several times. Even a tiny boost in inflation right now is a positive for stocks.
It means a rebirth of the commodity SuperCycle. It was never dead to begin with. It merely took a long pause.
But now, with the bond market tanking and the cost of money and credit rising, causing inflation to rise, we should soon see some major strength in the entire commodity sector, which is great news for tangible asset investors.
Not to mention …
It means a rebirth of gold’s great bull market. Mind you, inflation is one of the least dependable and weakest forces to drive a bull market in gold.
The far more bullish force for gold is the loss of confidence that both small investors and big money have in government.
And that in turn is reflected in how aggressively they are dumping sovereign debt issues, and heading for safer hills.
Right now, that’s mostly into equities.
But soon that tsunami of cash leaving sovereign bond markets will also be flooding back into tangible assets, and largely into gold.
So I implore you to keep the longer-term in perspective: Commodities and stocks are going to explode higher in the months and years ahead, and they are going to do it at the same time.
Best wishes, and have a wonderful holiday!

Larry
P.S. Time to pack your “bug-out bag” and run? Or would you rather get rich? Well, some people have built a little cabin in the woods. They’ve stocked it with food, guns, and ammunition. They call it a “bolt hole.” You know what? It’s not such a bad idea! But it’s not for everyone.
I’ve got a better way to protect myself. And you do, too. The answer is to get rich. Rich enough to weather the storm and keep your assets out of danger. The best defense, in other words, is a good offense. And guess what? The K Wave itself will give you the perfect way to do that. -Make sure to click here to download my new free report Stock Market Tsunami!

 Dear Friend of GATA and Gold:
The more it exposes and documents manipulation of the monetary metals markets by governments, central banks, and their agents in the financial industry, the more GATA is resented by those in the monetary metals industry who are merely touters of mining shares.
That’s because GATA tells people what they are up against when they invest in the monetary metals — indeed, when they aspire to free and transparent markets and to liberty itself. So while there was a victory for GATA in this month’s disgorgement in federal court in New York of Deutsche Bank’s electronic records of market rigging by its traders and the traders of other banks, on the whole the revelations may have been a defeat for the mining industry.
Toronto market analyst and broker Michael Ballanger explained why in his financial letter this week:
https://www.streetwisereports.com/pub/na/twas-the-week-before-christmas
Ballanger wrote: “Until the regulators can finally put an end to this horrific process whereby the bullion banks have a total carte blanche to issue as many [futures] contracts as they desire under the guise of ‘hedging,’ prospective gold investors are simply going to say, ‘Nope, not playing.’ The intervention, collusion, and bank-coordinated gang attacks such as we are now witnessing via the Deutsche Bank evidence coming out is actually having a negative effect on sentiment, because as much as the revelations are creating transparency, they are also scaring prospective investors. The prevailing wisdom emanating from the trading desks is: ‘Wow! If they can get away with that, why would anyone put money into the gold and silver markets?”
The Deutsche Bank disgorgement has incriminated not just Deutsche Bank itself but all the recent participants of the daily London gold and silver price “fixings” — HSBC, Bank of Nova Scotia, UBS, Barclays, and Societe Generale. But apparently none of them is reported to be under investigation by government law-enforcement agencies for rigging the gold and silver markets. Indeed, three years ago the U.S. Commodity Futures Trading Commission announced that it had closed a five-year investigation of the silver market without finding any cause for an enforcement action:
http://www.cftc.gov/PressRoom/PressReleases/pr6709-13
While the CFTC has subpoena power and dozens of investigators, it apparently was unable to discover what the anti-trust class-action lawsuit in New York did.
It is not hard to understand why the CFTC might have failed — or, rather, why it might not have tried very hard. That is, all the trading bank defendants in the gold and silver lawsuits are also primary dealers in U.S. government securities, the most intimate associates of the Federal Reserve Bank of New York.
This is unlikely to be a mere coincidence.
According to the New York Fed —
https://www.newyorkfed.org/markets/primarydealers
— “Primary dealers are trading counterparties of the New York Fed in its implementation of monetary policy. They are also expected to make markets for the New York Fed on behalf of its official accountholders as needed, and to bid on a pro-rata basis in all Treasury auctions at reasonably competitive prices.”
Gold and silver are money, and as GATA’s documentation has shown, governments still treat them as such and they remain of great interest to “monetary policy,” which is not to let them compete effectively with government-issued money. Governments and central banks can’t be much bothered by their primary dealers pushing gold and silver prices around as long as the primary dealers are pushing those prices where governments and central banks want them to go and providing camouflage for government and central bank intervention.
But if that explains the failure of governments to prosecute the gold and silver market riggers, what explains the silence of the monetary metals mining industry and its nominal representatives, like the World Gold Council, even after Deutsche Bank’s disgorgement? Enough clamor and exposure would compel governments and central banks either to stop rigging the monetary metals markets or at least to do it in the open, which soon would destroy the rigging’s effectiveness, as doing it in the open destroyed the London Gold Pool in 1968:
https://en.wikipedia.org/wiki/London_Gold_Pool
Yet mining companies and the World Gold Council act as if they are owned by the governments destroying them. The mining companies do not act as if they understand the monetary nature of their products or their own function as minters of independent money for free people.
The mining industry’s failure to defend itself against predators goes even beyond this. The industry doesn’t defend individual companies being systematically victimized.
As Rudi P. Fronk, chairman and chief executive officer of Seabridge Gold, a company that long has supported GATA, writes today:
“I don’t know if you have been following the recent trading activity in Seabridge, but last week the company got caught up in a significant rebalancing of the exchange-traded fund GDXJ that occurred Friday with more than 2.17 million shares sold as a block at the close. Going into last week, GDXJ owned just over 6 million common shares of Seabridge, or approximately 12 percent of our shares outstanding. The fund ended the week owning only 3.7 million shares (7 percent of Seabridge), having sold more than 2.3 million shares of the company during a tough week for gold.
“Unfortunately we do not get any notice of the extent of these rebalancings and learn about them only after the fact. But it is clear to me that someone knows ahead of time about the rebalancings, as we get shorted days before the block crosses with the shorters knowing that they will be able to cover at a low price with the end-of-week block.
“This has happened to us before, and while such events usually make great entry points for new buyers, current shareholders get screwed.”
The mining industry should have an association to clamor against such mistreatment as well. But where is it? The World Gold Council seems to function mainly to divert into mere derivatives investment funds intended for real metal and to ensure that there never is a world gold council.
So what can be done by investors in the monetary metals and by advocates of free and transparent markets and limited and accountable government?
Plenty can be done, once you realize that, powerful as the other side is, exercising all the power of government, its most powerful weapon is your own demoralization.
For starters people can challenge the gold and silver companies in which they are invested, insisting that company executives review the documentation of surreptitious intervention in the gold and silver markets by central banks and take a position on it:
http://www.gata.org/node/14839
Is the documentation genuine and valid or forged or misconstrued? If the mining industry protested about it to its elected representatives in government, it would make serious trouble.
Second, people can query their elected representatives about the market rigging — urging them to review and investigate the documentation as well and to question treasury and central bank officials about it. Are governments surreptitiously trading the gold market and, if so, for what purpose? Then any responses or refusals to respond should be publicized.
The same questions should be directed to financial regulators too and their answers publicized — particularly the U.S. Commodity Futures Trading Commission, whose failure to crack the silver case is now a spectacular embarrassment.
Sensational as the revelations in the Deutsche Bank case have been, the case has a long way to go before resolution. It likely will prompt more lawsuits against more trading banks, but maybe not until the current case is resolved. No one should wait for that.
And of course since apart from the lawsuit in New York only GATA seems to be doing anything about this fraud, people can support us financially:
Even a $5 donation will be more than Newmont Mining has contributed to the cause.
The logic of the use of derivatives to suppress monetary metals prices is that there is enormous potential for prices to explode if the rigging stops and the physical market defeats the paper market. But as long as investors are ready to accept mere certificates from bullion banks in place of real metal, and governments, central banks, and their agents are ready to issue paper for infinite amounts of imaginary gold, the market rigging can go on forever.
As with everything else in the world, it’s entirely a question of whether people can ever bring themselves to act.
CHRIS POWELL, Secretary/Treasurer
Gold Anti-Trust Action Committee Inc.
CPowell@GATA.org
* * *
Help keep GATA going
GATA is a civil rights and educational organization based in the United States and tax-exempt under the U.S. Internal Revenue Code. Its e-mail dispatches are free, and you can subscribe at:
To contribute to GATA, please visit:

Back in March 2008, as the Credit Crunch was biting, the US Dollar, as measured by the US Dollar Index (USDX), was bottoming after a drop of over six years fuelled by the War on Terror. Silver had previous topped out at about $21 and was later to visit $50 as the dollar faced the abyss again just above the 70 level. To date, that level has been the all time low for the USDX.

Looking at the 45 year chart for the USDX, it is clear the dollar has been on a downward trajectory interspersed with some rallies since 1985. As of 2008, the dollar has been in an 8 year rally. It is no coincidence that gold and silver have struggled during this time and precious metal investors will be wondering when the dollar will resume its 31 year bear?
While writing for subscribers on the US Dollar, another look at the USDX chart suggested that the dollar bull was beginning to outstay its welcome. Lines have been drawn between each high and low to highlight each dollar bull and bear.

Let us tabulate these ups and downs below. As you can see, the USDX has experienced three bulls and three bears since 1971. What is interesting are the similarities in durations ranging from six year and four months to eight years and ten months. The average is 2798 days or seven years and eight months.
|
BEGIN |
END |
DURATION |
MOVE |
|
4th Jan 1971 |
31st Oct 1978 |
7Y 9M 28D (2858d) |
-32% |
|
31st Oct 1978 |
28th Feb 1985 |
6Y 4M 1D (2313d) |
+100% |
|
28th Feb 1985 |
30th Sep 1992 |
7Y 7M 3D (2772d) |
-47% |
|
30th Sep 1992 |
31st Jul 2001 |
8Y 10M 2D (3227d) |
+56% |
|
31st Jul 2001 |
31st Mar 2008 |
6Y 8M 1D (2436d) |
-42% |
|
31st Mar 2008 |
16th Dec 2016 |
8Y 8M 17D (3183d) |
+44% |
As this current dollar bull stands, it is now been on the go for eight years and eight months, which is one year above the average and two months off the longest ever bull. In other words, I would say this dollar bull is getting long in the tooth and will soon be replaced by a dollar bear which will run for an average of seven years and eight months.
What are silver and gold going to be doing during this approaching dollar bear? I would say the odds favour them heading strongly up within that time period.
What are the fundamentals of this cyclical prediction? I don’t know and I have no idea why the dollar should flit in and out of these 6-8 year cycles. But as for the next dollar bear, my bet is that a Trump administration is going to indulge in a dollar depreciation program that is not based on welfare or warfare, but rather heavy infrastructure spending which I shall call wall-fare in honour of that long structure he plans for the Mexican border.
…related: US Dollar & Gold
A free sample copy of our our silver blog at http://silveranalyst.blogspot.com can be obtained by emailing silveranalysis@yahoo.co.uk.

A learned blockhead is a greater blockhead than an ignorant one.
Benjamin Franklin
Since the markets bottomed in 2009, one naysayer after another has penned many an obituary for this market. Alas, all those obituaries were based on fantasy and false perceptions; the bull is alive and kicking while many of those experts are either bankrupt or have bankrupted their clients several times over. We repeatedly stated over the years that the era of low interest fostered an environment that favoured speculation over hard work. This is why so may companies have opted to be boosts EPS via share buyback programs. Why work, when through the magic of accounting you can create the impression of growth when there is none. All is well, and when it ends, only the workers and the masses will lose for the corporate wenches will walk away with bloated accounts.
Despite the latest rate hike and the insane ramblings from the Fed that they are ready to raise rates more aggressively; yes we heard this last time and for over one year nothing happened. The reality is the economy is sick and only appears to be thriving because of the hot money that is being funnelled into the markets. This helps foster the illusion all is well when in reality everything is falling apart. Hence, while the Fed talks big, its bite will be weak. We could go on providing more reasons as to why the economy is weak such as the fake unemployment data the BLS tries to get the masses to swallow, but all of this is irrelevant. The trend of hot money is in play, and until the supply of hot money is cut, this bull market will continue to trend higher. This market will not trend higher forever; it will eventually run into a solid brick wall. There is no point of fixating on what will happen one day when its far more profitable to focus on the now.
The three charts below illustrate why this bull market still has legs
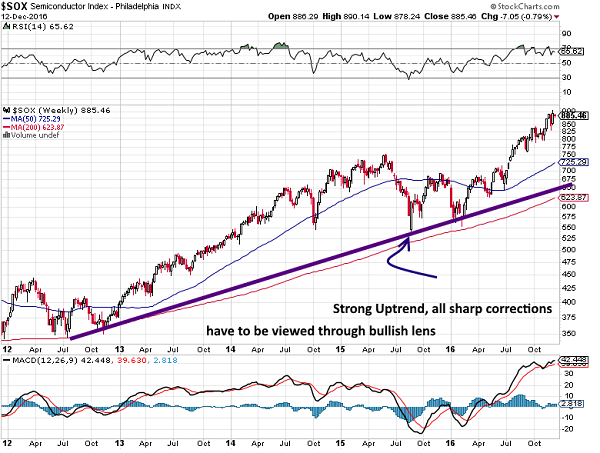
The semiconductor sector needs to be in a strong uptrend for a market to rally on a prolonged basis. A quick look at the above chart (semiconductor index) shows that the index is an in a very strong uptrend. It is trading above its main uptrend line and has continued to trade to new highs over the past five years. It could drop all the way to 650,and the outlook would remain bullish.
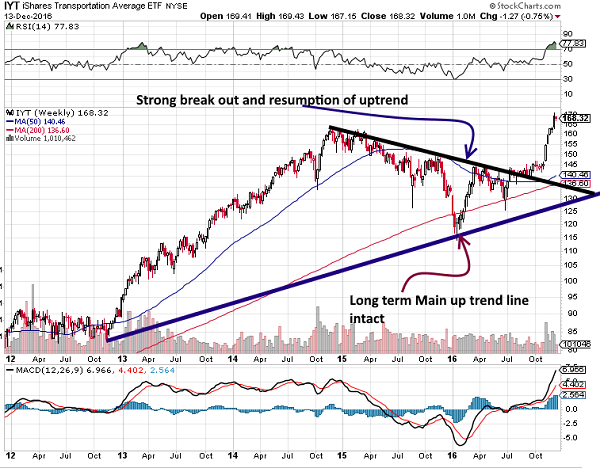
IYT (an ETF that mimics the Transports), is trending upwards again after experiencing a nice cleansing correction. A monthly close above 165 will pave the way for a test of the 195-205 ranges.
Finally, as we stated in the alternative Dow theory, the Utilities appear to be getting ready to trend higher.

As they are coming out of a correction, they are likely to play around the 625-640 ranges for a bit before breaking out. The utilities lead the way up, so a breakout to new highs should be watched closely. If they break out to new highs, it would indicate that after a correction that could range from mild to strong, the Dow industrials should follow the same path.
Conclusion
The Drs of doom will continue to chant the same monotonous and agonisingly painful song of death, instead of the markets collapsing they will be handed their heads on a platter again. If you had listened to these fools that masquerade as experts, you would have bankrupted yourself several times over. This bull market will end but that day is not upon us yet. The supply of hot money needs to be eliminated, and more importantly, the masses have to embrace this bull market. Over the short term, the markets have gotten slightly ahead of themselves and so some bloodletting probably next year would not surprise us. However, a correction and a crash are not the same things, something the Naysayers have a hard time recognising or coming to terms with. When the markets start to pull back again, they will feel emboldened and crawl out of the woodwork screaming the same rubbish they always do. Don’t listen to them; we can even provide a small preview of what will happen.
The lower the markets pull back, the more courageous these fools will become; they will start to spew ridiculous targets, and the masses will buy into this rubbish as they always do. Remember it takes one to cry, two to tango and three to have a party; just when it looks like the naysayers are going to be vindicated the markets will bottom and reverse course. These poor fools will then have the sharp displeasure of watching all their profits vanish into thin air. Let’s think about it if they followed their advice they would have lost all their money several times over. Hence, they are not following their advice; they are singing a false song of misery but apparently not putting their money into the game. The truth is not always to spot, but when you spot, it should set you free. Those that think it hurts are living in a world of denial as they still cling to the old ways hoping that like a broken clock they might have the chance to be right. The trend is your friend and rubbish is your foe; trend wisely.
Have the courage to be ignorant of a great number of things, in order to avoid the calamity of being ignorant of everything. Sydney Smith
To be a legitimate market sector, you must have a benchmark to measure what qualifies as under- and over-performance.
A large debate that has grown in investing circles during recent decades is the ability for professional investors to provide “alpha” rather than simply “beta.” That they are adding value rather than just collecting the value provided by the broad market or a specific sector. Legitimate market sectors draw investors and those investors are being asked to prove their value not only versus the broad market but versus the particular sector or strategy group they are involved in.
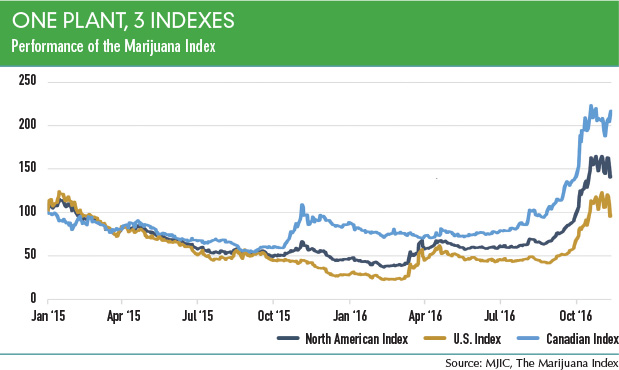
So, if an emerging industry is going to attract professional investors, it will be asked to measure its performance versus a benchmark. The Marijuana Index, which is owned by MJIC, tracks the performance of the legal marijuana industry. This includes companies that directly handle legal marijuana, such as marijuana producers, processors, distributors and retailers. It also includes companies that don’t directly handle plant product, but cater to those who do, as well as to consumers. These “ancillary” businesses operate in a wide range of industries such as consumption devices, product packaging, information technology, equipment, business services and more, says Dan Nicholls, vice president at The Marijuana Index. “Our definition of marijuana includes all forms and applications of the marijuana, cannabis and hemp plant, including cannabinoids such as CBD or THC,” says Nicholls, adding that it does not, however, include activities related to synthetic cannabinoids.
MJIC breaks down the Marijuana Index into three indexes: The North American Index, American Index and Canadian Index (see “One plant, 3 indexes,” below). Currently there are 23 stocks in the overall index, 13 American and 10 Canadian (see “The roster,” below). MJIC recently reconfigured the index based on specific criteria. “The start of this year we revamped the index, putting in place strict eligibility criteria,” Nicholls says.
….much more analysis and charts HERE
…related, Mark Leibovit was in on Marijuana at the very bottom and recently took “Monster Profits”:

-
I know Mike is a very solid investor and respect his opinions very much. So if he says pay attention to this or that - I will.
~ Dale G.
-
I've started managing my own investments so view Michael's site as a one-stop shop from which to get information and perspectives.
~ Dave E.
-
Michael offers easy reading, honest, common sense information that anyone can use in a practical manner.
~ der_al.
-
A sane voice in a scrambled investment world.
~ Ed R.
Inside Edge Pro Contributors

Greg Weldon

Josef Schachter

Tyler Bollhorn

Ryan Irvine

Paul Beattie

Martin Straith

Patrick Ceresna

Mark Leibovit

James Thorne

Victor Adair