
Gold & Precious Metals

 In 2012 I wrote a book called “The Coming Bond Market Collapse”, in that book I predicted that the bond market would begin to collapse by the end of 2016. Clearly, this prediction has started to come true. However, in all candor, I never dreamed that the Ten-year Treasury yield would plummet to 1.3%. Neither did I ever imagine that over thirteen trillion dollars’ worth of global sovereign bonds would have a negative yield, as was the case this past summer.
The Book’s assumption was that the bursting of the bond bubble would be caused by a change in global central banks’ monetary policy or through the eventual achievement of their inflation targets. At this juncture-at least in the U.S. — we have both. The Ten-year Treasury note has risen 80% since July based on both the return of inflation and the Fed’s desire to raise interest rates.
This begs the question: how high could interest rates climb and what is the interest rate that will break the Trump rally’s back?
Back in 2007, before anyone knew what the phrase Quantitative Easing meant, nominal GDP was around 5%, our National Debt was $5.1 trillion (64% of GDP) and the Ten- year was 5% — there is a strong correlation between nominal GDP and the 10-year note. Therefore, without any central bank-manipulation of long-term interest rates, it would be logical to conclude that the rate would rise back towards the 5% level as long as Mr. Trump can produce real growth of 3% and inflation around 2%. But, given today’s $20 trillion of National Debt, which is north of 105% of GDP, and the condition of soaring annual deficits, it would be prudent for bond investors to require an even higher yield than 5%.
The U.S. budget deficit has started to rise due to unfavorable demographics and an economy that is already suffering from a debt-disabled condition. The deficit for fiscal 2016, at $587 billion, was 34% higher than 2015. And the projected fiscal deficit for 2017 is $616 billion dollars, but that is before we factor in the new administration’s tax cut and spending plans.
The Committee for a Responsible Federal Budget (an independent organization) estimates that Trump’s tax plan will add 4.5 trillion dollars to the deficit over the next ten years. That could add an additional $450 billion to the annual red ink.
Adding to this we have borrowing costs on the rise. For every 25 basis point increase in rates, there is a $50 billion addition to the deficit. Given that the National Debt was financed at an average rate of 2.21% last year, the current increase in yields experienced already could add an additional $50 billion to the interest expense. In fact, the Congressional Budget Office sees the annual tab for interest on the debt doubling between now and 2020. Then we have Donald Trump’s massive one trillion-dollar, ten-year infrastructure plan.
Therefore, assuming much of Trump’s fiscal plans get passed in the first 100 days in office, the back-of-the-envelope estimate for 2017 would be: $616 billion baseline deficit, add $450 billion for tax cuts, at least $50 billion for additional interest and another $100 billion for infrastructure/defense spending. You don’t need a master’s degree in math to conclude that deficits could increase to well over one trillion dollars rather early in his administration.
But that’s not all; we have another risk that could add to the deficit. The current business cycle has been the longest economic expansion since WWII. The average expansion is 38 months, and the current one is already 90 months in duration. Therefore, a recession sometime in 2017 is more than overdue.
If we did enter an economic contraction next year deficits could explode by an additional $1.2 trillion; just as they did during the Great Recession of 2009.
With deficits more than likely north of $1 trillion dollars — or north of $2 trillion dollars if we enter into a recession — there could be a massive and record supply of debt issuance that will put enormous upward pressure on yields.
Adding to this dynamic is the waning demand for U.S. debt from China.
Data from the Treasury shows that China, the largest owner of US government debt, has cut its holdings every month between May and September of this year. And this was before the infamous phone call from Taiwan’s Prime Minister to the President Elect and any Twitter war Trump may start with China. In fact, in May alone the Peoples Bank of China sold a net $87 billion dollars in Treasury debt.
Therefore, not only is the Fed threatening to resume its tightening cycle come December 24th, but the bond market will have to absorb China’s liquidation of its stash of Treasuries as well.
In fact, the only condition still preventing the bond market from an immediate implosion is the QE coming from the European Central Bank (ECB) and the Bank of Japan (BOJ). However, the ECB has just indicated that it will reduce its bond purchases starting March 2017. And In Japan, Hakubun Shimomura, a senior member of the ruling Liberal Democratic Party said recently, “If the yen weakens too much, import prices go up. I hope the yen doesn’t get much cheaper than its current level.”
But the bottom line is there’s no way the current total of QE coming from the ECB and BOJ can offset the awakening from the 35-year old comma of bond vigilantes. Once they decide the $100 trillion global market is a sell…the game is over.
As the ten-year yield approaches 3%, which is more than double the rate seen just five months ago, all forms of fixed income, along with their proxies, will come under extreme pressure. This means; corporate debt, municipal bonds, REITs, CLOs, student and auto loan securities, bond funds, the real estate market, all dollar-denominated foreign debt and equities will fall concurrently along with the global economy. All this should occur while the multi-hundred trillion dollar interest rate derivative market gets blown to smithereens.
Simplifying the tax code and reducing regulations are necessary steps in restoring America to greatness. But by no means will Trump’s economic plans offset the bursting of an epic bond bubble that was 35 years in the making. Nor will protectionist trade policies and massive deficit spending rectify the economic imbalances manifest from 8 years’ worth of artificial credit offered for free.
The earnings yield on the S&P 500 is falling just as the yield on the 10-year is rapidly rising. Therefore, equity risk premiums are inexorably dropping towards the flat line. A 3% Ten-year Note yield may be enough to blow the whole economic bubble sky high.

An investment reality is that neither bear nor bull markets last forever. From high, July 2014, to low, October 2016, the Agri-Food Price Index fell 23%. Since that low, this index of 18 Agri-Commodity prices has risen 19%, and is nearing a new 52-week high. If we accept the popular notion that a 20% rise from a low signals a new bull market, Agri-Commodity prices may be birthing a new bull market. Chart below is for Agri-Food Price Index over the past year.
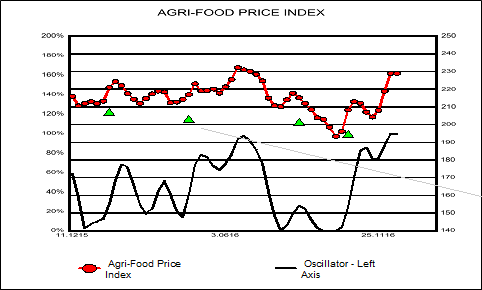
Above chart is not the only observable hoof print of perhaps a new Agri-Commodity bull market emerging. In chart below is plotted the year-to-year percentage change for Agri-Food Price Index. Recently, that measure moved sharply higher into positive territory. That condition has not existed since beginning of 2015, when price index was basically moving down. This momentum measure is good picture of developing strength in Agri-Commodity prices.

In chart below percentage gains from 52-week lows for each of 18 Agri-Commodity prices are portrayed. While range is fairly large, average gain from lows is 31%. Thus far, 8 Agri-Commodities, or 44%, have gains in excess of 20%. As harvests in general have been good this year, demand has been source of energy for prices. For example, number three in chart is dollar price of Malaysian palm oil, which seems to have ignored forecasters most of the year. Palm oil is the most important vegetable oil to global consumers, especially in Asia. Consumer demand for this oil has been strong, pushing dollar prices up more than 30%, and Malaysian prices to multi year highs.


At heart of this price performance is demand, a topic largely ignored by many commodity traders. In chart to right, using USDA global estimates for wheat, corn, and soybeans, red bars are growth rates for demand projected over two year period beginning with 2015 and ending with crop year 2017. Growth rates for supply for same period are in green. As is readily apparent, demand growth is faster than supply, a condition that is generally supportive of prices.
With volumes in Agri-Industries strong this year due to good harvests and a turn in pricing, Agri-Equities have been rewarding for investors. In our last chart below are plotted 2016 returns to date for Agri-Equities, S&P 500, and NASDAQ Composite. Winner is fairly obvious, and not actually surprising. Agri-Equities have returned nearly double that of the NASDAQ Composite. Also note that NASDAQ 100, home of popular tired, over owned, and over priced “growth” stocks, has also failed to be competitive with Agri-Equities.

Ned W. Schmidt,CFA is publisher of The Agri-Food Value View: www.agrifoodvalueview.com

By one measure, the Dow Industrials Index is now at its second-most ‘overbought’ level since 1980. The measure I’m referring to is the 14-day RSI (Relative Strength Index), a short-term momentum oscillator shown in the bottom section of the following Dow chart.
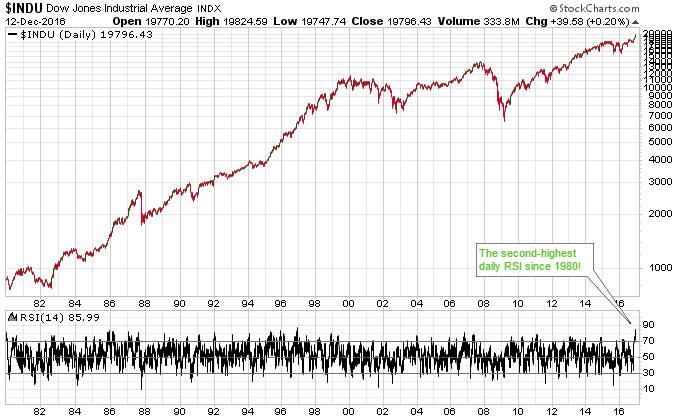
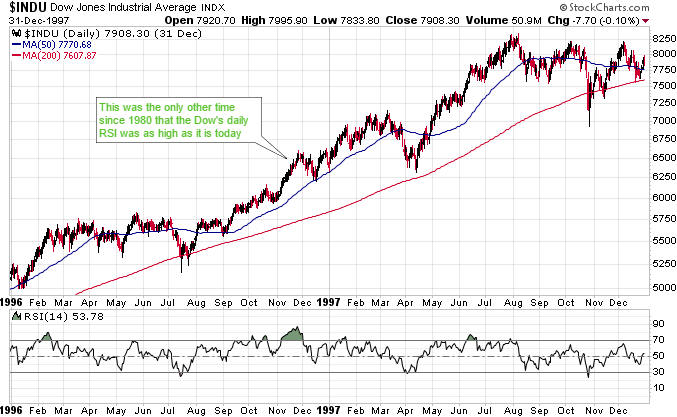
Being the most something-or-other (the most overbought/oversold, optimistic/pessimistic, etc.) since a distant past time often isn’t as important as it sounds. For instance, the only time since 1980 that the Dow’s daily RSI(14) was as high as it is today was in November of 1996 (interestingly, almost exactly 20 years ago), but nothing dramatic happened during the days, weeks or months that followed the November-1996 momentum extreme.
As illustrated below, a pullback to the 50-day moving average (MA) got underway within a few days of the momentum extreme, after which the Dow resumed its long-term advance. There was a more significant short-term pullback (to the 200-day MA) a few months later and an intermediate-term correction a few months after that (more than 8 months after the momentum extreme), but the bull market continued for another 3 years.
A short-term momentum extreme occurred at the price peak that was followed by the October-1987 stock market crash, but it is a lot more common for such extremes to be followed by nothing more serious than a routine multi-week correction. With measures of market breadth pointing to a 6-12 month extension of the bull market we probably won’t get anything more bearish than a routine multi-week correction within the next couple of months, although I admit that the near-vertical rally since the Presidential Election has me ‘on edge’.
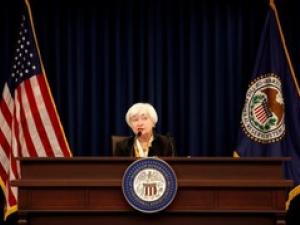 The U.S. Federal Reserve gets ready for the final monetary policy meeting of the year, and just like last year there is a high probability of a rate hike announcement. The U.S. Federal Reserve will publish the Federal Open Market Committee (FOMC) statement on Wednesday, Dec. 14 at 2:00 pm EST. Fed Chair Janet Yellen will then host a press conference where she will read a prepared statement and open the floor for questions from the financial press at 2:30 pm EST.
The Fed is expected to raise the benchmark funds rate by 25 basis points. The eyes of the market will be focused on the economic projections from the central bank to get some insights on next year’s policy moves.
The Bank of England (BoE) will release the Monetary Policy Summary on Thursday, Dec. 15 at 7:00 am EST. The central bank is expected to keep rates on hold with the majority if not all the votes in favor of keeping rates on hold. There is no press conference scheduled following the publication of the statement but the BoE releases the minutes of the meeting immediately after to offer transparency to markets.
The Euro/U.S. dollar (EUR/USD) currency pair tumbled 1.232% in the last week. The single currency is trading at 1.0541 after the European Central Bank (ECB) surprised markets with a reduction in the quantitative easing program, while at the same time extending the deadline until the end of the year and allowing the purchase of bonds with yields below the deposit rate. ECB President Mario Draghi was careful to avoid any comparison of the central bank’s move to be confused with “tapering” as it is slowing down the pace of bond purchases. The euro depreciated after the announcement and press release and is looking to the Fed to announce a 25 basis point hike to its benchmark rate on Dec. 14.
The ECB will face a difficult 2017 as the anti-Union movement across Europe has grown and triggered a surge in political risk. Elections in the Netherlands, France, Germany and Italy will all have a direct impact on the task at hand for the central bank. The ECB has enjoyed the backing of the Union during the worst times of the crisis, but now the European experiment is under threat complicating how fast and conclusive it can respond.
The EUR/USD could be heading toward parity if both the Fed and the ECB continue on a divergent path. The Fed underperformed against its own forecast at the beginning of the year as it has yet to deliver a single rate hike. Post election rallies in the United States have the dollar gaining traction with the promise of higher inflation as a result of new infrastructure projects that could keep the American central bank raising interest rates to keep up.
The Fed will deliver its economic projections on Wednesday and this is where the market will look for guidance into next year. There was plenty of optimism this time last year as the Fed had no way to know of the multiple setback that lay waiting the global economy, this time around after the United States itself has opened a can of political risk going into 2017 and a politically charged environment it remains to be seen if they will be more cautious in their predictions. Banks have been forecasting as many as six rate hikes if the growth rate and inflation expectations are met, while at the lower end a more conservative two could also feature if there are cuts to growth forecasts.

-
I know Mike is a very solid investor and respect his opinions very much. So if he says pay attention to this or that - I will.
~ Dale G.
-
I've started managing my own investments so view Michael's site as a one-stop shop from which to get information and perspectives.
~ Dave E.
-
Michael offers easy reading, honest, common sense information that anyone can use in a practical manner.
~ der_al.
-
A sane voice in a scrambled investment world.
~ Ed R.
Inside Edge Pro Contributors

Greg Weldon

Josef Schachter

Tyler Bollhorn

Ryan Irvine

Paul Beattie

Martin Straith

Patrick Ceresna

Mark Leibovit

James Thorne

Victor Adair