
Bonds & Interest Rates
In Elliott wave terms, bond investors have transitioned from extreme optimism to extreme pessimism
[Ed Note: The text version of the story is below.]
What a rout in the bond market in November (Bloomberg, Dec. 1):
Global Bonds Suffer Worst Monthly Meltdown as $1.7 Trillion Lost
The price of U.S. Treasuries nosedived as 10-year yields – a.k.a., interest rates, which move inversely to bond prices — saw their steepest climb since November 2009.
Bloomberg (Dec. 1) provides another perspective:
The 30-year-old bull market in bonds looks to be ending with a bang. The Bloomberg Barclays Global Aggregate Total Return Index lost 4 percent in November, the deepest slump since the gauge’s inception in 1990. Treasuries extended declines Dec. 1.
Elliott Wave International subscribers were prepared well ahead of time.
On June 17, well before the rout, The Elliott Wave Theorist showed this chart and said:
The 30-year Treasury bond made a new all-time high on June 16. The triangle is indicative of a fourth wave, making the recent thrust a fifth wave.
This wave count is terminal. Bonds are on their last leg.
But, at the time, most speculators disagreed. Even so, bond prices topped less than a month later. Said our U.S. Short Term Update on July 25:
The wave structure of the rally ended at the 177^11.0 high on July 11. Sentiment remains historically optimistic. The most recent tally of the Commitment of Traders data shows that Large Speculators (trend-followers) remains a tad off a 21-year record net long extreme in the percentage (of open interest) of bond futures and options contracts they hold. With Commercials taking the opposite side of this trade, the sentiment set up is in place for a continued bond price decline .
Despite the historic optimism, Treasury bond prices continued to decline.
This week, as of Dec. 1, the 30-year yield rose to as high as 3.15%. That’s a 51% climb since the July low of 2.085%.
In other words, in the short term, the market sentiment in bonds has transitioned from a highly elevated optimism four months ago to a deep pessimism we see this week. In fact, the 30-day bond Daily Sentiment Index (trade-futures.com), which our U.S. Short Term Update quotes quite often, is at its lowest level since September 2013 – a contrarian indicator.
Investor psychology could grow even more negative toward bonds. But, keep in mind that countertrend moves in financial markets usually occur when sentiment reaches an extreme like the one we’re seeing now.
Put differently, the 30-year Treasury bond’s price pattern is again looking highly interesting — although, again, in the opposite way most investors expect.

 All of the World’s Money and Markets in One Visualization
How much money exists in the world?
Strangely enough, there are multiple answers to this question, and the amount of money that exists changes depending on how we define it. The more abstract definition of money we use, the higher the number is.
In this data visualization of the world’s total money supply, we wanted to not only compare the different definitions of money, but to also show powerful context for this information. That’s why we’ve also added in recognizable benchmarks such as the wealth of the richest people in the world, the market capitalizations of the largest publicly-traded companies, the value of all stock markets, and the total of all global debt.
The end result is a hierarchy of information that ranges from some of the smallest markets (Bitcoin = $5 billion, Silver above-ground stock = $14 billion) to the world’s largest markets (Derivatives on a notional contract basis = somewhere in the range of $630 trillion to $1.2 quadrillion).
In between those benchmarks is the total of the world’s money, depending on how it is defined. This includes the global supply of all coinage and banknotes ($5 trillion), the above-ground gold supply ($7.8 trillion), the narrow money supply ($28.6 trillion), and the broad money supply ($80.9 trillion).
All figures are in the equivalent of US dollars.
About the Money Project
The Money Project acknowledges that the very concept of money itself is in flux – and it seeks to answer these questions.
The Money Project aims to use intuitive visualizations to explore ideas around the very concept of money itself. Founded in 2015 by Visual Capitalist and Texas Precious Metals, the Money Project will look at the evolving nature of money, and will try to answer the difficult questions that prevent us from truly understanding the role that money plays in finance, investments, and accumulating wealth.

ECB Chairman Mario Draghi’s announcement of bigger and better QE this morning should have surprised no one. The fact is that the eurozone is coming apart at the seams and the only tool left to delay the inevitable is easier money. As the following chart illustrates, the euro has been declining since 2008, with the descent accelerating lately.
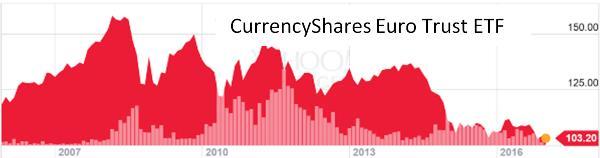
And more is coming. The only way for Italy, Greece and possibly France to keep it together is for their currency to plunge relative to those of their trading partners, thus making it easier to sell domestically-produced stuff abroad. So euro parity with the dollar will generate headlines when it happens but will just be a way-point on a journey to much lower numbers. That is, if the whole global financial system doesn’t blow up first.
What’s a European saver to do? Sitting on a euro-denominated bank account generated a 30% loss of real purchasing power during this “recovery,” which for the average European more than offset the trade benefits of a cheaper currency (hence the recent political turmoil). So going forward, cash is clearly not an attractive way to preserve capital.
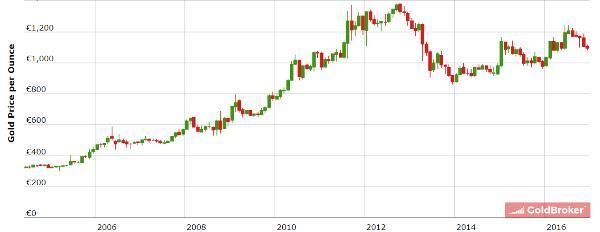
Gold, on the other hand, is made for this kind of situation. In the past decade it has more-or-less doubled in euro terms. The difference between a 30% loss and a 100% gain is not lost on the people living through it, so expect European gold demand to rise going forward.
Meanwhile, the same thing is happening in China, where the yuan has been falling steadily and is now at a multi-year low to the USD.
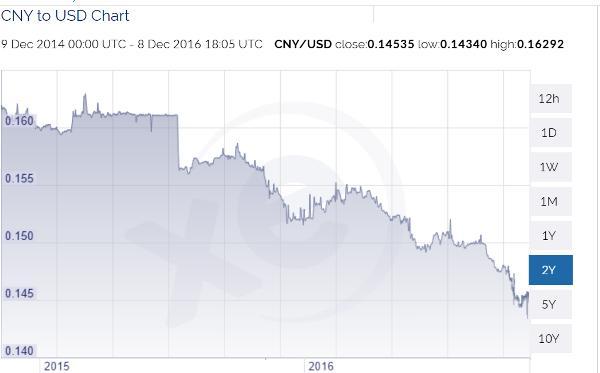
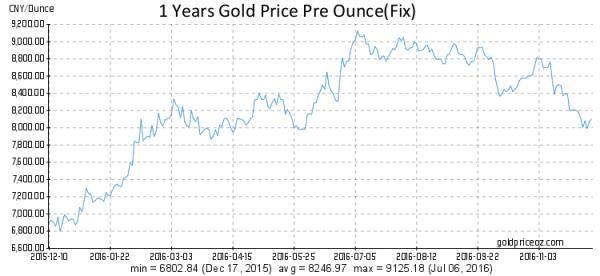
The difference is that many Chinese seemed to have understood what was coming and have for the past decade been loading up on gold. The result: currency devaluation actually improves the finances of large numbers of gold-owning citizens.
The difference is that many Chinese seemed to have understood what was coming and have for the past decade been loading up on gold. The result: currency devaluation actually improves the finances of large numbers of gold-owning citizens.
For Americans there are two lessons here:
1) Because we’re making the same mistakes as Europe and China – borrowing more than we can ever hope to pay off and papering the growing mess over with artificially-low interest rates and aggressive currency creation – the dollar won’t last long as the only major currency that’s appreciating. We’ll eventually be forced to devalue, which will take the currency war to a new and vastly more dangerous stage.
2) When the above happens gold will soar in dollar terms just as it is now rising in euro and yuan terms. So today’s US savers have a choice of role models: Will we be impoverished Europeans with shrinking bank accounts or enriched Chinese with ever-more-valuable stacks of gold?
….related: Euro swings to steep decline as ECB’s Draghi holds news conference

What to do if/when interest rates start rising? Buy an out-of-the- money put butterfly.
In 2008, the U.S. economy hit its roughest patch since the Great Depression nearly eighty years earlier. Only the inflationary spiral of the late 1970s followed by the sharp recession of the early 1980s can compete with it. In reaction to that inflation, the Federal Reserve, led by then newly appointed chairman Paul Volcker, raised the Fed Funds rate as high as 20% in March of 1980 and January of 1981. The Fed Funds Rate is the rate that depository institutions lend out to other depository institutions overnight, with funds that are maintained at the Fed. The higher the rate charged by the Fed the more painful it is to borrow. During inflationary times, when the rate is raised money turns over more slowly and inflation then cools off, or so goes the plan.
….related: Look what’s happening to Treasuries: Most Oversold in 43 Years
 Let’s say you have two equal size safety deposit boxes.
One box you completely fill up with stacks of $100 bills.
The other box you fill up with gold.
Which of the two is “worth” more?
It’s easy to calculate. A stack of 100x $100 bills is 6.14 inches long, 2.61 inches wide, and 0.43 inches tall.
That’s a volume of 6.89 cubic inches (112.92 cubic centimeters… and we’ll use the metric system from here on out because it really does make more sense!).
A stack of 100x $100 bills is worth $10,000. So the paper money’s ‘value density’ is about $88.55 per cubic centimeter.
Gold, on the other hand, is much more value dense.
A 1-kilogram bar of gold is 11.55 cm long, 5.25 cm wide, and 0.92 cm tall, for a total volume of 55.79 cubic centimeters.
As of this morning, gold is worth $37,811 per kilogram, meaning the value density of that 1kg bar is $1,278.75 per cubic centimeter.
So gold is clearly more value dense than paper money, i.e. you can store a LOT more value in the same amount of space with gold than you can with paper money.
What about silver?
A 1-kg silver bar measures 11.6 cm x 5.3 cm x 1.75 cm, for a total volume of 107.6 cubic centimeters; this is larger than the bar of gold due to its different chemical properties.
One kilogram of silver is currently worth $550. So the value density of silver is $5.11 per cubic centimeter– much lower than both gold and $100 bills.
I looked into a number of other currencies and assets.
500-euro notes, for example, currently have value density of $373.05 per cubic centimeter based on today’s exchange rates.
And the 1,000 Swiss franc note has value density of $827.14 per cubic centimeter.
Let’s look at fine wine: a bottle of 2005 Petrus sells for about $4,200; with a storage volume of 1,331 cubic centimeters, the wine’s value density is just $3.15.
The “5270G-018 Grand Complications” model of watch manufactured by Patek Philippe sells for about $145,000.
It measures 72 cubic centimeters in total volume, for a total value density of $2,013 per cubic centimeter.
200 rounds of 7.62mm ammunition in a bulk ammo can measures 4,014 cubic centimeters. At a cost of around $150, the ammo’s value density is about 3.7 cents.
August 1962 edition of the Amazing Fantasy comic book featuring Spiderman on the cover (and signed by Stan Lee) sells for nearly $38,000.
It’s a comic book, so it’s small, at just 345 cubic centimeters. So its value density is $110.14 per cubic centimeter.
Rare colored diamonds, as you can probably imagine, are extremely expensive. A tiny 0.11 carat “fancy vivid purplish pink” measures just 12.91 cubic millimeters, or .01291 cubic centimeters.
Most of the normal colorless or near-colorless diamonds that are sold in mass market jewelry stores are terrible investments. They’re not rare, and they’re overpriced.
But high quality colored diamonds can be extremely rare, and that scarcity drives the price much higher.
That’s why a tiny 0.11 carat colored diamond is currently listed at $10,573, making its value density a whopping $818,977.53 per cubic centimeter.
So let’s look at all of these assets in order of least to most value dense:
Value of assets in dollars per cubic centimeters:
Ammunition: $0.037
Fine wine: $3.15
1-kg Silver bar: $5.11
$100 bills: $88.55
Rare comic book: $110.14
500-euro notes: $373.05
1-kg Gold bar: $1,278.75
Luxury watch: $2,013
1,000 Swiss franc: $827.14
Colored diamonds: $818,977.53
Now, in my view, given the potential costs and challenges of the other assets, gold still remains the top choice.
Luxury watches may be more value dense than gold, but the marketplace is limited and the costs to sell are much higher.
There are gold dealers in just about every major city on the planet, so you’d be able sell a gold bar in no time at all, at very little cost.
Colored diamonds, luxury watches (and even comic books) could take much more time to sell, and you might need to pay steep commissions to close the deal.
Plus, the gold price is quoted worldwide, round-the-clock. There’s never any question about how much gold is worth.
The 1,000 Swiss franc note is more value dense than gold. And for now, Switzerland has resisted the calls to ban the note, as Europe has done with its 500-euro note.
But I wouldn’t expect that sensibility to last forever. Between the two, gold is likely safer from a regulatory perspective… and more universal.
But fortunately the decision doesn’t have to be mutually exclusive. You don’t need to choose between one and the other.
So if you’re going to fill up your safe, choose a variety of assets. You can start small– silver coins and $20 bills.
Now, there’s one asset here that I didn’t list. You might have thought of it already… it’s one that blows the rest away in terms of its value density.
I’m talking about cryptocurrency.
Bitcoin, for example, takes up precisely zero space. If you really wanted, you could memorize a string of digits and store millions of dollars in your head.
Even if you wanted to print out a 250-pixel QR code and keep it in your safe, it would take up a laughable amount of space, roughly 0.21 cubic centimeters– not much bigger than a tiny diamond.
Yet that same 250-pixel QR code could hold $1 worth of bitcoin… $100… $1,000… or even millions.
In other words, the value density is enormous.
Now, I’m not encouraging you to dump all of your savings in cryptocurrency– there are still plenty of growing pains ahead.
But it’s important to understand the many benefits of cryptocurrency… and value density is just one of them.
Until tomorrow,
Simon Black
Founder, SovereignMan.com
also from Simon: Incredible opportunities in a hidden corner of the world


-
I know Mike is a very solid investor and respect his opinions very much. So if he says pay attention to this or that - I will.
~ Dale G.
-
I've started managing my own investments so view Michael's site as a one-stop shop from which to get information and perspectives.
~ Dave E.
-
Michael offers easy reading, honest, common sense information that anyone can use in a practical manner.
~ der_al.
-
A sane voice in a scrambled investment world.
~ Ed R.
Inside Edge Pro Contributors

Greg Weldon

Josef Schachter

Tyler Bollhorn

Ryan Irvine

Paul Beattie

Martin Straith

Patrick Ceresna

Mark Leibovit

James Thorne

Victor Adair