
Real Estate
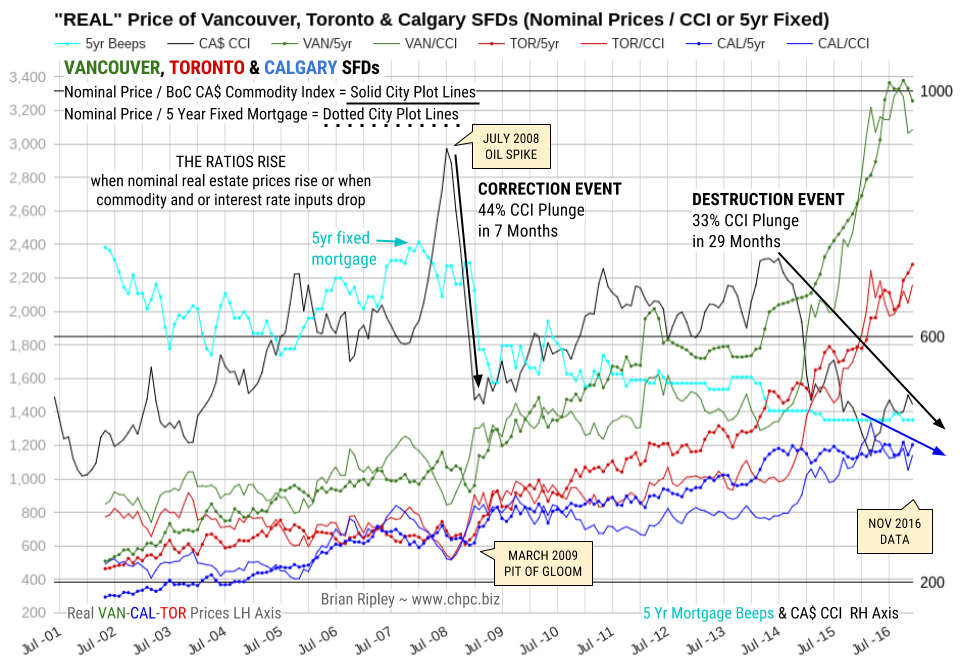
The chart above shows the “real price” of Vancouver, Toronto & Calgary SFDs when looked at from the point of view of the BoC Canadian Commodity Index (CCI) and Borrowing Costs (retail 5yr Mortgage) which are the main input costs apart from operating expenses and tax.

 “The hunt for taxes is getting pretty bad”
The European Payments Council (EPC), a subdivision of the European Central Bank, is taking one giant step forward in their quest to eliminate all cash to increase taxes. They have gone ahead and set up the technical bases last week to enable the immediate payments system throughout Europe. One of the stumbling blocks has been the fact you cannot transfer money same day for banks like to play with your money and holding it for a few days. If the payment comes from overseas, the bank will not “clear” the funds usually for six weeks.
Unless money can become instant, it is really impossible to eliminate cash. The SEPA Credit Transfer Scheme will move to allow instant transfers. The goal is to eliminate ATM machines and force people to pay using their mobile phone beginning in November 2017. Of course, there is nobody thinking about tourism. How will an American pay for something on a vacation in Europe? One suggestion behind the curtain I was recently briefed on was they could pay in advance and have an app that then pays for things in Europe.
The hunt for taxes is getting pretty bad. The entire reason for the introduction of passports was by the Roman Emperor Diocletian following the collapse during the 3rd Century. Diocletian introduced wage and price controls, and doubled the number of bureaucrats at the government’s command; Lactantius was to claim that there were now more men using tax money than there were paying it. A form of introducing a passport not to travel to foreign lands since civilization was the Roman Empire, but to be able to travel within the Empire because you could not leave your home town until you paid your taxes.
King Henry V of England (1387–1422) is credited with having invented what considered the first true international passport. The king saw this as helping his subjects prove who they were in foreign lands and not the subject of the king where they traveled. The reason for this 1414 Act of Parliament was legal. You were the property of your King. If you committed a crime in France, the French king could not punish you. He had to send you back to your king in chains noting the crime you committed and asked that you be punished by your king. This legal foundation of “jurisdiction” was not overthrown until the American Revolution, which gave birth to territorial jurisdiction. Since it was a revolt against monarchy, it was seen as implausible that if an Englishman committed a crime in America, that they would still recognize the authority of the king and send him in chains to Britain to be punished. This new idea of territorial jurisdiction is directly outlined in the 6th Amendment:
In all criminal prosecutions, the accused shall enjoy the right to a speedy and public trial, by an impartial jury of the State and district wherein the crime shall have been committed, which district shall have been previously ascertained by law, and to be informed of the nature and cause of the accusation; to be confronted with the witnesses against him; to have compulsory process for obtaining witnesses in his favor, and to have the Assistance of Counsel for his defence.
…..also:
Every Household in California Owes $93,000 to Pay for State Pensions


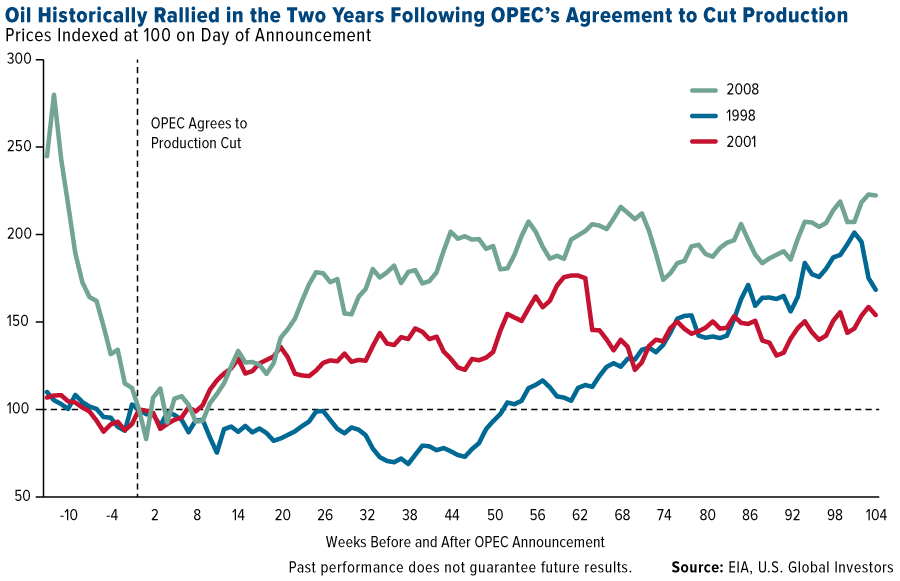
It finally happened. For the first time since 2008, the Organization of Petroleum Exporting Countries (OPEC) agreed to a crude oil production cut last week, renewing hope among producers and investors that prices can begin to recover in earnest after a protracted two-year slump, one of the worst in living memory.
The last three times the cartel agreed to trim output—in 2008, 2001 and 1998—oil rallied in the following weeks and months. Of course, there’s no guarantee the same will happen this time around, as other market forces are at play, but it’s helpful to look at the historical precedent.
OPEC’s decision follows a strong endorsement from Goldman Sachs, which upgraded its rating on basic materials to overweight for the first time in four years. Analysts see commodities gaining 9 percent on average over the next three months, 11 percent over the next six months.
As reported by TheStreet’s Paul Whitfield, Goldman’s change of heart was prompted by “the recent acceleration in global PMIs (purchasing managers’ indexes),” which “suggests commodity markets are entering a cyclically stronger environment.”
The JPMorgan Global Manufacturing PMI rose slightly in November to a 27-month high of 52.1, extending sector expansion for the sixth straight month—very encouraging news.

As I’ve shared with you many times before, our own research has shown a strong correlation between PMI performance and commodity prices three and six months out. I’m thrilled to see Wall Street and media outlets coming around to this realization as well.
In short, OPEC’s production cut is constructive for energy in the near term, while a rising PMI is good news for the long term.
$70 Oil Next Year?
Since oil collapsed in September 2014, as much as $4 billion have been wiped from oil workers’ wages in the U.S. alone, according to Bureau of Labor Statistics data. Countries that rely heavily on oil revenue—Venezuela, Colombia, Russia and Nigeria, notably—have had to stretch balance sheets. And for the first time in nearly 40 years, Alaska, where the oil industry accounts for half of all economic activity, is scheduled to impose an income tax by 2019.
Many analysts now find reason to be optimistic about a recovery in energy. Speaking to the Houston Chronicle, David Pursell of energy investment bank Tudor, Pickering, Holt & Co. predicts “2017 will be a better year for oil and gas activity than we anticipated.” Pursell sees crude possibly rallying above $70 a barrel sometime next year.
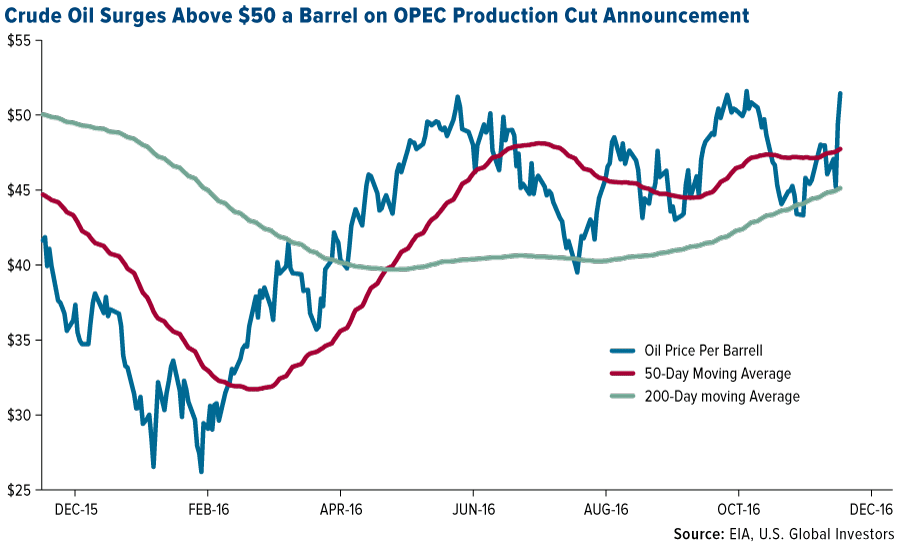
The OPEC deal, announced last Wednesday, aims to reduce production by 1.2 million barrels a day, or about 1 percent of global output. For comparison’s sake, the cartel, which controls a third of all oil production, agreed to a reduction of 2.2 million barrels a day in 2008. Although not an OPEC member, Russia has also agreed to trim production—by about 300,000 barrels a day—the first time it’s cooperated with OPEC since 2001.
Following the announcement, West Texas Intermediate (WTI) crude surged above $50 a barrel.
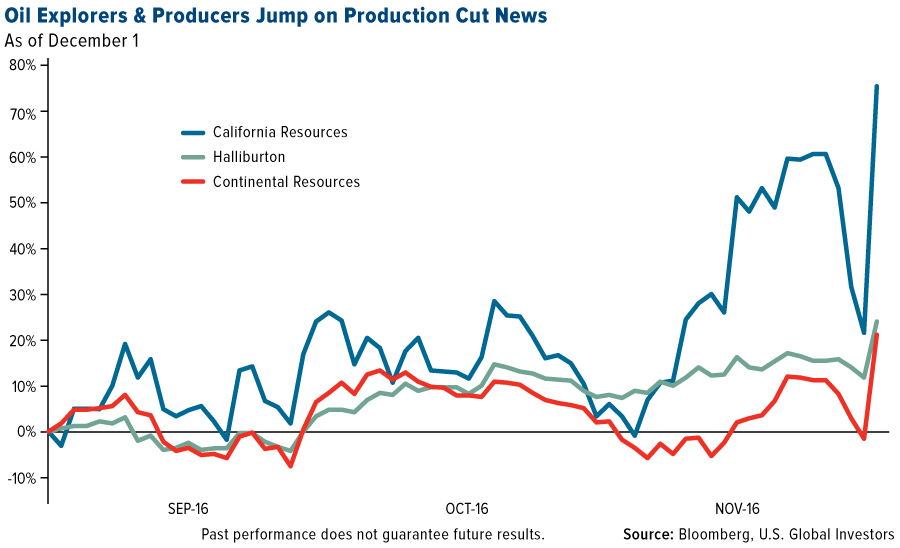
Meanwhile, investors piled into oil ETFs, with inflows into one surpassing $1 billion on Thursday alone. Shares of Halliburton, Continental Resources and California Resources all saw dramatic spikes.
The Challenges Ahead
Some investors are understandably cautious. OPEC doesn’t have the authority to enforce compliance from its 14 member-nations, and output has typically exceeded quotas.
What’s more, it’s likely U.S. shale producers, which today operate at lower costs compared to other players, will be first to take advantage of a bump in prices. Drilling activity is already accelerating. Since May, the number of active oil rigs in North America has climbed 50 percent to 474, as of November 23.

“U.S. oil production growth is all but guaranteed to return in 2017,” according to Joseph Triepke, founder of oil research firm Infill Thinking. Triepke adds that as many as 150 rigs could be reactivated next year in Texas’ Permian Basin alone.
It’s there, in the Wolfcamp formation of the Permian, that the United States Geological Survey (USGS) recently discovered 20 billion barrels of “technically recoverable” oil, the largest deposit ever to be found in the U.S. Bloomberg reports that the deposit is worth an estimated $900 billion at today’s prices.
On the demand side, higher prices could spell trouble in emerging countries whose currencies have weakened against the U.S. dollar in recent months, especially since Donald Trump won the presidential election. Because oil is priced in dollars, it’s become more expensive in China and India, the second and third largest oil consumers following the U.S.
Gold Looks Technically Oversold, Ready for a Price Reversal
As I often say, every asset class has its own DNA of volatility, which is measured by standard deviation. Specifically, standard deviation gauges the typical fluctuation of a security or asset class around its mean return over a period of time ranging from one day to 12 months or more.
This brings us to mean reversion, which is the theory that, although prices might trend up for some time (as in a bull market), or fall (as in a bear market), they tend to move back toward their historic averages eventually. Such elasticity is the basis for knowing when an asset is overbought or oversold—and when to sell or buy.
As you can see in the oscillator below, gold looks oversold right now and is nearing a “buy” signal, after which we can statistically expect it to return to its mean.
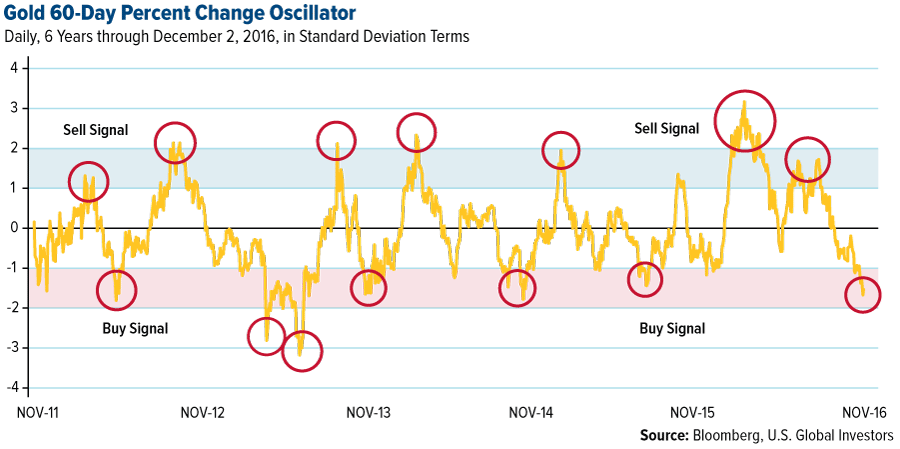
Gold’s current standard deviation for the 60-day period is about 7 percent—you can reasonably expect it to move this much over a two-month period, therefore, 68 percent of the time.
For more on standard deviation and mean reversion, I invite you to download my whitepaper, “Managing Expectations: Anticipate Before You Participate in the Market.”
The J.P. Morgan Global Purchasing Manager’s Index is an indicator of the economic health of the global manufacturing sector. The PMI index is based on five major indicators: new orders, inventory levels, production, supplier deliveries and the employment environment.
Standard deviation is a measure of the dispersion of a set of data from its mean. The more spread apart the data, the higher the deviation. Standard deviation is also known as historical volatility.
All opinions expressed and data provided are subject to change without notice. Some of these opinions may not be appropriate to every investor. By clicking the link(s) above, you will be directed to a third-party website(s). U.S. Global Investors does not endorse all information supplied by this/these website(s) and is not responsible for its/their content.
Holdings may change daily. Holdings are reported as of the most recent quarter-end. None of the securities mentioned in the article were held by any accounts managed by U.S. Global Investors as of 9/30/2016.

Trading position (short-term; our opinion): No positions are justified from the risk/reward perspective.
On Friday, crude oil gained 1.21% as OPEC deal continued to support the price of the commodity. In this environment, light crude re-approached the Oct high. Will we see fresh 2016 peak in the coming week?
Let’s take a look at the charts below to find out (charts courtesy of http://stockcharts.com).

On Friday, we wrote the following:
(…) With yesterday’s increase light crude broke not only above the barrier of $50, but also the red resistance line (based on the Aug and Sep lows), which triggered further improvement and a rally above the upper border of the blue rising trend channel. Despite this move, the black resistance line (based on the Feb and Aug lows) in combination with the proximity to the Oct high encouraged oil bears to act, which resulted in a pullback and a daily closure below both resistance lines.
Such price action means that light crude invalidated the breakout above upper line of the blue trend channel and suggests a verification of the breakdown under the black resistance line which doesn’t bode well for oil bulls. If this is the case, we may see a correction of recent rally and a drop to the previously-broken red line based on the Aug and Sep lows (currently around $50.15)
From today’s point of view, we see that the situation developed in line with the above scenario and crude oil moved lower after the market’s open, reaching our initial downside target. Despite this drop, the proximity to the barrier of $50 encouraged oil bulls to act, which resulted in a rebound and a comeback to the Thursday’s high.
As you see, with Friday’s increase, the commodity also moved above the previously-broken upper borer of the blue rising trend channel, invalidating earlier breakdown. Although this is a positive development, which suggests further improvement and a test of the Oct high, we should keep in mind that the medium-term black resistance line based on the Feb and Aug lows remains in play, keeping gains in check (as a reminder, as long as there is no daily closure above this line all upswings could be nothing more than a verification of earlier breakdown).
Additionally, this area is also reinforced by the long-term red resistance line (based on the previous peaks), which successfully stopped earlier rally in Oct.

On top of that, the size of volume that accompanied recent increases (since Wednesday) has steadily decreased, which suggests that the rally can go without steam and reversal in the coming days should not surprise us. If this is the case and we see a correction of the recent rally, the initial downside target would be the previously-broken red line based on the Aug and Sep lows, the Nov 22 high of $49.20 or even the 50-day moving average.
Summing up, crude oil bounced off the previously-broken red rising line and re-approached the Oct high. Despite this move, the medium-term black resistance line based on the Feb and Aug lows and the long-term red resistance line based on the previous peaks continue to keep gains in check, which means that as long as there won’t be a breakout above them further rally is not likely to be seen.
Very short-term outlook: mixed
Short-term outlook: mixed
MT outlook: mixed
LT outlook: mixed
Trading position (short-term; our opinion): No positions are justified from the risk/reward perspective.
Thank you.


-
I know Mike is a very solid investor and respect his opinions very much. So if he says pay attention to this or that - I will.
~ Dale G.
-
I've started managing my own investments so view Michael's site as a one-stop shop from which to get information and perspectives.
~ Dave E.
-
Michael offers easy reading, honest, common sense information that anyone can use in a practical manner.
~ der_al.
-
A sane voice in a scrambled investment world.
~ Ed R.
Inside Edge Pro Contributors

Greg Weldon

Josef Schachter

Tyler Bollhorn

Ryan Irvine

Paul Beattie

Martin Straith

Patrick Ceresna

Mark Leibovit

James Thorne

Victor Adair