Timing & trends

Cycles – A Fuse, An Explosive And The Igniting Catalyst

Investors need to focus on the two key long term structural changes now underway which are going to ignite destructive global dislocations through early 2020. To better understand why this is going to occur we need to place them in context by first examining the major economic cycles currently underway.

HARRY DENT’S MACROECONOMIC CYCLES & DEMOGRAPHICS

This initial cycle chart is from an in-depth discussion I had with Harry Dent earlier this year. Since leaving Harvard, Harry has spent most of his adult working life  studying demographics and cycles.

An ominous tell tale is that the four cycles he most closely follows are all presently headed down or flat!

10-17-16-MATA-RISK-Harry Dent

Dent attributes this to; the demographics of the baby boom generation, their spending habits as they enter retirement and the overall falling birth rates in the developed economies.

His work suggests the cycles don’t reverse until the early ’20’s.

MARTIN ARMSTRONG’S “ECONOMIC CONFIDENCE MODEL”

Another well respected cycles analyst is Martin Armstrong who I additionally interviewed to discuss his highly regarded Economic Confidence Model. This cycle is based on a very long cycle of human history and civilization. It currently shows, according to Armstrong (see below), that economic conditions have been deteriorating since 2015.75 (Sept 2015) and will persist through to the beginning of 2020 (2020.05).

….for more on Armstrong, Kondratieff and much more go HERE

…related:

Connecting the Dots


Big OPEC-ing deal!

opec4 reuters 4
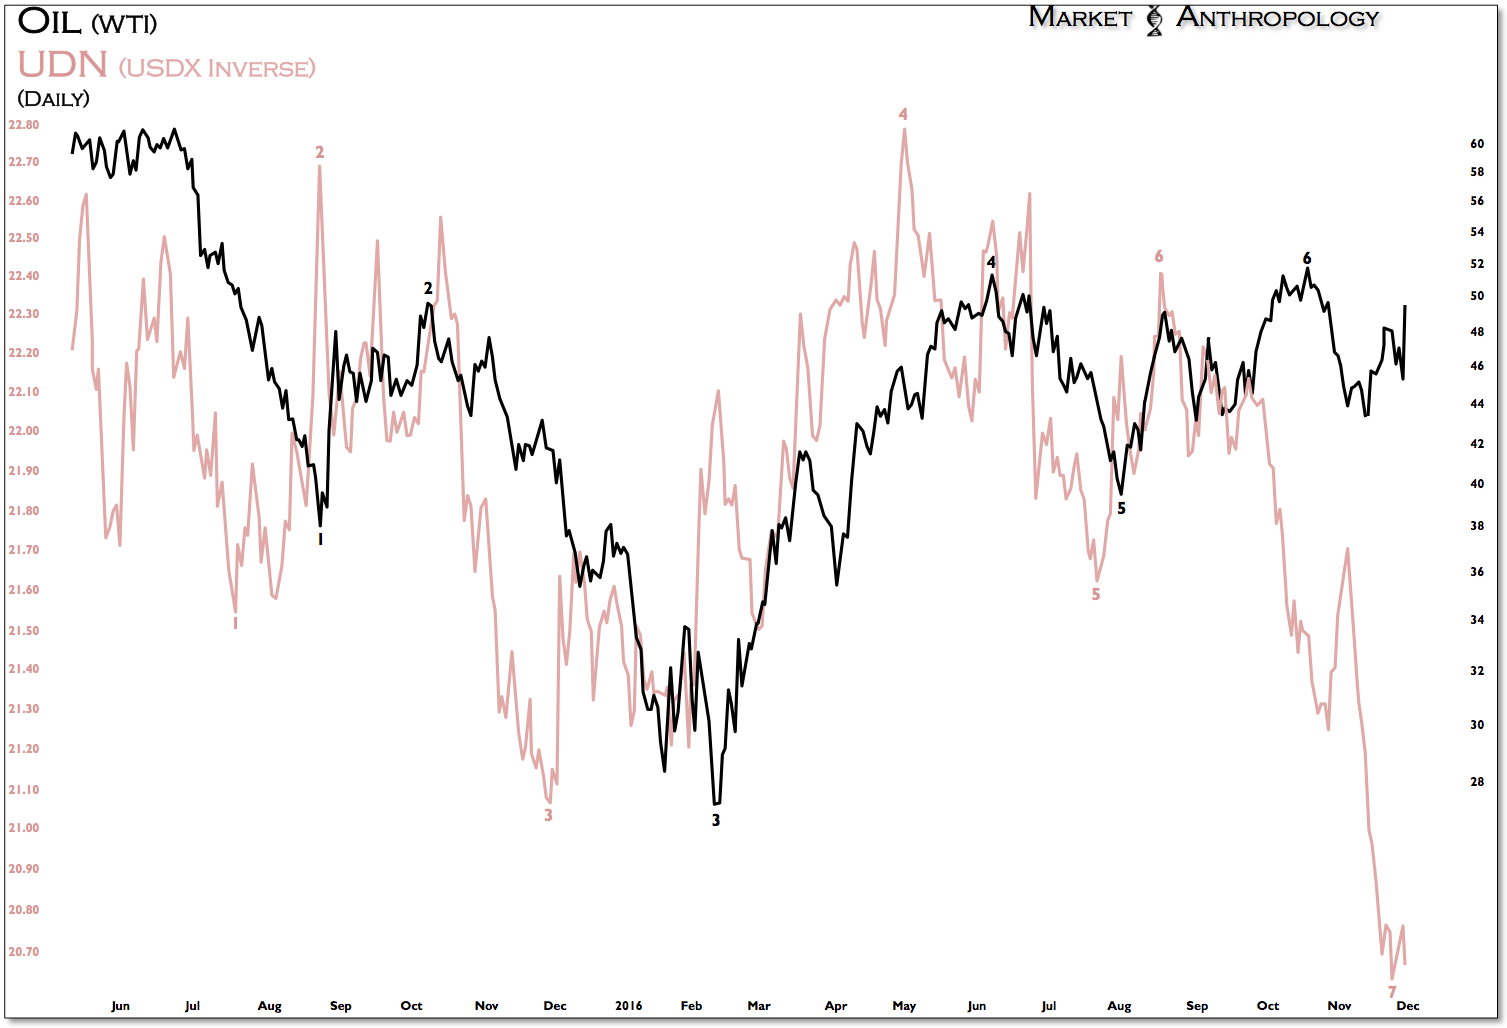
This is a big OPEC’ing deal. While the naysayers said it could not be done, OPEC went ahead and did it anyway. The cartel agreed to cut production by 1.2 million barrels a day(mbd) to 32.5 mbd and has enticed non-OPEC producers to add another 600,000 barrels. Now that the months in making the deal is done, what does this mean for oil as well as the outside market.

Well, first, I don’t think you can doubt OPEC’s commitment to making these cuts work. Not only will they have OPEC countries monitor compliance, they will also have an independent group count the barrels. In other words, they will have monitors montoring the monitors. Kuwait, Venezuela and Algeria will be montoring compliance and a disinterested third party will be keeping score of the barrels produced.

….continue reading HERE


also: Copper Poised to Surge

Trump Makes The US Stock Market Great Again

The broad US stockmarket actually looks better overall than it has done for several years, which may come as a surprise considering it has been in a bullmarket since as far back as early 2009. On the 10-year chart for the S&P500 index we can see that a potential top area developed from early 2015 through the middle of this year, which has now been aborted by recent gains that have seen it break clear above resistance at earlier highs. This index remains within the big parallel channel that started to form back in 2010 – 2011 and appears to have its sights set on a run to the upper boundary of the channel again, which will result in BIG gains from the current level. Whilst we can speculate about the fundamental reason or reasons for such a move – a Trump spending spree, hot money flowing out of embattled Europe and possibly the Mid-East and Japan into the US, and helicopter money, such pondering is largely a waste of time – the chart says the market is set to advance and quite a lot, and that’s what matters. This is a big change from several months back or even several weeks back, when it looked toppy and vulnerable. 

spx10year291116

The 4-year chart enables us to see how the market gradually rounded over beneath a giant Dome pattern, but then broke clear above it in the Spring of this year. Observe how, after this happened, and it advanced away from the Dome, it then dropped right back to test support at the Dome boundary before advancing again. This was a very deceptive move, given that it looked like it had topped out at the resistance at the highs, and thus was a buying opportunity that many missed out on. Like Russian dolls, a Dome pattern of lesser magnitude then formed during this year, which involved the market breaking out to new highs in the Summer before this Dome boundary forced it back down again, but Trump’s unexpected victory caused this Dome to abort too, and after its recent sharp advance the market is now “in the clear”, having risen well above the considerable zone of congestion approaching the 2015 highs. 

spx4year291116

On the 1-year chart we can see how the market was being forced lower by the Dome pattern that developed this year, but suddenly broke out of it on the Trump victory on strong volume, which was a bullish development, and following the breakout it has continued to push higher, breaking its Summer highs at the top of the Dome as moving averages swing into bullish alignment. 

spx1year291116

On the 3-month chart we can see recent action in detail and how jitters ahead of the election caused the market to drop sharply, until a bullish “inverted hammer” right at the 200-day moving average heralded a reversal, which occurred on the Trump victory when a gap up into a giant white candle signaled the birth of a new uptrend. After rising almost vertically for a few days, a move which punctured the Dome boundary, the market settled into a more orderly, if still steep uptrend. Now it is getting overbought on various oscillators so it would not be surprising to see it break down from this uptrend to enter a period of consolidation or reaction, although any reaction is likely to be minor before the larger uptrend resumes. 

spx3month291116

Conclusion: the market appears to be starting out on another major upleg within the giant parallel uptrend channel shown on the 10-year chart above, on which you will also find a prospective target for this uptrend, that is a long way above current levels. If this interpretation is correct, any short-term reaction will present a buying opportunity.

….also:

The Fat Lady Is Singing For The Bond Market

Hyperinflation – Coming to an Indebted Democracy Near You

Venezuelan Hyperinflation From Collapse in Confidence in Government

Venezulea-Hyperinflation

The Venezuelean hyperinflation is the direct result of what happens when the general population loses all confidence in the government. The current hyperinflation is reminiscent of Germany’s hyperinflation following World War I, which was also the result of a Communist Revolution and the overthrow of the government giving birth to the Weimar Republic.  Venezuela’s currency has become virtually worthless as was the case in Japan when the people simply refused to accept any coins issued by the Japanese government. In that instance, each new emperor devalued the outstanding money supply to 10% of his new issues. This led to Japanese accepting Chinese coins, but not Japanese.

….continue reading HERE

….related from Michael & Victor Adair:

Huge Moves – US Dollar Hits 13 Year High

Connecting the Dots

Despite the enduring enthusiasm in equities since the US presidential election, we continue to follow the proxy pivots in gold that has broadly led the trend in equities by approximately 4 weeks over the past 2 years. Should the relationship persist, we would guesstimate a pivot lower in equities approaches over the coming week. And while the S&P 500 has fully benefited from the unbridled capital outflows from Treasuries and safe haven assets that helped inspire fresh all-time highs across most indexes over the past 2 weeks, emerging market equities remain in lock step with gold’s leading structure that points towards another leg down after the current retracement rally exhausts. 
 
                                                   Click on all Charts For Much Larger Images
 1
2
 
That said, it would not surprise us to see US equities underperform (on a relative performance basis to EEM) on the downside, as we expect similar to last year’s dynamics going into and after the December Fed meeting, another sell-the-news reaction in the dollar manifests. A good leading indication that the dollar rally has run its course would be for gold and silver to find their respective lows over the coming week or so as the equity markets begin to turn down. We indicated below the two previous examples over the past two years of where a similar dynamic had developed. 
 
 3

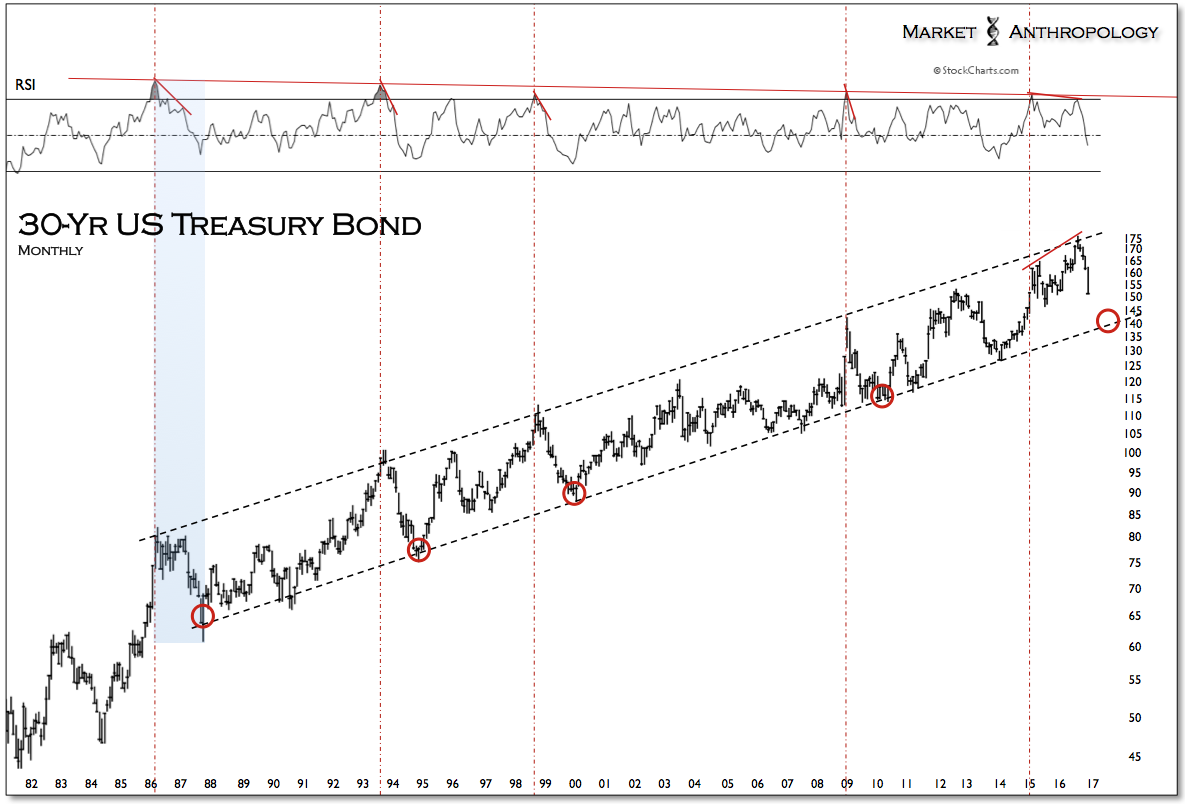
The US dollar index has again broken above 100 for the fourth time in the past two years, which has closely correlated with cresting rate hike expectations of the Fed. The last time the CME Group’s Fed Fund Futures probability for this December meeting rose above 90 percent was the first week in January of this year – before global market pressures significantly reduced expectations, which very likely had a negative feedback effect on the near-term outlook for growth and hence the economic data downstream in the following months. Despite participants mood in yields and rate hikes pivoting 180 degrees since the lows in July and some marquee money managers becoming increasingly more bullish on US economic growth in the wake of a Trump victory, US markets are still at the mercy of a fragile global equilibrium that is invariably adversely affected by a much stronger US dollar and tighter financial conditions worldwide – not to mention a domestic economic expansion already historically long in the tooth. 
 
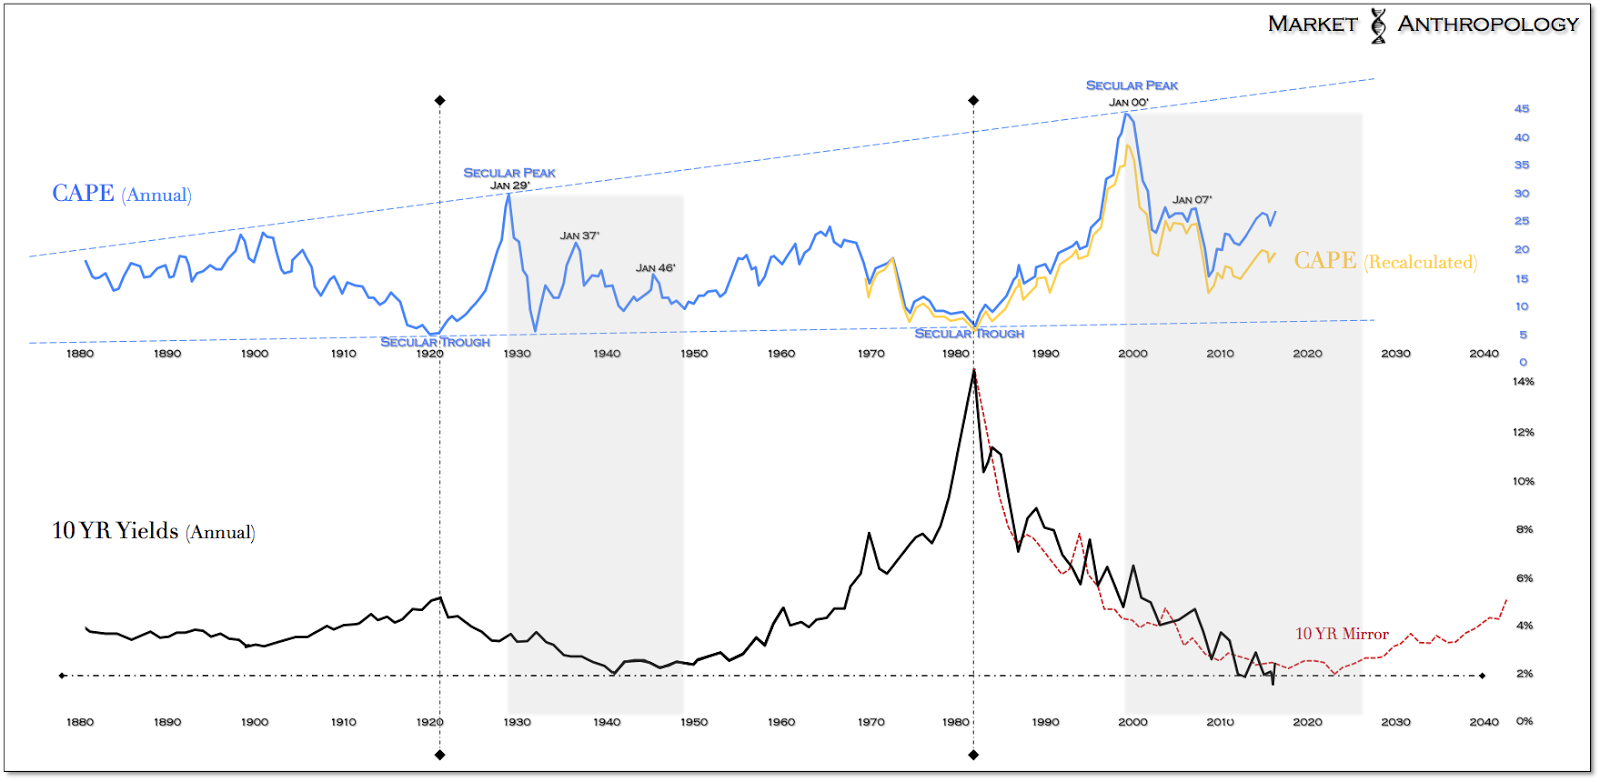
Consequently, we tend to defer to much longer-term perspectives on yields and growth that despite what the interim rally might suggest, continues to point towards a lower-for-longer market environment well into the next decade. 
 
Screen Shot 2016-11-30 at 10.24.01 PM
Screen Shot 2016-11-30 at 10.30.56 PM
 
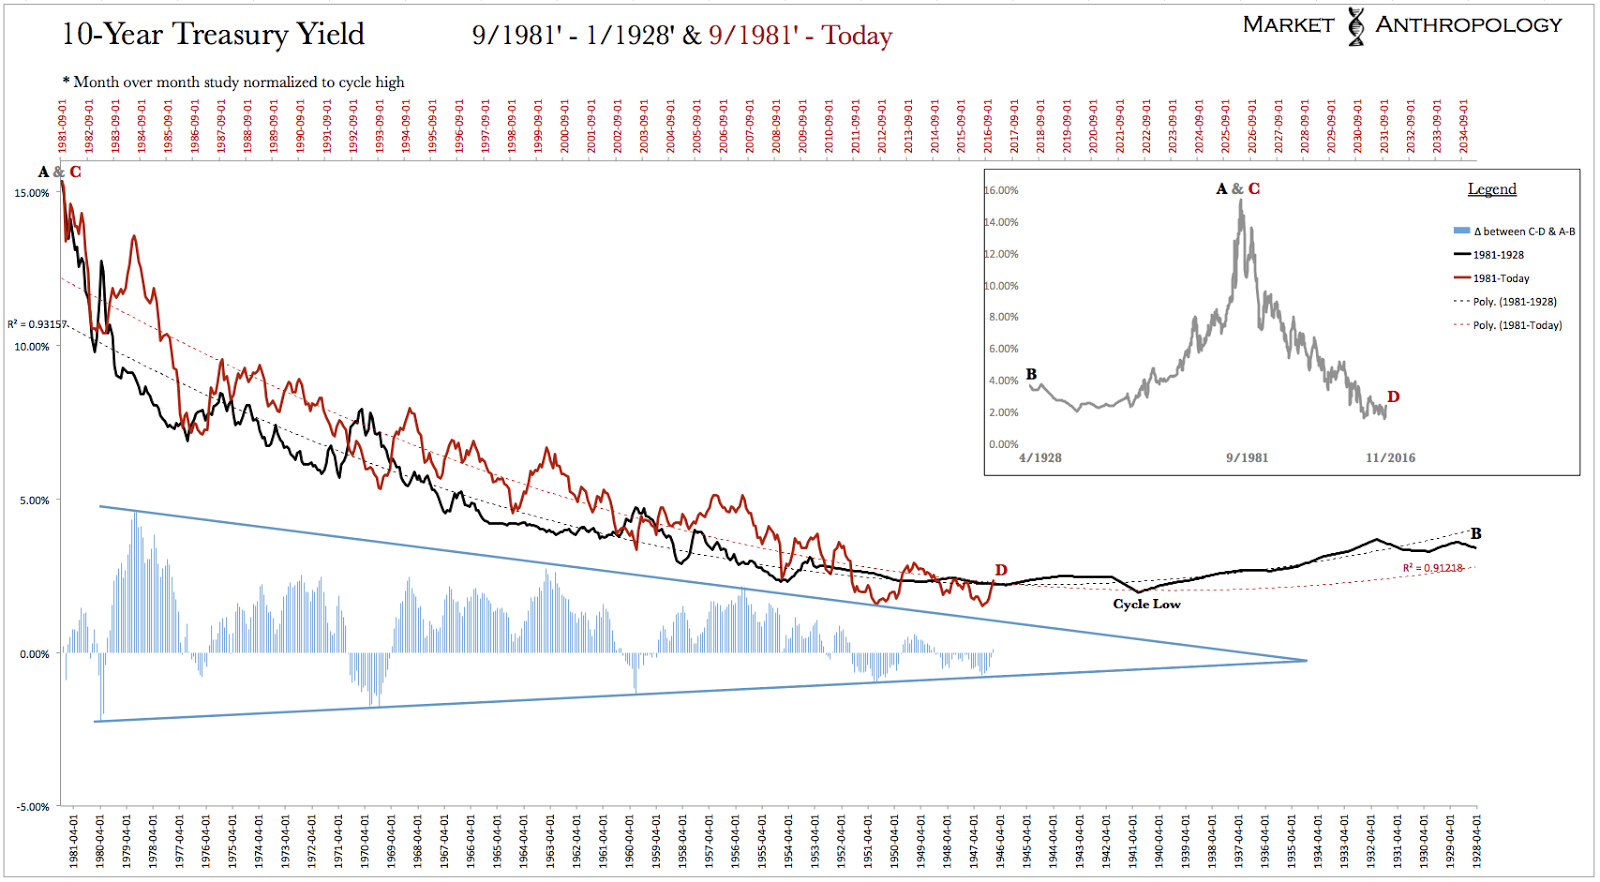
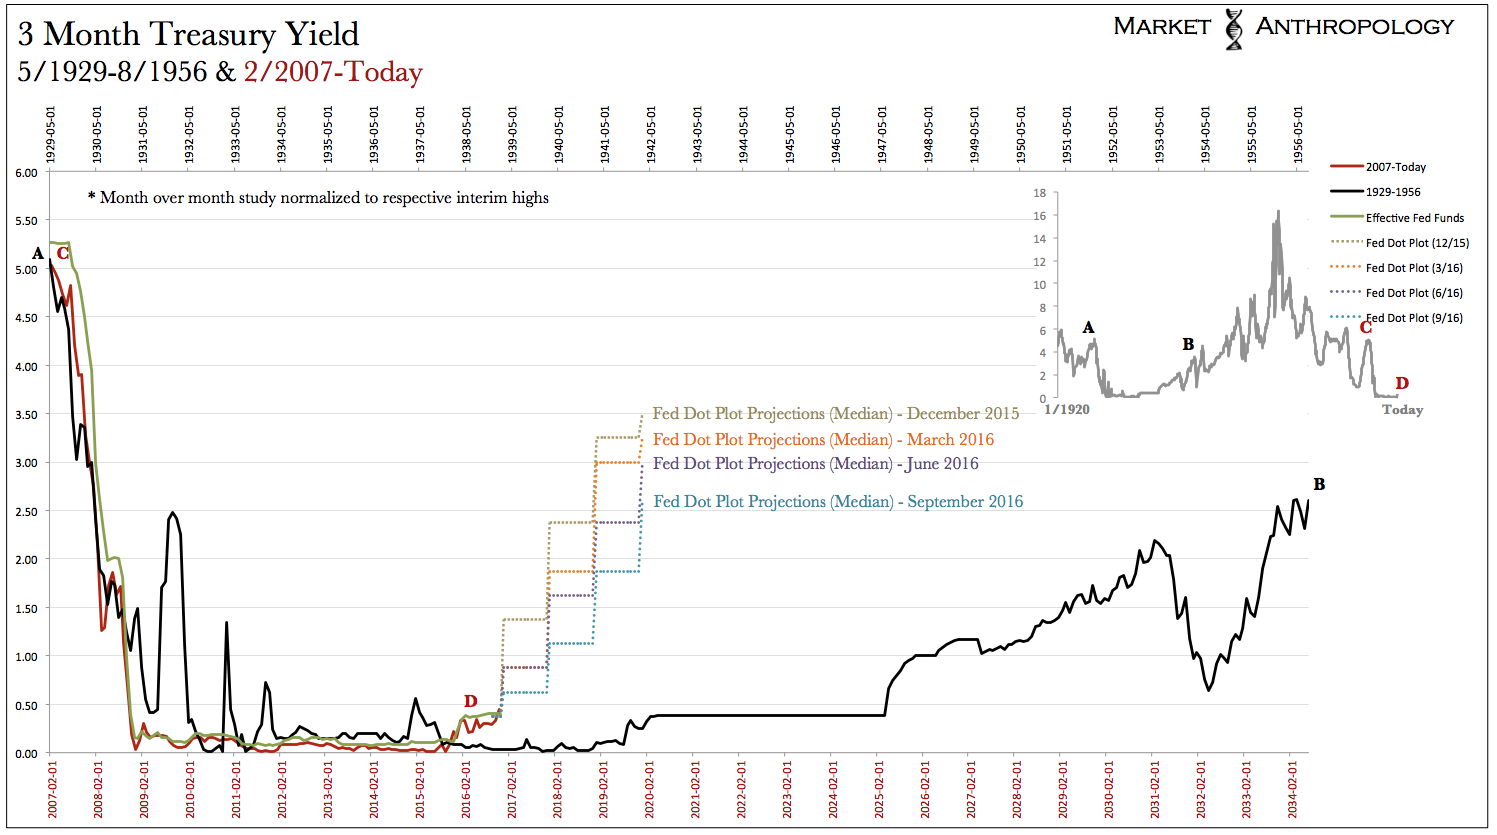
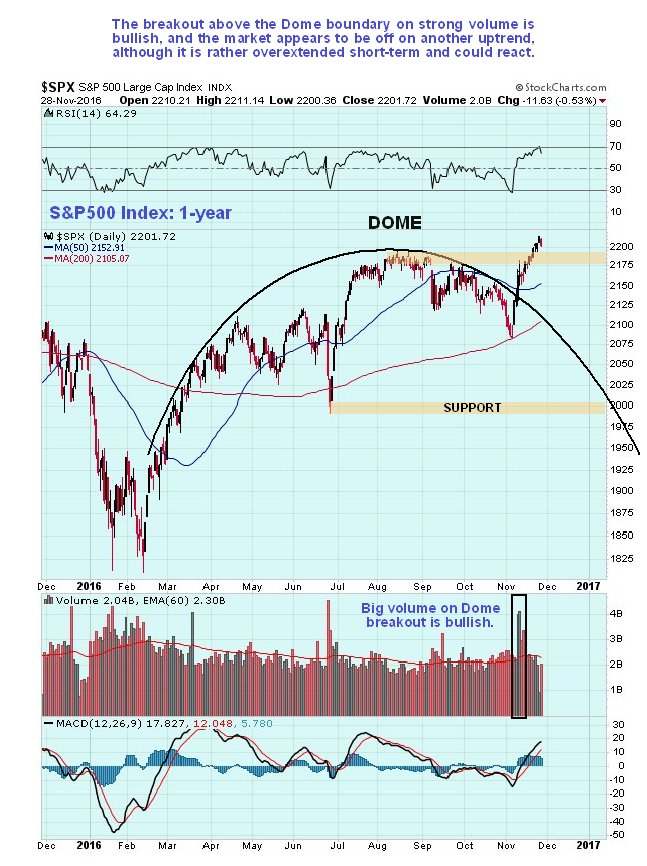
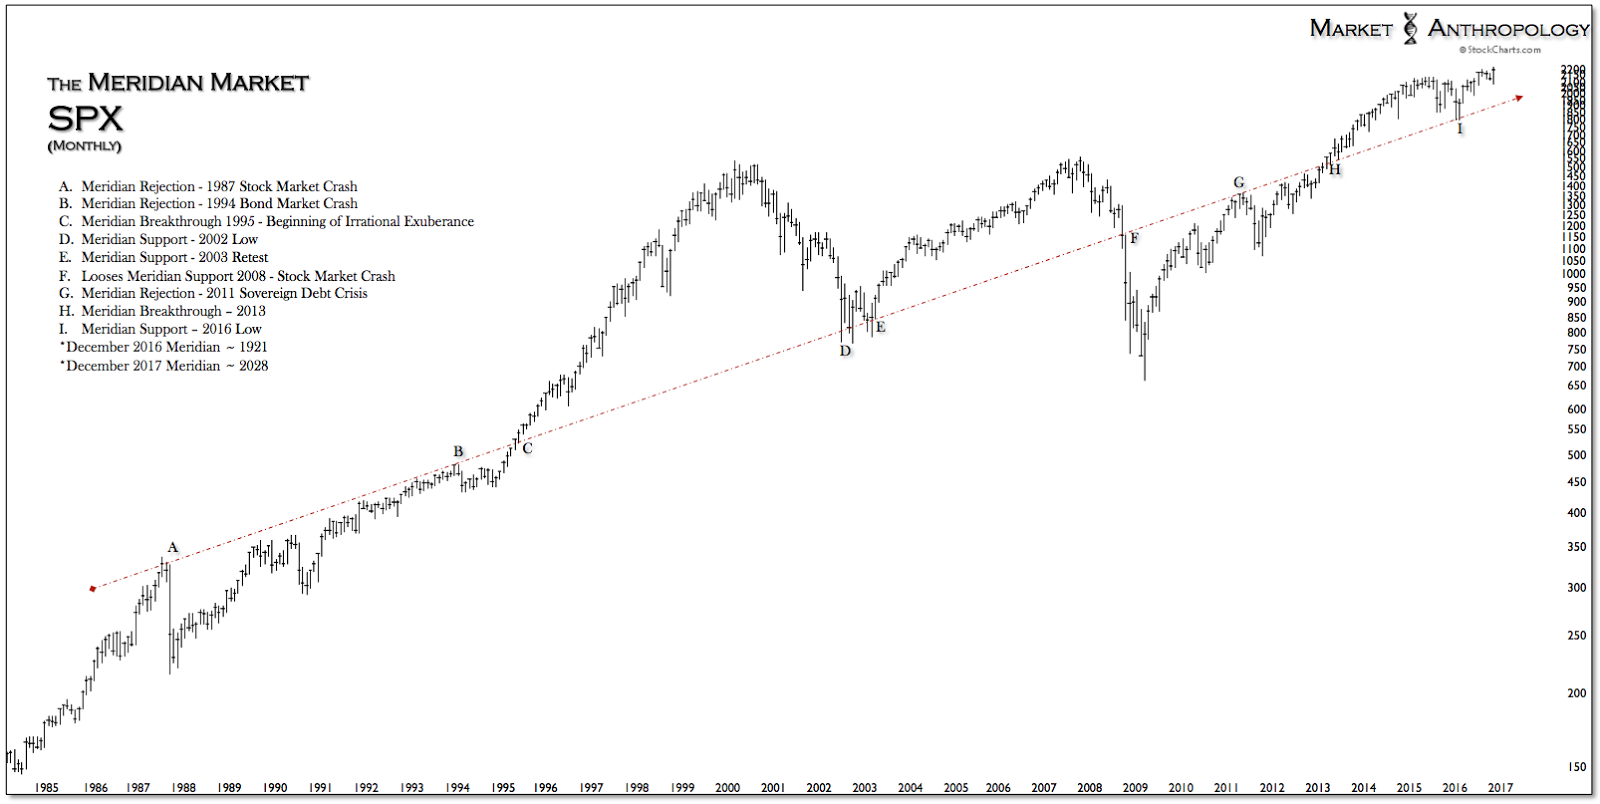
While we do expect the current weakness in Treasuries to extend into early next year and that yields would be more supported than the dollar over the coming years as we foresee the uptrend in inflation continuing, both markets are confined by a much broader construct that we believe is not yet under a more secular persuasion or has digested and crossed the transitional divide to the next major growth cycle. This long-term outlook remains for equities as well, as 2200 on the S&P 500 was our secondary target back in January, if the market found support at the Meridian – as it did a few weeks later. And although it wasn’t our base case scenario back then, we still hold the respective extremes (both bullish and bearish) as outlier probabilities, with now considerable less upside opportunity today from a long-term historical perspective.
 
Screen Shot 2016-11-30 at 11.15.11 PM
Screen Shot 2016-11-30 at 11.20.42 PM
 
Expecting US growth will now resume a trajectory last seen during the halcyon days of the 1990’s, or that yields on the 10-year will again rise above 4 percent, is putting the cart well out in front of this horse, regardless of whether it was the Fed – or now Trump, holding out the carrot or waiving a large stick. Less we forget, we’ve been whacked plenty and have eaten trillions of bushels of carrots over the past decade with little to show for it in terms of growth. Sticks and carrots may have helped repair it, but only time will heal these wounds.
 
Although the US equity markets have enjoyed recent strength since the election, the honeymoon appears to be ending and we expect the new members of the bull brigade to have their gilded growth thesis tested as the equity markets could again become the sharp tip of the sword prodding at the sides of the Fed next year.
 
4
5
6