
Energy & Commodities
 Watch For This Africa X-Factor In Copper Prices For 2017
Warnings of a potential surge coming in global copper prices this week. Emerging from a place few observers in the space are focused on.
The southern Africa producing nation of Zambia.
Industry sources in Zambia told Reuters this past week that some big changes are quietly afoot in the copper market here. Triggered by a change in government policy for local smelters.
That’s a new tax reportedly being introduced by the Zambian government on imports of copper concentrates. With officials apparently planning to tax incoming shipments of concentrate at up to 7.5%.
Here’s why that matters for global copper prices.
Industry sources said the proposed tax would likely make concentrate imports uneconomic for most Zambian smelters. With these buyers unable to make a profit if the additional levy is added on top of already-thin margins.
That would likely bring a halt to concentrate imports into Zambia. Which currently run at least 500,000 tonnes yearly, coming from mines in the neighboring Democratic Republic of Congo.
Industry sources said the sudden surplus of Congolese concentrate would “upset the supply chain for the first six months of 2017.” With 500,000 tonnes of concentrate supply here now seeking buyers elsewhere in the world – possibly in China or India, shipped through South African ports.
Given the long distance involved, it could take up to two months for these concentrates to start reaching smelters. With sources estimating that up to 150,000 tonnes of copper metal production could be delayed by the transit.
That could result in a short-term supply squeeze. Potentially spiking copper prices higher, at least for a few months in early 2017.
Zambia’s smelters have reportedly been pressuring the government to drop the new tax. Watch for a final decision on this critical legislation, and for resulting effects in copper supply and prices if the measure does go ahead.
Here’s to butterfly wings flapping,

Dave Forest
dforest@piercepoints.com

“History shows the only place for interest rates to go from here is higher.”
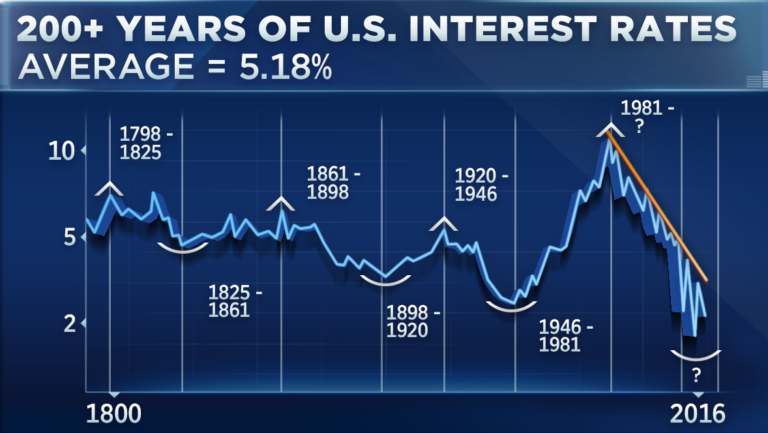
Examine the above chart of interest rates for 200 years.
- Rates rise and fall in long cycles, 20 to 40 years from a peak to a trough.
- Important highs occurred in 1920 and 1981.
- Important lows occurred in 1946 and probably 2016.
- Current rates are the lowest in 200 years. Some analysts have said the lowest in 5,000 years.
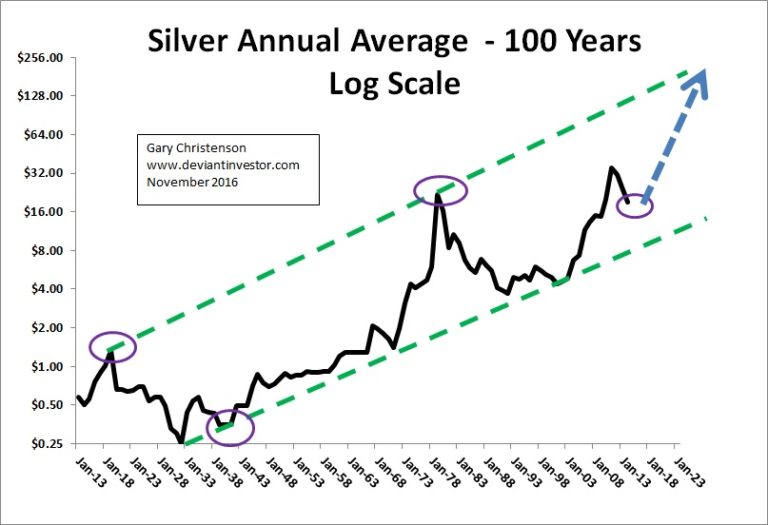
Examine the chart of annual silver prices since 1913 on a log scale. The upward trend in silver prices is clear and will continue as long as debt is increasing in our fiat currency system.
INTEREST RATES AND SILVER PRICES:
Refer back to the 200 year chart of interest rates and the 100 year chart of silver prices. Note the correlation between interest rate highs and silver price highs and similar lows (ovals).
Highs: Interest rates 1920 – silver 1919
Highs: Interest rates 1981 – silver 1980
Lows: Interest rates 1946 – silver 1932 and 1941
Lows: Interest rates 2016 – silver 2015
Interest rates rose approximately 35 years from 1946 – 1981 and fell for 35 years from 1981 – 2016. Silver prices could rise for several decades, along with interest rates, as the dollar is devalued further, silver is aggressively used for industrial applications, investment demand increases, and perhaps … the world is forced to return to a monetary system tied more closely to gold or silver.
RISING INTEREST RATES:
We also know that interest rates are the “cost of money” and have been steadily pushed lower for 35 years by government and central bank actions. Further, the bond market rises as interest rates fall (good times for Wall Street) and falls as interest rates rise. Higher rates mean the $200 trillion or so of debt is more costly to service – we know it will never be paid back in current dollars – but interest to service the debt is more onerous. Budgets are squeezed, projects are curtailed, weak businesses go bankrupt, stock buy-backs are reduced and all those derivatives that are tied to interest rates — well, it won’t be good for many of them…
The Resolution:
- Let it all crash. Admit the governments of the world have no intention of repaying the debt (at least since 2008), let the depression begin, destroy economies, governments, businesses, and millions of lives including the politicians and central bankers who created unsustainable systems and encouraged deficit spending.
or
-
Monetize debt, fire up the printing presses, launch the Bernanke helicopters, and blame someone for the inflationary consequences later.
What politician, banker, Wall Street CEO, central banker, or corporation CEO will choose the crash option? Hence expect the inflation option. For review:
In 1913 a dollar bought almost 1/20 ounce of gold, 8 gallons of gasoline, and 14 loaves of bread.
Today we all know the devalued dollar buys much less. In round numbers our politicians and central bankers have devalued the dollar by perhaps 98%. Expect the devaluation of all fiat currencies to accelerate.
During the 8 long years of the Obama administration total official U.S. government debt has approximately doubled, from about $10 trillion to about $20 trillion. Expect more debt, lots more debt. LOTS MORE DEBT!
What does this suggest about silver prices?
- More debt means more dollars are in circulation and that means erratically higher prices for most items including bread, energy, health care and silver.
- Bond monetization, “printing” dollars, and helicopter money will suggest to everyone – eventually – that the dollar is not a reliable store of value and has not been since 1913. When that realization is finally common knowledge, people will act to protect their wealth and purchasing power. Silver and gold will perform better than crashing bonds, over-valued stocks and promises from politicians.
- Silver and gold are insurance against crashing markets, central bank and government manipulations, devaluing currencies, collapsing “Ponzi” schemes in debt and currency markets, and more.
- The dollar has lost about 98% of its value in 100 years. Silver and gold have, on average, retained their value. Expect their current low prices to spike higher as fiat currency declines toward its intrinsic value.
HYPERINFLATIONS:
Many hyperinflations have occurred in the past 100 years. Example: Argentina has devalued against the U.S. dollar by 10 trillion to one since about 1950. The continued devaluation of the U. S. dollar, loss of reserve currency status, and coming massive “stimulus” spending could result in hyperinflation in the United States. Silver will reach incredible prices in such a disastrous situation. Few if any will be pleased with the consequences of hyperinflation, but owning silver will help mitigate the trauma.
Expect interest rates and silver prices to rise, along with debt, accelerating currency devaluations, and economic craziness until a massive reset occurs.
Gary Christenson
The Deviant Investor

To the United Nations: Four hours and 29 minutes, 1960.
In Cuba: Seven hours and 10 minutes, Communist Party Congress, 1986.
– Guinness Book of Records.

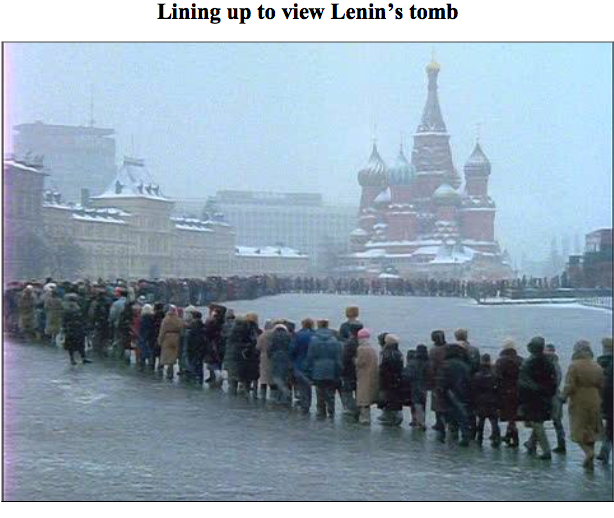
It is said that Russians wanted to make sure he was really dead.
BOB HOYE, INSTITUTIONAL ADVISORS – WEBSITE: www.institutionaladvisors.com

This is a day that rejects the adversarial confrontational path, a day where you can participate in improving your community by making a pledge to Orhpans in need. Join Michael between 2 and 4 today on CKNW’s Ophans Fund Pledge Day, where he will do his utmost to enhance the health and welfare of children in BC. Please give generously. Donate HERE or call Michael.
….also from Michael: Somewhere Between Ridiculed & Violently Opposed

Originally published on Nov 29, 2016, 9:35 AM
Trading position (short-term; our opinion): No positions are justified from the risk/reward perspective.
Crude oil gained 2.21% yesterday and came back above $47, but taking a dive today, confirming that closing the long positions yesterday and taking profits off the table was a good idea. Now, the question is how much does today’s decline actually change.
Let’s take a look at the charts to find out (charts courtesy of http://stockcharts.com).
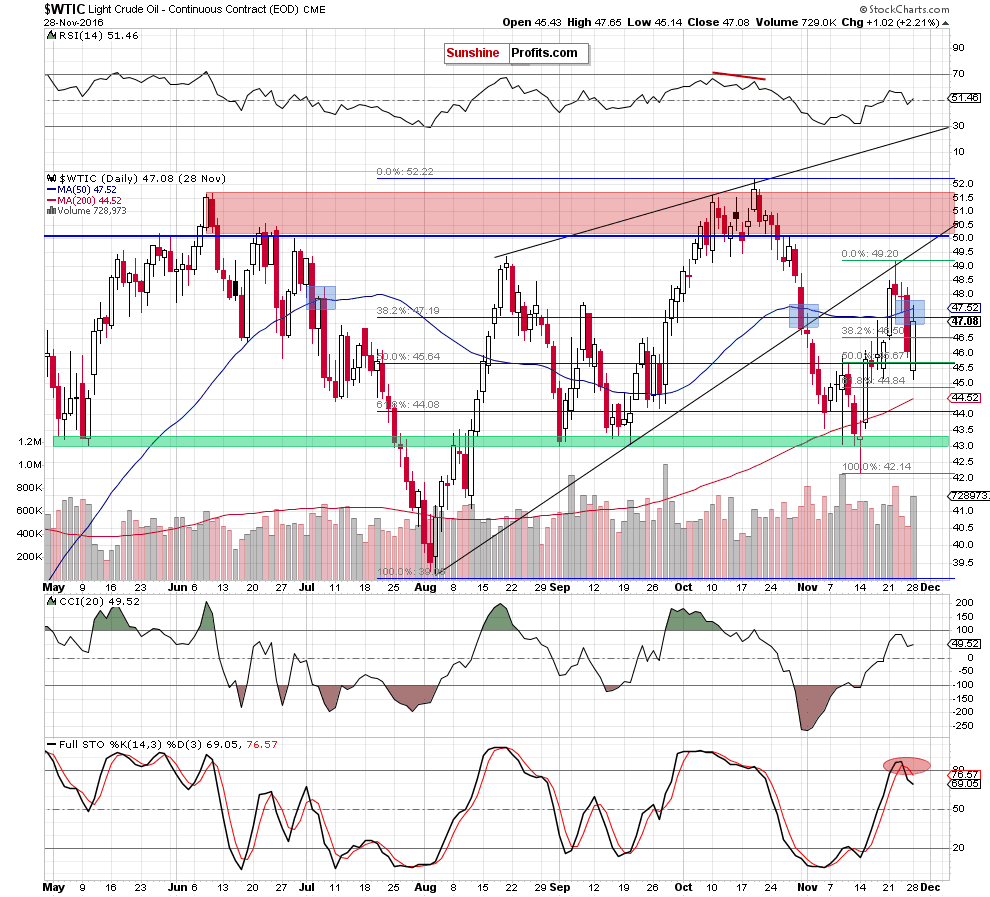
Looking at the daily chart, we see that crude oil bounced off the mid-Now lows and climbed above $47, reaching the previously-broken 50-day moving average. We saw similar situation at the beginning of Jul and at the turn of Oct and Nov. In both previous cases, verification of breakdowns preceded further declines, which increases the probability of the realization of our yesterday’s outlook:
(…) With Friday’s decline, the commodity also slipped below the 50-day moving average and Fibonacci levels, which doesn’t bode well for light crude – especially when we factor in a sell signal generated by the Stochastic Oscillator. Taking all the above-mentioned negative factors into account, it seems that crude oil could extend losses and even a test the previously-broken 200-day moving average in the coming days.
With the outlook being rather bearish despite yesterday’s upswing, it is quite natural to view today’s decline as a confirmation. Besides, the bearish scenario is also supported by the current situation in the oil-to-gold ratio.
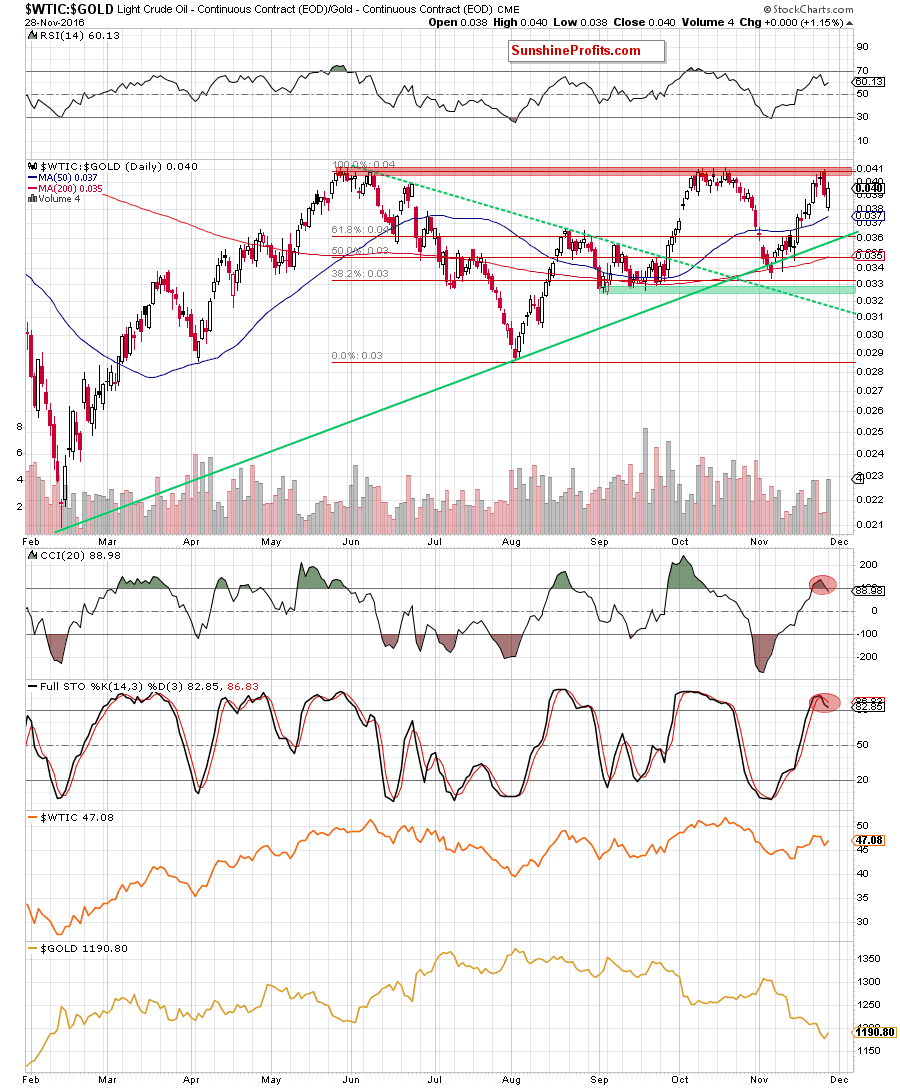
From this perspective, we see that the ratio reached the key red resistance zone, which stopped increases in Oct. This area triggered also a pullback on Friday, which in combination with sell signals generated by the CCI and Stochastic Oscillator suggests that lower values of the ratio (and crude oil as strong positive correlation remains in play) are just around the corner.
Summing up, although crude oil rebounded yesterday, the 50-day moving average stopped further improvement, which in combination with a sell signal generated by the Stochastic Oscillator and the current situation in the oil-to-gold ratio suggests that we’ll see another attempt to move lower and even a test the 200-day moving average in the coming days. For now, it seems that keeping the profits from the previous trades intact and waiting for another trading opportunity is justified from the risk to reward point of view.
Very short-term outlook: mixed
Short-term outlook: mixed
MT outlook: mixed
LT outlook: mixed
Trading position (short-term; our opinion): No positions are justified from the risk/reward perspective.
Thank you.
….also:
Stock Trading Alert: New Record Highs, But Will The Uptrend Continue


-
I know Mike is a very solid investor and respect his opinions very much. So if he says pay attention to this or that - I will.
~ Dale G.
-
I've started managing my own investments so view Michael's site as a one-stop shop from which to get information and perspectives.
~ Dave E.
-
Michael offers easy reading, honest, common sense information that anyone can use in a practical manner.
~ der_al.
-
A sane voice in a scrambled investment world.
~ Ed R.
Inside Edge Pro Contributors

Greg Weldon

Josef Schachter

Tyler Bollhorn

Ryan Irvine

Paul Beattie

Martin Straith

Patrick Ceresna

Mark Leibovit

James Thorne

Victor Adair