
Stocks & Equities

![]()
In This Week’s Issue ending November 28, 2016:
- Weekly Commentary
- Strategy of the Week
- Stocks That Meet The Featured Strategy
- Stockscores’ Market Minutes Video – Fear Can Keep You Out of the Game
- Stockscores Trader Training – Checking the Charts
- Stock Features of the Week – Abnormal Breaks
Stockscores Market Minutes – Fear Can Keep You Out of the Game
Investors constantly hear of fear based analysis the predicts dramatic corrections. Rarely are these predictions right so there needs to be a better way. This week, I discuss this plus my regular weekly market analysis and the trade of the week on $OPXA. Click Here to Watch
To get instant updates when I upload a new video, subscribe to the Stockscores YouTube Channel
Trader Training – Checking the Charts
Stock chart analysis is becoming more and more popular every day; investors are realizing that the chart is a graphical representation of what thousands of investors believe about a stock and is often more reliable than the opinion of just one person’s fundamental analysis.
The problem is that there is a lot of incorrect chart analysis happening and one of the most common mistakes I see is the use of the wrong chart for making a decision.
Do you look at monthly, weekly, daily, hourly or even minute by minute charts when doing chart analysis? The answer should be motivated by the type of investor you are.
A long term trader, someone trying to maximize the return of their long term retirement portfolio should not get too caught up in the day to day gyrations of the market. It is the big picture trend of the market that should matter the most, making the gain or loss for the stock or the overall market on a single day quite irrelevant to the trading decision.
On the other end of the time frame spectrum are the day traders who should really be concerned with what is happening on the 2 minute, 5 minute or 15 minute charts. For the short term trader, these time frames are the most relevant and yet the decisions of many short term active traders are swayed by the headlines they read about big macro-economic issues that could affect the long term direction of the market. The level of debt that the US Government has does not have a lot of relevance to what a hot bio tech stock is going to do over the next day.
On Stockscores.com, it is possible to set the default time from of the charts you look at to suit your trading time horizon. If you are a long term trader, set the default to a three year weekly chart. Medium term? Focus on the daily chart. A swing trader can set his or her default time frame to the 15-minute time frame.
Doing this is relatively simple:
- Pull up the chart for any stock by entering the symbol in the upper right corner of the site. Remember that Canadian symbols need a prefix, T. for the TSX and V. for the Venture.
- Go to the charting tab, this is either beside the small chart view or below the large chart view.
- Make sure that the chart type is set to Quick.
- Set the interval to the time frame that suits you.
- Set the lookback period. I like to look back as far as possible without having the resolution of the chart degraded.
- Click on Create Chart
This has now established a new chart default which will remain as your default each time you log in using that computer. If you use a different device, you will have to reset the chart settings on that machine as well.
While it is important to focus on the time frame that suits your style the best, it is also wise to look at other time frames for confirmation. A person focused on the daily chart should check the weekly and the hourly for confirmation. A day trader may be focused on the two minute but a quick check of the 15 minute and daily will be helpful as well.
You can do that using the fast time frame links that you will see at the top of the chart.
Click on one of these to change the time frame quickly without changing your default chart.

Stock Features of the Week – Abnormal Breaks
This week, I ran the Stockscores Abnormal Breaks for the US and Canada. With the major markets up a lot in the last two weeks, I wanted to focus on smaller cap stocks trading abnormally as they should be able to do ok even if the market pulls back in the short term. Here are two low priced stocks that I found:
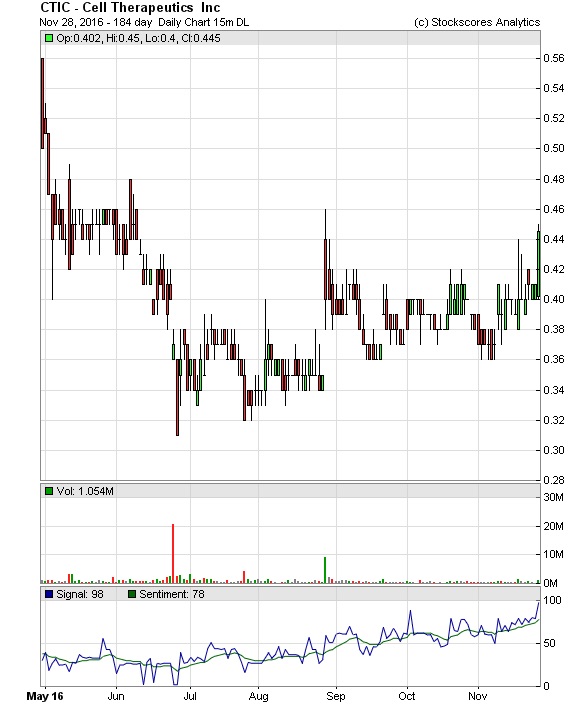
1. CTIC
CTIC had some late day buying today which pushed the stock higher and out of a bottom fishing chart pattern. Support at $0.38.
References
- Get the Stockscore on any of over 20,000 North American stocks.
- Background on the theories used by Stockscores.
- Strategies that can help you find new opportunities.
- Scan the market using extensive filter criteria.
- Build a portfolio of stocks and view a slide show of their charts.
- See which sectors are leading the market, and their components.
….related: 3 Dividend Stocks to Buy Now and Hold for 20 Years
Disclaimer
This is not an investment advisory, and should not be used to make investment decisions. Information in Stockscores Perspectives is often opinionated and should be considered for information purposes only. No stock exchange anywhere has approved or disapproved of the information contained herein. There is no express or implied solicitation to buy or sell securities. The writers and editors of Perspectives may have positions in the stocks discussed above and may trade in the stocks mentioned. Don’t consider buying or selling any stock without conducting your own due diligence.

Originally published November 28, 2016, 6:53 AM:
Briefly: In our opinion, speculative short positions are favored (with stop-loss at 2,240, and profit target at 2,060, S&P 500 index).
Our intraday outlook is bearish, and our short-term outlook is bearish. Our medium-term outlook remains neutral, following S&P 500 index breakout above last year’s all-time high:
Intraday outlook (next 24 hours): bearish
Short-term outlook (next 1-2 weeks): bearish
Medium-term outlook (next 1-3 months): neutral
Long-term outlook (next year): neutral
The U.S. stock market indexes gained 0.2-0.4% on Friday, extending their short-term uptrend, as investors’ sentiment remained bullish following presidential elections outcome. The S&P 500 index has reached yet another new all-time high at the level of 2,213.35. The nearest important support level is at 2,190-2,200, marked by previous level of resistance. The next important level of support remains at 2,170-2,180. The market continues to trade along its medium-term upward trend line, as we can see on the daily chart:
Expectations before the opening of today’s trading session are negative, with index futures currently down 0.2-0.3%. The main European stock market indexes have lost 0.6-0.7% so far. The S&P 500 futures contract trades within an intraday consolidation, as it retraces some of its Friday’s advance. The nearest important level of resistance is at around 2,210, marked by local highs. On the other hand, support level is at 2,200, and the next level of support is at 2,190, marked by some previous local lows:

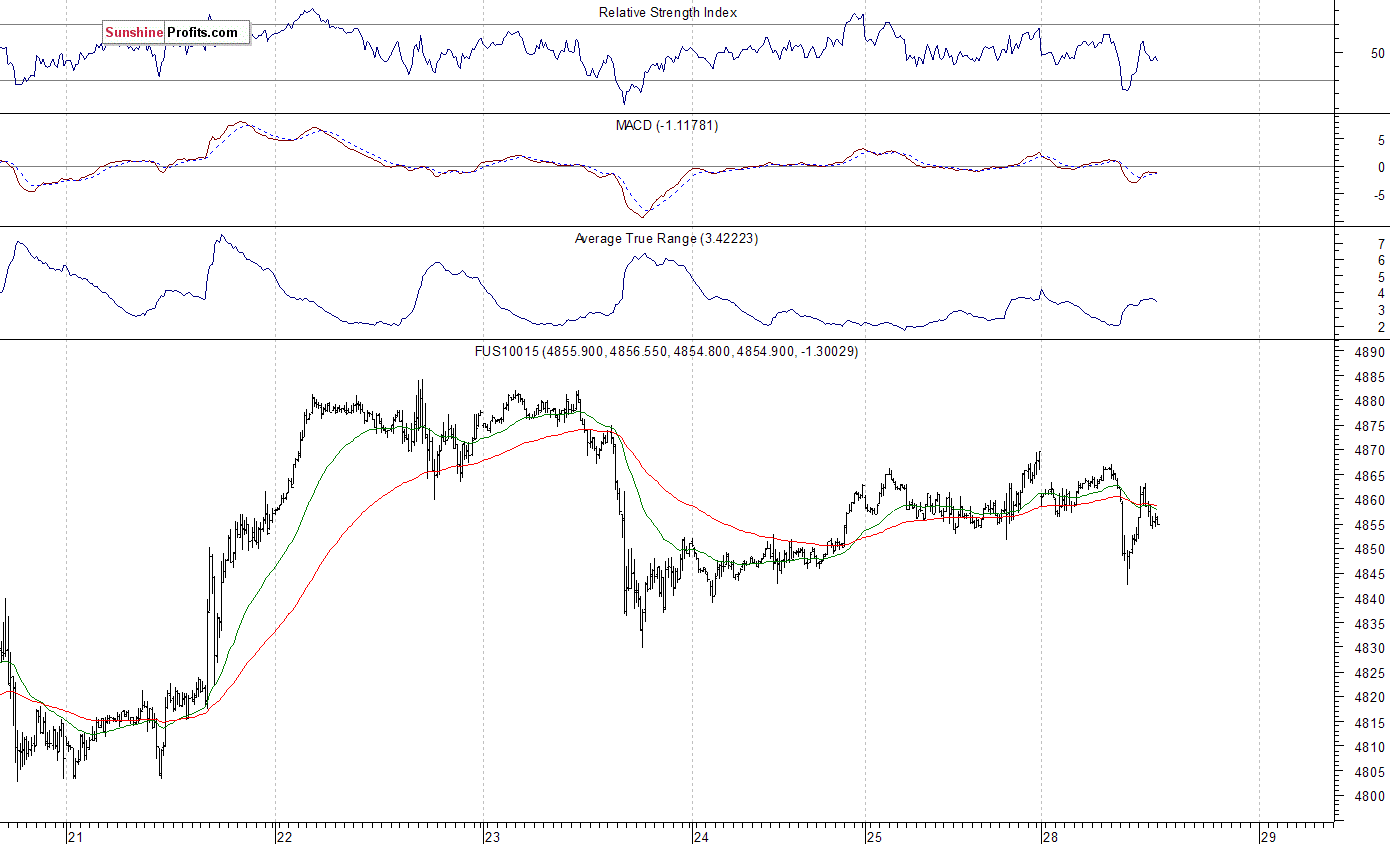
The technology Nasdaq 100 futures contract follows a similar path, as it currently trades along the level of 4,850. The nearest important level of resistance is at around 4,870-4,890, marked by local highs. On the other hand, support level remains at 4,830-4,840, marked by previous local lows, as the 15-minute chart shows:
Concluding, the broad stock market continued its long-term uptrend on Friday, as the S&P 500 index reached new all-time high above 2,200 mark. We still can see technical overbought conditions. Therefore, we continue to maintain our speculative short position (opened on November 16 at 2,177 – opening price of the S&P 500 index). Stop-loss level is at 2,240 and potential profit target is at 2,060 (S&P 500 index). You can trade S&P 500 index using futures contracts (S&P 500 futures contract – SP, E-mini S&P 500 futures contract – ES) or an ETF like the SPDR S&P 500 ETF – SPY. It is always important to set some exit price level in case some events cause the price to move in the unlikely direction. Having safety measures in place helps limit potential losses while letting the gains grow.
To summarize: short position in S&P 500 index is justified from the risk/reward perspective with the following entry prices, stop-loss orders and profit target price levels:
S&P 500 index – short position: profit target level: 2,060; stop-loss level: 2,240
S&P 500 futures contract – short position: profit target level: 2,055; stop-loss level: 2,235
SPY ETF (SPDR S&P 500, not leveraged) – short position: profit target level: $206; stop-loss level: $224
SDS ETF (ProShares UltraShort S&P500, leveraged: -2x) – long position: profit target level: $18.38; stop-loss level: $15.64 (calculated using trade’s opening price on Nov 16 at $16.6).
Thank you.
….also from Sprott Money: This Is Where I Get Off

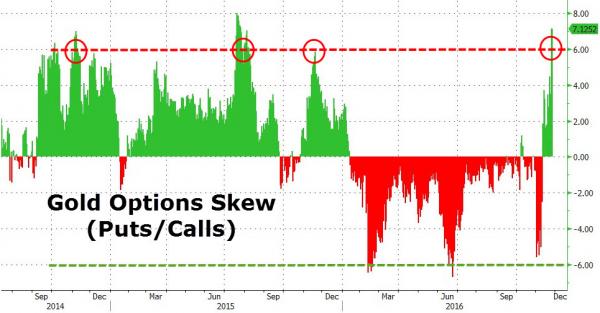
After a year of almost uninterrupted bullish bias in precious metals options markets, gold skews (the ‘price’ of put protection over calls) has exploded to its highest (most bearish) leves since July 2015.
As Bloomberg reports, bearish options hedging against a 10 percent price drop in the biggest gold exchange-traded fund cost the most since July 2015 relative to calls betting on a 10 percent jump.
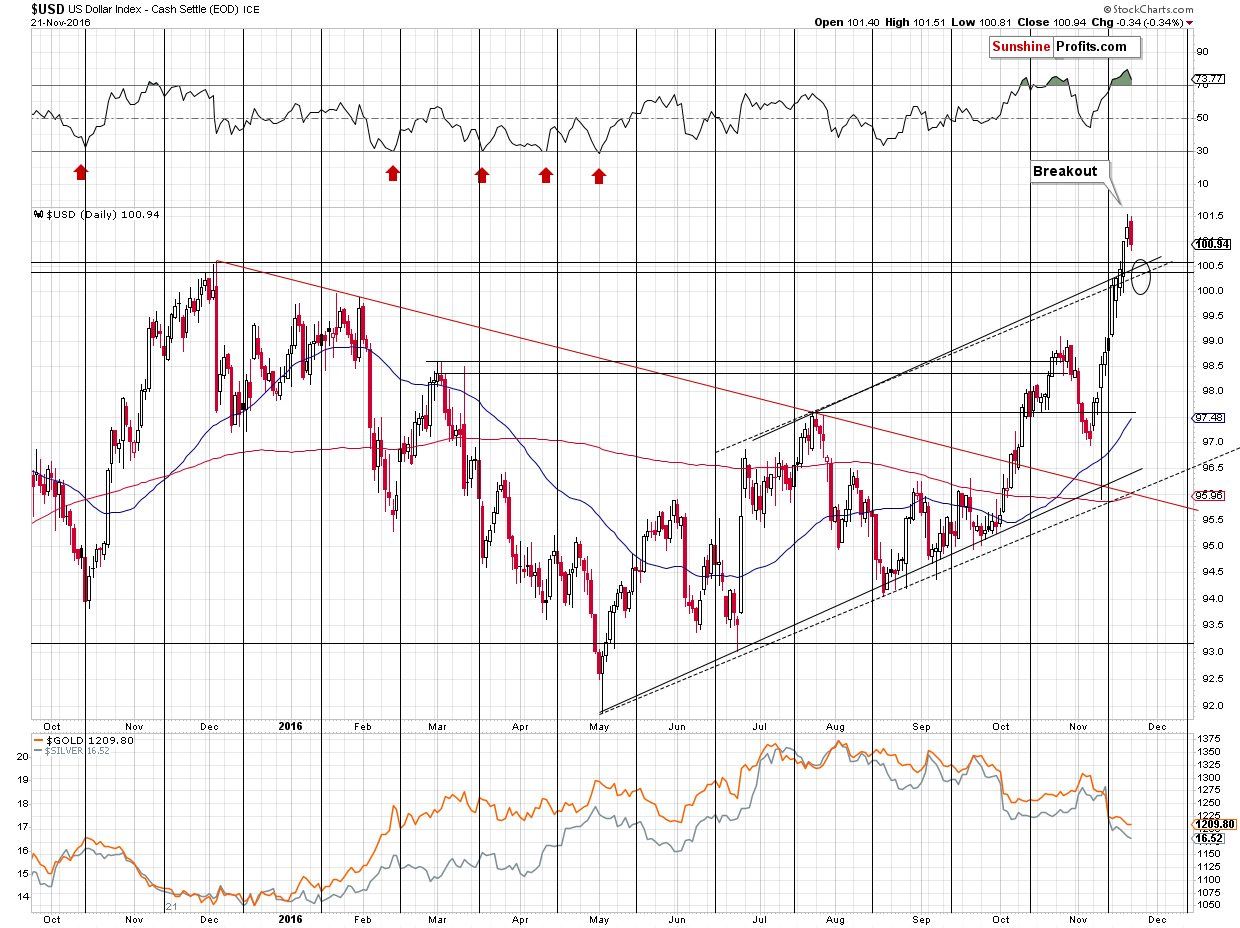
The US dollar is up 10% since May when the Canadian Dollar made it high for the year. Victor on the huge moves in the currency markets, Gold, Stocks and interest rates and the 28% move in Copper in the last 5 weeks.
….also from Michael & Ozzie: The Hottest Properties Right Now

A recent report from one of Canada’s largest real estate companies says that rental real estate is their top investment as money will continue to flow into multi-family. Also Ozzie gives his reasons why he likes the US.
…also Michael’s featured guest: Up Down or Sideways?


-
I know Mike is a very solid investor and respect his opinions very much. So if he says pay attention to this or that - I will.
~ Dale G.
-
I've started managing my own investments so view Michael's site as a one-stop shop from which to get information and perspectives.
~ Dave E.
-
Michael offers easy reading, honest, common sense information that anyone can use in a practical manner.
~ der_al.
-
A sane voice in a scrambled investment world.
~ Ed R.
Inside Edge Pro Contributors

Greg Weldon

Josef Schachter

Tyler Bollhorn

Ryan Irvine

Paul Beattie

Martin Straith

Patrick Ceresna

Mark Leibovit

James Thorne

Victor Adair