
Personal Finance
 Regular readers will disregard the current downward trend in precious metals prices. They were already warned, repeatedly, that the supposed “rally” in the precious metals sector this year was a Fake Rally. It was a set-up to position these markets for a crash, timed to coincide (more or less) with a manufactured crash of our bubble markets and already-crippled economies.
Precious Metals
However, it was a crash in precious metals markets (the Crash of ’08) which set the stage for the last, real rally in this sector (2009 -11). For various reasons, it will likely be a crash which sets the stage for the Next Rally. Here it is important to note that while the banking crime syndicate can manipulate the price of gold or silver they cannot affect the value of these metals. The longer the banksters pervert the prices of precious metals, the more violent the upward move in gold and silver prices when those prices finally reflect that value.
Gold and silver have value because these metals have universal aesthetic appeal. Because of that quality, and because these metals occur at ideal levels of scarcity/abundance, gold and silver have always been and will always be the best money available to our species.
Gold and silver are eternal stores of value and thus eternal protectors of wealth. These metals are also presently undervalued, to an absurd degree , because of the criminal manipulation of these markets, which has been frequently documented in previous commentaries. The Big Banks and bankers have also confessed to this manipulation.
As Chairman of the Federal Reserve, Alan Greenspan confessed (in official testimony) that Western central banks “stand ready” to manipulate the price of gold, any time the price begins to rise. The Big Banks have already confessed to rigging both the gold fix and the silver fix, but that hasn’t stopped them from continuing to “fix” the fixes. Numerous other forms of price manipulation remain unexposed.
Such sustained, systemic price manipulation has, in turn, produced large supply deficits in both the gold and silver markets. In the case of silver, evidence has emerged suggesting that this market has had a sustained supply deficit for 30 years. It is these supply deficits which ensure there must be an upward revaluation in the price of these metals – to restore equilibrium to these markets. The longer this disequilibrium is maintained, the longer and stronger will be the upward revaluation in price.
For all of these reasons; many investors in gold and silver bullion have a difficult time identifying any other asset class which offers similar security and upside potential, in a time of grave economic uncertainty. We hold bullion as our insurance against currency debasement, economic calamities, and political strife. However, what do investors do with the remainder of their investment portfolio?
What about investors who also want a growth component for their portfolios while still keeping all of their wealth in the precious metals sector? [remove bold face when publishing] The solution to this conundrum can be identified in one, simple phrase: diversify within the sector.

Posted Nov. 22, 2016, 11:54 AM
In yesterday’s alert we wrote that staying on the sidelines appeared to be a good idea for the next several days as the short-term outlook became more bullish, even though the medium-term outlook became more bearish (due to the USD’s breakout). Actually, at the moment when our yesterday’s alert was sent, gold’s and silver’s prices were below the entry prices, so the position was closed at a profit.
In yesterday’s session, not much changed – the USD declined a bit, while the opposite was the case with gold, silver and mining stocks. Nothing extraordinary took place.
However, today’s pre-market trading is more interesting. The USD Index is basically flat, but silver jumped up almost $0.30, showing strength. Gold is up as well. The above relative price moves confirm that the precious metals sector really wants to move higher in the short term, and that until it does, daily declines will be limited. Let’s take a look at the USD Index chart (charts courtesy of http://stockcharts.com).
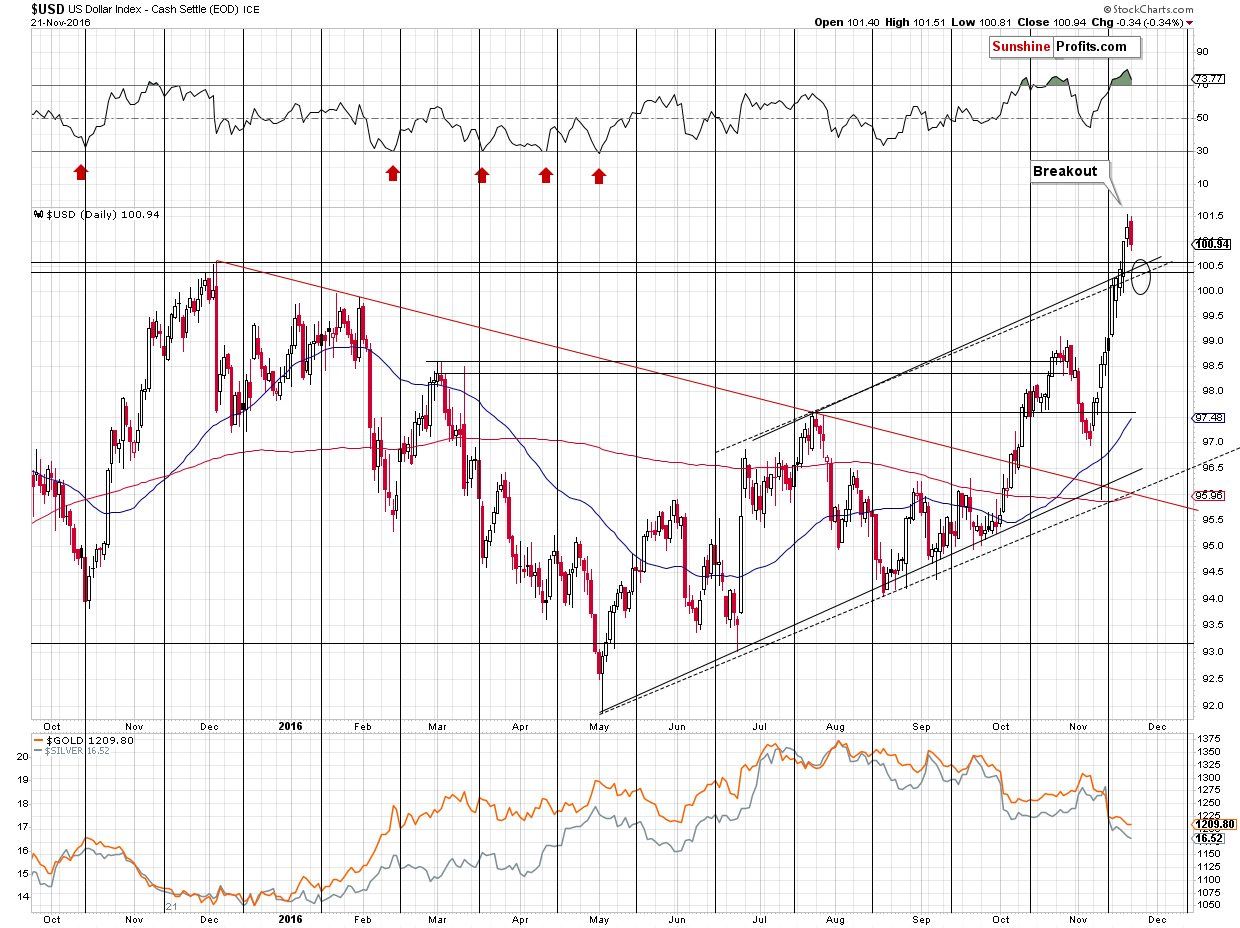
What’s likely to happen next? The USD Index is likely to verify the breakout above the previous highs. The support levels are between 100 (an extremely round number) and 100.60 (intra-day December 2015 high), which is a quite wide area, so the specific target is unclear, so it doesn’t seem that we can base our entry point in metals and miners on the USD Index alone. We can, however, look for confirmations from the precious metals themselves once the USD is within the target area.
Two very important confirmations would be: the miners’ underperformance and silver’s very short-term outperformance. Another thing would be gold moving a bit above its 300-day moving average (for instance to $1,250).

In addition to moving to the previous 2016 lows, gold moved to the 300-day moving average and the declining red support line – the upper border of the previous trading channel. Consequently, it’s no wonder that we saw a pause here. Does the above imply that a big turnaround will be seen shortly? Not necessarily. The analogy to 2013 remains in place, so we could see some strength, but it’s likely to be limited. In the case of gold, we can expect a rally that is similar to the rally that took place at the end of 2012 and in early 2013. Back then gold moved a bit above the 300-day moving average and to a round number ($1,700). At this time, an analogous move, would take gold to about $1,250. $1,300 could also be seen, but we don’t view it as likely – the move higher would be too big to be similar to what happened in early 2013 and it doesn’t seem that the USD Index would decline significantly enough, to trigger such a big rally in gold.
While we’re at gold’s long-term chart, let’s take a moment to once again briefly go through the “why isn’t the bottom already in” question. In short, because the gold market was not hated enough back in late 2015. Major tops and major bottoms are formed when everyone and their brother gets on a given side of the market. At the top, everyone wants to buy. At the bottom, everyone wants to sell and thinks that the price will fall much further. We’ve been monitoring surveys, predictions, headlines, website traffic, popularity of gold-related search terms in search engines and it doesn’t seem that gold is really hated enough for this to be the final bottom. Naturally, local tops and bottoms need to take place every now and then regardless of the bigger trend, as no market can move up or down in a straight line. There were local bottoms in 2013, in 2014 and in 2015. Why would the December 2015 bottom be THE bottom if it weren’t accompanied by extreme pessimism?
Some may say that the size of the rally that followed confirms that it was indeed the final bottom. We disagree – there were 2 very good reasons for this temporary upswing to be bigger than the previous ones – the NIRP remarks that were not followed by any NIRP-related action and the Brexit surprise (Brexit hasn’t really happened up to this day). If these events hadn’t happened, gold’s rally would have probably been no different than the previous local rallies that we saw in 2013, 2014 and earlier in 2015.
So, if the final bottom is not yet in, then where is gold likely to bottom? This is where technical levels come into play. We have two target areas – one is close to the $1,000 level and the second one is close to the $900 level. These targets will be updated as we move closer to them, but that’s what appears most likely at this moment. Why the former? A combination of a declining medium-term support line and $1,000 as a very round number provides good support. Why the second? There is one reason, but an extremely important one – the 61.8% Fibonacci retracement level. The Fibonacci retracement levels have proven to be a very useful tool in case of the precious metals market and the 61.8% retracement is one of the most important, classic ones. The other 2 (out of 3): the 38.2% retracement and the 50% retracement were already broken, so now the 61.8% retracement becomes a natural, very important target. The important thing is that as long as this level is not broken decisively and the breakdown is not confirmed, from the technical point of view, the entire 2011 – 2016/2017 decline will simply be a big correction after the 2000 – 2011 rally, and not a beginning of another bear market.
Summing up, we are likely to have good technical and fundamental reasons to think that gold will move much higher in the coming years, but we also have good technical reasons to think that gold will move lower in the following months. As far as the short term is concerned, it still seems that we could see higher prices, with $1,250 as a target for a top in gold as the USD Index verifies its recent breakout. It seems likely that the above would create a good opportunity to re-enter speculative short positions and further increase our profits, however, it’s too early to say so today.
The above estimations are based on the information that we have available today (Nov. 22, 2016). We will be monitoring the market for opportunities and report to our subscribers accordingly. If you’d like to join them, please use this link to subscribe now.
Thank you.
Sincerely,
Przemyslaw Radomski, CFA
Founder, Editor-in-chief, Gold & Silver Fund Manager
The US$ oil price and the Canadian Dollar (C$) have tracked each other closely over the past 2 years. When divergences have happened they have always been eliminated within a couple of months, usually by the oil market falling into line with the currency market.
In a 25th May blog post I wrote that an interesting divergence had developed over the preceding few weeks between these markets, with the C$ having turned downward at the beginning of May and the oil price having continued to rise. This suggested that either the currency market was wrong or the oil market was wrong. As I stated at the time, my money was on the oil market being wrong. In other words, I expected the divergence to be eliminated via a decline in the oil price.
The oil price was $49 at the time. Over the ensuing two weeks it moved a little higher (to $51) and then dropped by 20% within the space of two months. The result was that by early-August the gap between the oil price and the C$ had been fully closed.
The oil price and the C$ then traded in line with each other for about 6 weeks before another divergence began to develop. Again it was the oil market showing more strength than was justified by the currency market, and by early-October it was again likely that there would be a gap-closing decline in the oil price.
As expected, there was a significant decline in the oil price from mid-October through to early-November. However, the following chart shows that the gap was only partially eliminated and that a rebound in the oil price over the past 1-2 weeks has potentially set the stage for another significant gap-closing move.
I won’t be surprised if the oil price trades a bit higher within the coming two weeks, but my guess is that it will drop to the $30s within the coming three months.

![]()
…more from Steve: The prices of US government debt securities have been falling since early-July and plunged over the past two weeks. This prompts the question: Where did all the money that came out of the bond market go?

I’ve been in the financial industry a long time, and I’m continually amazed at the market’s astuteness in making reliable, actionable forecasts.
Consider the run-up to this year’s election. Nearly every poll pointed to Hillary Clinton taking the White House, with many pegging her chances at greater than 90 percent. The market took these prognosticators to task. Historically, when the S&P 500 has turned negative between July 31 and October 31, it’s spelled doom for the incumbent party candidate. This year, the market fell more than 2 percent, setting the stage for a Donald Trump victory.

A thought-provoking Atlantic article asserts that “the press takes [Trump] literally, but not seriously; his supporters take him seriously, but not literally.” This is ostensibly how many Trump supporters were able to excuse his more off-color language and instead focus on his proposals. Markets were willing to do the same.
Now, those same markets seem to be placing their bets on the likelihood that Trump’s “America First” policies will benefit small-cap companies especially.
The media is already calling it the “Trump rally.” As I write this, the Dow Jones Industrial Average closed above 19,000 for the first time ever, with the S&P 500 Index and Nasdaq Composite Index having recently set all-time highs.
But small-cap stocks have fared even better. Since Election Day, the small-cap Russell 2000 Index has made “big league” gains, surging more than 11 percent and hitting a record high. The index has been up for 13 straight days—its best run since 1996.

But why are investors focused on small-cap stocks specifically? Simply put, a bet on domestic small caps is a bet that Trump will deliver on his promise to “make America great again.”
Making Domestic Stocks Great Again
The president-elect’s proposals are aggressively inward-facing, which bodes well for companies with little foreign exposure. As a group, small caps have far less exposure to foreign markets than larger, multinational companies do. Because they rely a lot less on exports, they’re not as negatively affected by a strong U.S. dollar, which has the effect of making American-made products more expensive for foreign buyers.
Today the dollar is trading at 14-year highs, with expectations of moving even higher after a possible rate hike next month, followed by Trump’s inauguration in January.

According to his website, Trump plans to create at least 25 million new jobs over the next decade and grow the economy at 3.5 percent per year on average. He will manage to do this, he says, by lowering taxes and “scaling back years of disastrous regulations unilaterally imposed by our out-of-control bureaucracy.” As I’ve shared with you before,regulations cost the U.S. economy approximately $2 trillion a year.
The president-elect also plans to spend as much as $1 trillion on infrastructure over the next 10 years, which the market has responded to approvingly.
This market behavior is yet another example of the “wisdom of crowds,” which I’ve discussed numerous times before. In one of my favorite books, 2005’s The Wisdom of Crowds, business writer James Surowiecki convincingly makes the case that large groups of people will nearly always be smarter and better at making predictions than an elite few.
The Wisdom of Investors
At first blush, this idea might seem counterintuitive. We’ve all heard of mob mentality. Indeed, giant crowds of people are sometimes capable of making impulsive, irrational and destructive decisions. Think of the Salem witch trials, which ended with the execution of 20 people, or the Holocaust.

But Surowiecki’s thesis says that large groups of diverse and independently-deciding people—investors, for instance—are far better at analyzing and aggregating mass amounts of information than individuals, even experts.
As an example, Surowiecki explores the market’s now-famous response to the tragic Challenger shuttle explosion in 1986. In the minutes following the televised disaster, “investors started dumping the stocks of the four major contractors who had participated in the Challenger launch: Rockwell International, which built the shuttle and its main engines; Lockheed, which managed ground support; Martin Marietta, which manufactured the ship’s external fuel tank; and Morton Thiokol, which built the solid-fuel booster rocket.”
One of these names, however, was hit the hardest—Thiokol. By the end of the trading day, it was down almost 12 percent, more than six standard deviations in the three months before the explosion, according to economists Michael Maloney and Harold Mulherin. What the market seemed to be saying is that Thiokol was to blame.

The thing is, there had been no public comments implicating the now-defunct manufacturer. It wouldn’t be for another six months, during a presidential commission hearing on the disaster, that evidence was released showing Thiokol’s O-ring, which is supposed to prevent hot gases from escaping the booster rockets, had been faulty.
On that day, Surowiecki writes, the stock market was “working as a pure weighting machine, undistorted by the factors—media speculation, momentum trading and Wall Street hype—that make it a peculiarly erratic mechanism for aggregating the collective wisdom of investors.”
Similarly, the market in 2016 managed to cut through the ugly campaign noise and rhetoric to select the candidate who eventually emerged as victor. And now, they appear just as convinced that Trump’s policies can unleash American growth and ingenuity.
All opinions expressed and data provided are subject to change without notice. Some of these opinions may not be appropriate to every investor. By clicking the link(s) above, you will be directed to a third-party website(s). U.S. Global Investors does not endorse all information supplied by this/these website(s) and is not responsible for its/their content.
The S&P 500 Stock Index is a widely recognized capitalization-weighted index of 500 common stock prices in U.S. companies. The Dow Jones Industrial Average is a price-weighted average of 30 blue chip stocks that are generally leaders in their industry. The Nasdaq Composite Index is a capitalization-weighted index of all Nasdaq National Market and SmallCap stocks. The Russell 2000 Index is a U.S. equity index measuring the performance of the 2,000 smallest companies in the Russell 3000. The Russell 3000 Index consists of the 3,000 largest U.S. companies as determined by total market capitalization.
Standard deviation is a measure of the dispersion of a set of data from its mean. The more spread apart the data, the higher the deviation. Standard deviation is also known as historical volatility.
Holdings may change daily. Holdings are reported as of the most recent quarter-end. The following securities mentioned in the article were held by one or more accounts managed by U.S. Global Investors as of 9/30/2016: Lockheed Martin Corp.
U.S. Global Investors, Inc. is an investment adviser registered with the Securities and Exchange Commission (“SEC”). This does not mean that we are sponsored, recommended, or approved by the SEC, or that our abilities or qualifications in any respect have been passed upon by the SEC or any officer of the SEC.
This commentary should not be considered a solicitation or offering of any investment product.
Certain materials in this commentary may contain dated information. The information provided was current at the time of publication.

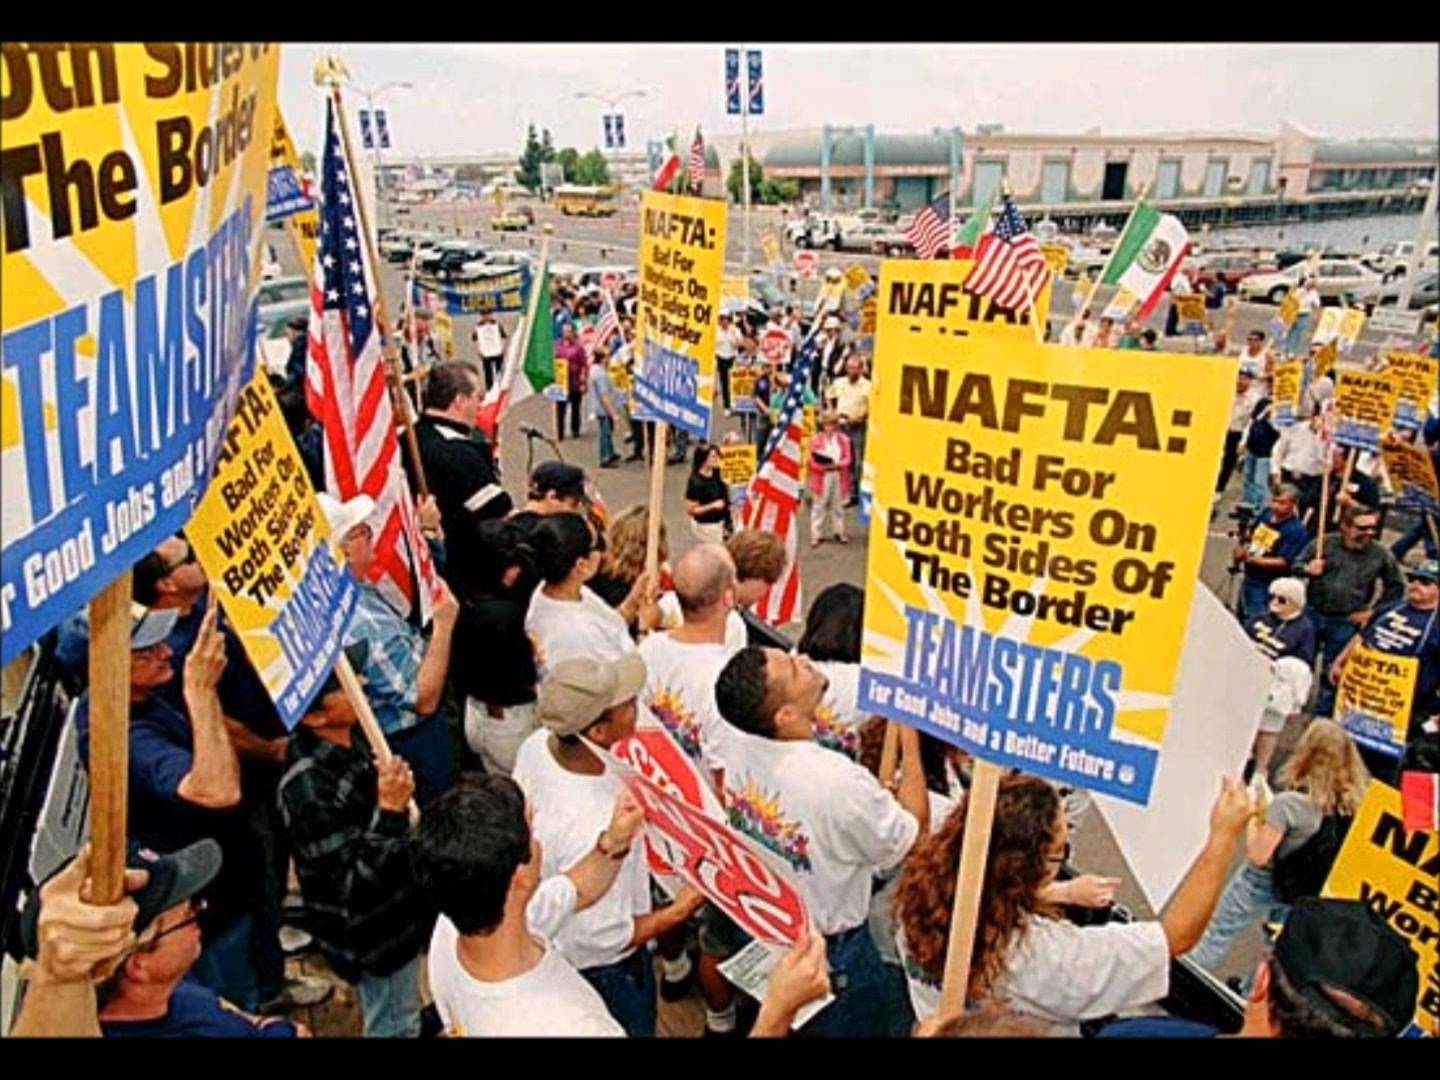
Trump, organized labour, the NDP and the rest of the progressive left want to get on board with national tariffs, making foreign goods more expensive for the consumer. Protecting jobs is the object even though a far greater attack on jobs comes from technological change for one. There are greater threats to jobs than NAFTA which is in Trumps gunsights. Besides, anything the Teamsters union is in support of is not likely to be in Canadian Citizens interest.
…more from Michael: A Dangerous Dark Storm Brewing

-
I know Mike is a very solid investor and respect his opinions very much. So if he says pay attention to this or that - I will.
~ Dale G.
-
I've started managing my own investments so view Michael's site as a one-stop shop from which to get information and perspectives.
~ Dave E.
-
Michael offers easy reading, honest, common sense information that anyone can use in a practical manner.
~ der_al.
-
A sane voice in a scrambled investment world.
~ Ed R.
Inside Edge Pro Contributors

Greg Weldon

Josef Schachter

Tyler Bollhorn

Ryan Irvine

Paul Beattie

Martin Straith

Patrick Ceresna

Mark Leibovit

James Thorne

Victor Adair