
Economic Outlook
This weeks shocking stat: With all the outrage about Donald Trumps plans to de-port criminals, there is a President that has de-ported more in 8 years than all Presidents to date. The numbers are in the millions. Care to guess who?
….Michael’s featured guest Dr. Michael Berry PhD: The Fed is Throwing Up Its Hands


While we expected additional weakness in Gold and gold stocks (weeks ago) we did not quite expect the kind of selling the sector experienced in the wake of Donald Trump’s election victory. The market reacted by sending bond yields dramatically higher which resulted in stronger real interest rates, which is fundamentally negative for precious metals. This has created significant technical damage in the sector and has potentially thrown the 2016 bull off course.
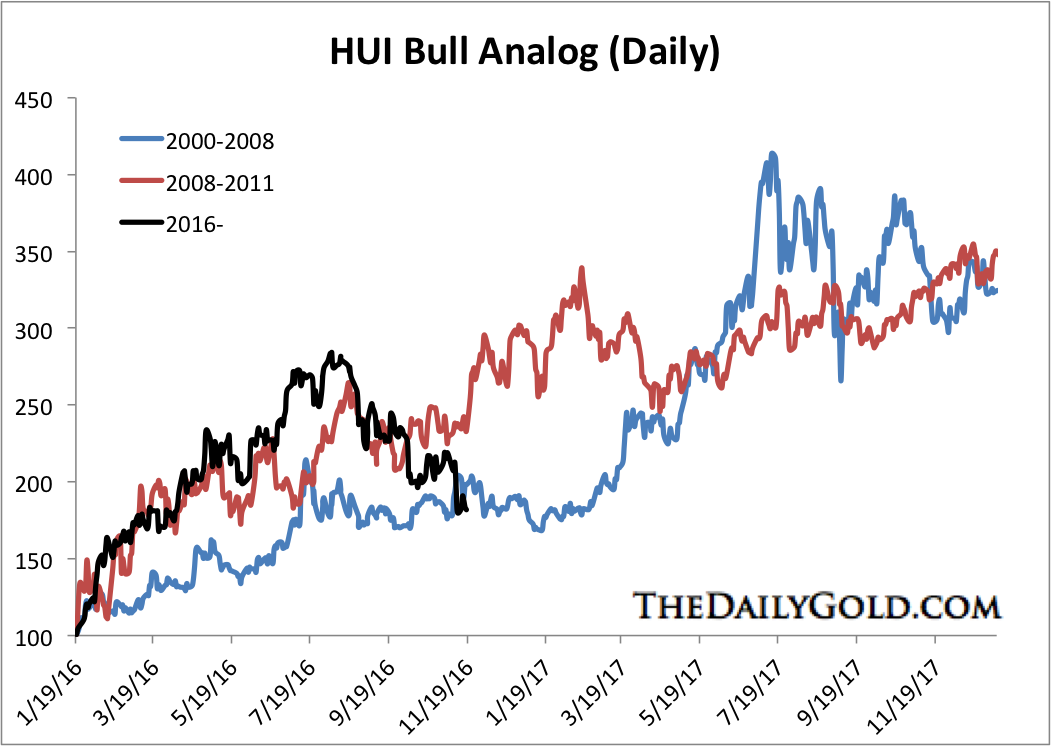
Our first chart shows how and when this bull market went off course. Below we compare the current rebound in Gold to some of those from the past. As you can see, the 2016 rebound was well on course until the second half of September. That is when historical bull markets pushed higher. Unfortunately, Gold broke lower and has continued to trade lower. It has diverged from its bull market course.

Our next chart pertains to the bull market in gold stocks and specifically the HUI Gold Bugs Index. The chart shows that this needs to be an important low for the bull market to remain intact. While I expect a rebound very soon, I have some doubts that the low will hold.
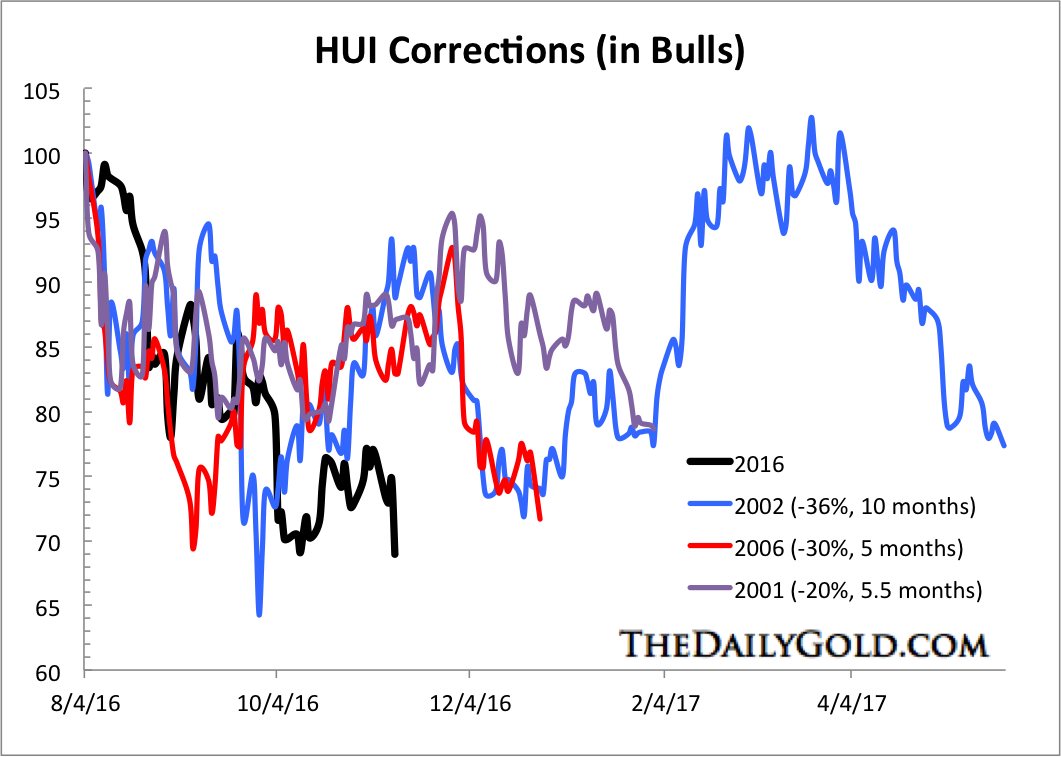
Next we compare the current correction in the HUI to past bull market corrections. Like the last analog, this one shows the gold stocks need to begin a big rebound for their bull market to remain intact. Both analogs show that the gold stocks cannot go lower from here if they are to remain in a bull market.
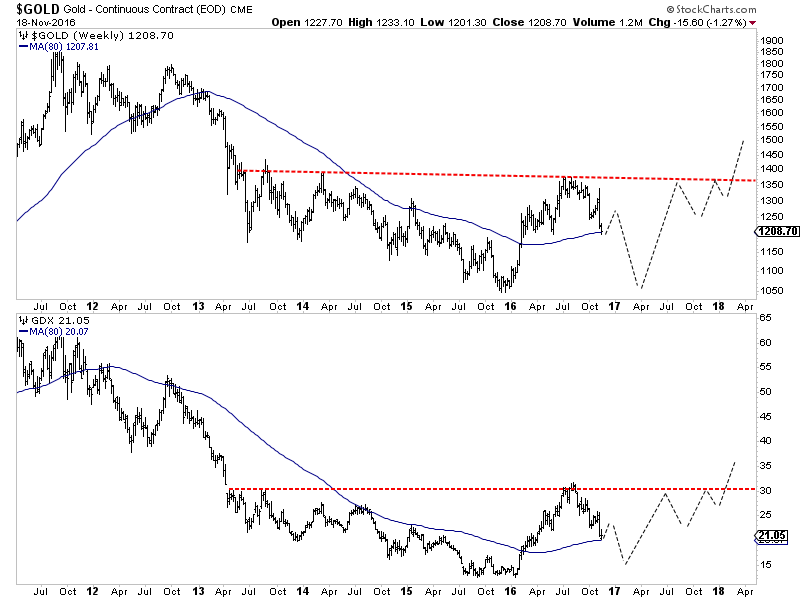
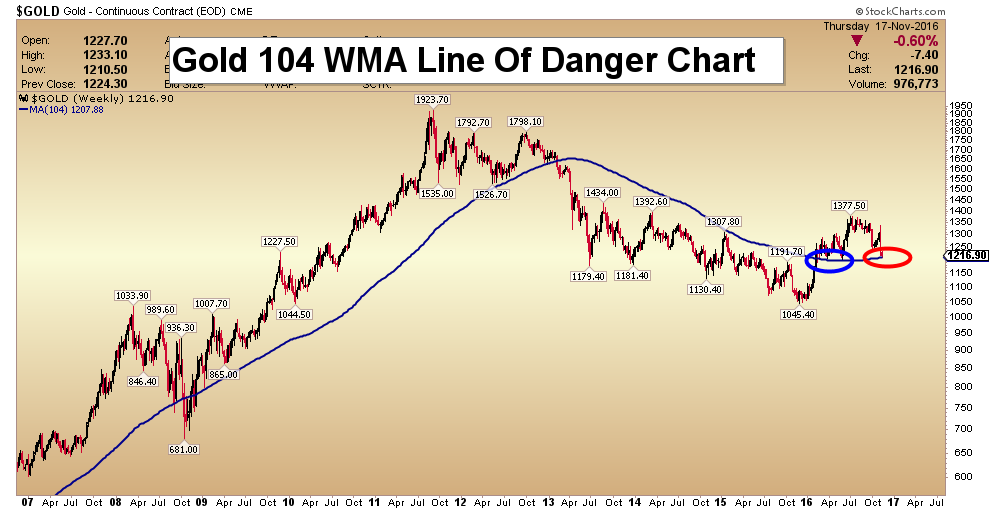
Both history and current price action argue that Gold and gold stocks are at risk of a big decline if they lose the current lows. If Gold loses $1200/oz then it could drop quickly to $1080/oz or even $1050/oz, the major low. The same can be said for GDX which bounced from its 62% retracement and 80-week moving average at $20. Below I have sketched out how this bearish scenario could play out. Note, this sketch is purely subjective and subject to change.
Unless Gold and gold stocks hold current levels and form an important low then the 2016 bull market has gone off course. At present, the evidence favors the bearish scenario which has the sector trading lower in the months ahead. We could chalk this up to a fundamental change (which I consider to be temporary) coupled with the potential for a spike in the US Dollar. Investors are advised to de-risk their portfolios during the coming rebound and prepare for a better buying opportunity at the end of winter.
….related:
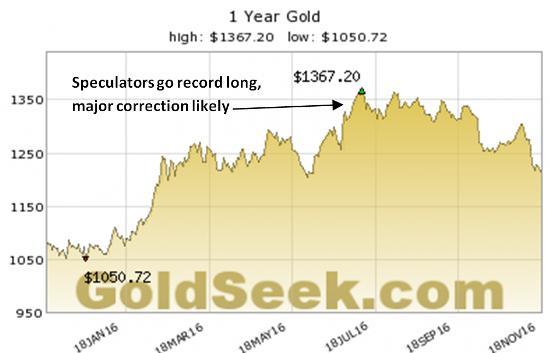
Speculators Are Finally Bailing Out Of Gold – And That’s A Good Thing
“As gold rose, the futures contract traders whose games tend to dictate near-term price action had set the metal up for a fall. Specifically, the speculators (who are always wrong at the extremes) were ridiculously long. With the suckers all-in, a big correction was needed to restore balance.
But it didn’t come. Several months passed with gold treading water, leading some to wonder if the paper market tail had finally stopped wagging the physical market dog.”
…continue reading to see the Committment of Traders Report HERE
…related:
Morris Hubbartt’s Gold’s Downtrend: Key Trading Tactics

Today’s videos and charts (double click to enlarge):
Gold & Silver Bullion Video Analysis
Precious Metal ETFs Video Analysis
Stock Markets & Bonds Video Analysis
SF Juniors Key Charts Video Analysis
SF60 Key Charts Video Analysis
SF Trader Time Key Charts Video Analysis
Thanks,
Morris
website: www.superforcesignals.com
The SuperForce Proprietary SURGE index SIGNALS:
25 Surge Index Buy or 25 Surge Index Sell: Solid Power.
50 Surge Index Buy or 50 Surge Index Sell: Stronger Power.
75 Surge Index Buy or 75 Surge Index Sell: Maximum Power.
100 Surge Index Buy or 100 Surge Index Sell: “Over The Top” Power.
About Super Force Signals:
Our Surge Index Signals are created thru our proprietary blend of the highest quality technical analysis and many years of successful business building. We are two business owners with excellent synergy. We understand risk and reward. Our subscribers are generally successfully business owners, people like yourself with speculative funds, looking for serious management of your risk and reward in the market.
….related:
Gold Commitments of Traders

 Why would an investor sell put options instead of just buying the stock? You already know my response to this question – to create monthly income. There are several reasons investors should include put writing as a portion of their investment portfolio. Here is my list:
First and foremost is to create income. In this case, we are looking to collect the cash premium from selling the put option and not necessarily purchase the stock. This concepts is very important to better understand. My initial objective is capturing the premium but I realize in some cases the stock will be put to me. This is why I only sell puts on a select list of stocks I am willing to own if put to me. I like to focus on world class stocks that have stable earnings, strong balance sheets, pay growing dividends and trade within a low beta range in the market. This is part of my success using this strategy as I can collect dividends and sell covered calls for more income if the stock is put to me.
Secondly, I can purchase the stock at a lower price or discount to its current market price. The cash premium I collect from selling the put option reduces the capital outlay to enter or purchase the stock. I have experienced periods where I would sell monthly puts on a stock for 6 to 9 months before the stock was put to me. The amount of premiums added together made the entry price of stock significantly below the market price. For example, assume I average premiums of $100 over 6 months of monthly put writing which sums to $600. I have just lowered the purchase price of the stock by $600 – this is buying stocks at a discount.
Lastly, I use put selling to create my favorite income strategy – the Put-Call-Dividend (PCD) Income Strategy. This is simple selling puts each month on a select stock to collect monthly income. If the stock gets put to me, then I sell covered call options for more income while also collecting dividends paid by the stock. I sell call options for premium each month until the stock is called away from me. Then, I will start selling puts against the stock again. This strategy is exactly why I only sell puts on stocks I want to own – world class, strong dividend stocks.
This is the best income strategy I use in today’s market. In the October expiration cycle, our subscribers made 1.6% for the month by selling put options. For the past 3 months, monthly returns range from 1.5% to 3.1%.
…for more strategies read the Monthly Income Newsletter
…related:


-
I know Mike is a very solid investor and respect his opinions very much. So if he says pay attention to this or that - I will.
~ Dale G.
-
I've started managing my own investments so view Michael's site as a one-stop shop from which to get information and perspectives.
~ Dave E.
-
Michael offers easy reading, honest, common sense information that anyone can use in a practical manner.
~ der_al.
-
A sane voice in a scrambled investment world.
~ Ed R.
Inside Edge Pro Contributors

Greg Weldon

Josef Schachter

Tyler Bollhorn

Ryan Irvine

Paul Beattie

Martin Straith

Patrick Ceresna

Mark Leibovit

James Thorne

Victor Adair