
Personal Finance
 QUESTION:
What is your view on the Indian government banning large denomination bills and why such a small window of time to get them turned in?
PB
ANSWER: Unfortunately, the theory is that cash prevents governments from maintaining negative interest rates. They want to “tax” the mere possession of money. Eliminate cash, and then they think they can stimulate the economy without creating inflation and they will be in total control. They view that the reason Marxist/Keynesian philosophy failed is because of cash. People can hoard money and thus exit the system. They cannot stop that unless they eliminate money.
This is what the NEW AGE of economics is all about. They next level of taxing you for merely having money. Indian Prime Minister Narendra Modi has announced that the 500 ($7.60) and 1,000 rupee banknotes will be withdrawn from the financial system overnight. This is all about taxes.
Everyone should pay attention here. Governments can simply cancel a currency overnight. The ECB wants to eliminate the 500 euro note and Larry Summers is arguing to end the $100 bill in the USA. These people want to tax everything and see that interest rates can be negative forever if they get rid of cash. They are totally insane.
….related:
War on Cash intensifies: Citibank to stop accepting cash at some branches
by Simon Black
Less than a week after India’s surprise move to scrap its highest denomination cash notes, another front in the War on Cash has intensified down under in Australia.
Yesterday, banking giant UBS proposed that eliminating Australia’s $100 and $50 bills would be “good for the economy and good for the banks.”

0riginally published on Nov 15, 2016, 10:01 AM
Trading position (short-term; our opinion): Long positions (with a stop-loss order at $41.39 and initial upside target at $49.53) are justified from the risk/reward perspective.
Although crude oil moved lower after the markets open, oil bulls stopped further deterioration and triggered a rebound in the following hours. As a result, light crude erased most of earlier losses and closed the day above Friday’s low. What can we expect in the coming days?
Let’s examine the charts below and try to find out (charts courtesy of http://stockcharts.com).

Looking at the weekly chart, we see that although crude oil moved little lower this week, the 50-week moving average continues to keep declines in check.
Are there any other technical factors that could encourage oil bulls to act in the coming days? Let’s examine the day and find out.

Yesterday, we wrote the following:
(…) Today’s move lower in crude oil below $43 (to about $42.50) could be viewed as a breakdown below the September lows, but we don’t view it as such – at least not yet. The reason is that today’s session is far from being over and the move below $43 was almost invalidated. Depending on the closing price, we could see (…) a reversal and invalidation of the intra-day breakdown, which would be very bullish.
From today’s point of view, we see that the situation developed in line with the above scenario and crude oil rebounded, invalidating the intra-day breakdown below the September lows, which is a bullish signal that suggests further improvement.
Additionally the current situation in the non-USD (WTIC:UDN ratio) chart of crude oil also supports the pro-growth scenario. Why? Let’s take a closer look at the charts below and find out.

From the weekly perspective, we see that although the ratio moved lower and erased almost all of the last week’ gains, the green support zone (reinforced by the 50-week moving average) continues to keep declines in check, which is a positive signal.

On top of that, the first thing that catches the eye on the daily chart is a positive divergence between the ratio and the price of crude oil. As you see, although the black gold hit a fresh low yesterday, we didn’t see such price action in the case of the ratio, which is a bullish signal that suggests further improvement. Why we think so? When we take a closer look at the above chart, we can notice a similar situation in September (both cases we marked with green rectangles). Back then such event encouraged oil bulls to act, which resulted in a rebound that finally took the ratio (and also crude oil) to fresh 2016 highs. Additionally, a buy signal generated by the CCI remains in place, supporting oil bulls and another attempt to move higher.
Therefore, if we see such price action, the upside targets from our Thursday’s alert would be in play:
(…) If (…) light crude extends gains, we’ll likely see an upward move to (at least) (…) the previously-broken red and black resistance lines (…)
Summing up, crude oil moved higher and invalidated earlier breakdown under the September lows, which in combination with the current situation in the WTIC:UDN ratio suggests that higher prices of the black gold are just around the corner.
Very short-term outlook: bullish
Short-term outlook: bullish
MT outlook: mixed
LT outlook: mixed
Trading position (short-term; our opinion): Long positions (with a stop-loss order at $41.39 and initial upside target at -$49.53) are justified from the risk/reward perspective.
Thank you.
….related:

Men are afraid to rock the boat in which they hope to drift safely through life’s currents, when, actually, the boat is stuck on a sandbar. They would be better off to rock the boatand try to shake it loose, or, better still, jump in the water and swim for the shore. – Thomas Szasz
 If we look at earnings and the underlying fundamentals, then it is easy to state that the stock market should have crashed a long time ago. Earnings are tepid and in many cases were it not for aggressive share buyback programs the outlook would look even more terrible. Regarding the economy, it is the strong stock market that helps support the illusion that the economy is doing well. Unofficially the unemployment rate is north of 20%. Why the huge discrepancy; the BLS (Bureau of Labour statistics) does not count individuals who have given up looking for a job even though they are unemployed. This paints a false picture of what is going on; many people are demoralised after trying in vain to land a new job that they have just given up. However, despite all these negative factors we have stated over and over again that this market is destined to trend higher. We provided many reasons for this in 2014, 2015 and 2016. The two most important of these are:
Hot money is supporting the market, and the Fed will not stop supporting this marketbecause it is the only factor that promotes the illusion of a healthy economy
This is still one of the most hated bull markets of all time- the crowd has not embraced this market, and no bull market has ever ended on a sour note
There is a massive amount of cash sitting on the sidelines; $50 trillion to be precise and this clearly cements the view that the crowd is far from euphoric. Until the masses are jumping in Joy, it is highly unlikely that the stock market will experience a crash.
Black Rock puts the figure at more than $50 trillion, a figure that includes a host of different metrics, from central-bank assets to financial-firm reserves and consumer savings accounts. Other measures show a similar trend. Private-equity firms are amassing greatpiles of liquid securities, with Blackstone saying that nearly one-third of its assets are in cash. Fund managers, in general, have boosted reserves as a share of their portfolios to levels that match the highest since 2001. Full Story
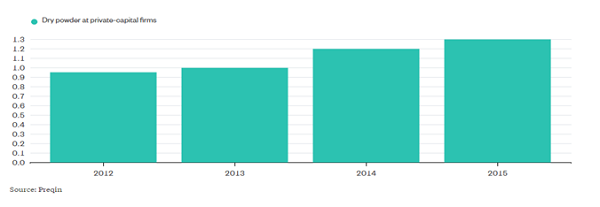
This chart shows that private equity firms are steadily building up their cash reserves; they have been waiting for the so-called fair valued market. A concept that makes absolutely no sense today; trying to assign a fair value on this market is the Joke of the century. Every trick has been used in the book to manipulate EPS and when you alter earnings every another key piece of data is becomes meaningless. The only thing to pay attention to in this period is mass sentiment and a few technical indicators.
This confirms what our psychological and sentiment indicators have been stating all along; the crowd is skittish even though the market is trading close to its highs. This is an unprecedented development, and it means that this bull market is going to soar to heights that only a man under the influence of some strong medicine could envision today. Slowly the term inflate to infinity will find its way into the mainstream media; this is the Fed’s secret new slogan.
Too many people are waiting for the so-called optimal entry point. Hence, the likely outcome is that they will be forced to chase this market as there is an excellent chance that this will not come to pass. These people are not looking for 1000-2000 point pullback; they are expecting more. Keep in mind what we recently stated before Trump won the elections
From a contrarian angle (and not a political point of view) a Trump win could be construed as a positive development; non-contrarians will demand to know why? Mass Psychology clearly states that the masses are always on the wrong side of the equation. A Trump win will create uncertainty, and the lemmings will flee for the exits; markets will pull back sharply and viola the same old cycle will come into play. The cycle of selling based on fear which equates to opportunity for those who refuse to allow their emotions to do the talking. Full Story
Secondly, the vast amount of cash sitting on the sidelines is going to serve as a floor; additionally, it provides clear evidence that the masses are nervous and skittish; thus the path of least resistance is up.
Conclusion
The pullback in the bond markets and the strong dollar rally have already produced the effect of at least two interest rate hikes. Thus it is unlikely that the Fed is going to adopt a rate hiking stance. A strong dollar is not good for multinationals and as the World’s central bankers have embraced” the devalue or die era”, the Fed has no option but to play along. Strong negative reactions should be music to your ears for the trend is up, and we have no choice but to look at these developments through a bullish lens. The stronger the pull back, the better the opportunity- end of story
Insanity is often the logic of an accurate mind overtasked.
Oliver Wendell Holmes
….related:
Tyler Bolhorn’s “You Are The Enemy” StockScores Newsletter including 2 Stocks that fit the Strategy of the Week
Also: Copper Calls Gold Bottom On Trumphoria Surge
Clive Maund’s Oil Market Update published Tuesday Nov 15th
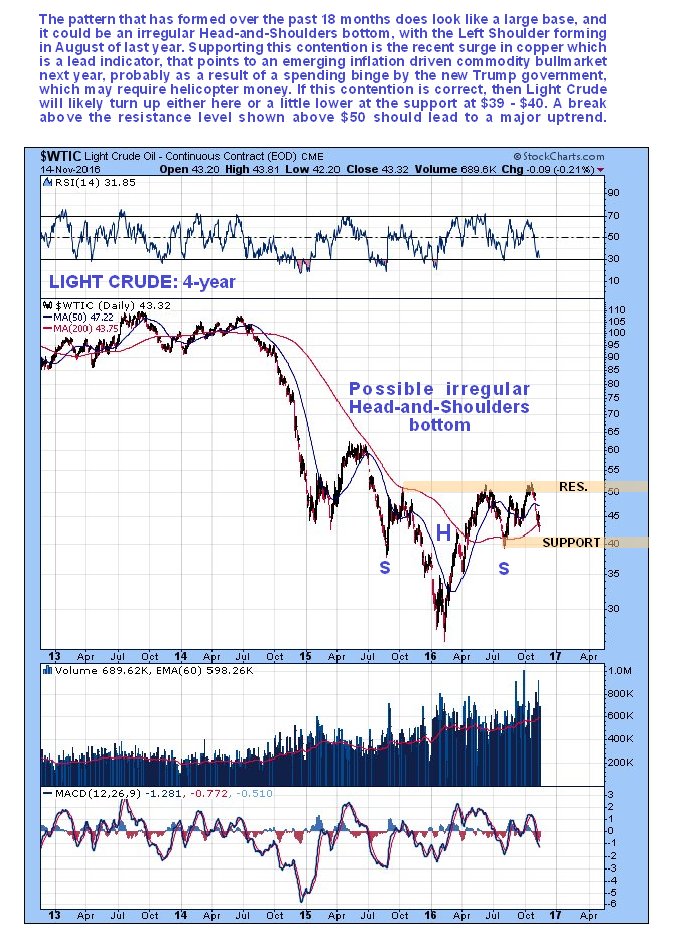
After the severe decline in the oil price in 2014 – 2015, which was partly motivated by the Neocon intention to crush the Russian economy as one prong of an asymmetrical warfare campaign that also involved sanctions and a military pressure, the price has marking out a potential base pattern since the middle of last year, as we can see on the 4-year chart for Light Crude shown below. The pattern is looking increasingly like an irregular Head-and-Shoulders bottom, and while it would obviously abort and the price break to lower levels in the event that a general market crash manifests, it is clear that the pattern has the potential to support a substantial bullmarket. This it is interesting to observe the strongly bullish action in copper over recent weeks, which points to a general commodity bullmarket taking hold next year, even if copper is short-term overbought and has signaled that it needs to take a breather. Whilst we can speculate about what may bring this on, it is clear that the election of Trump with his grandiose plans for rebuilding America is likely to be a big factor, although how he plans to finance all this is another matter – probably by means of “helicopter money”, which will mean increasing inflation and a commodity bullmarket, especially in gold and silver, that will also be positive for the oil price. For several months the price has been tracking sideways in a trading range bounded by the support and resistance shown, and right now it may be marking out a second Right Shoulder low of the prospective giant Head-and-Shoulders bottom. A clear breakout above the resistance at the top of this range will be a major technical event that will signal a new bullmarket in oil.
….continue reading more and view the charts on the Oil Market Update HERE
…also read Copper Calls Gold Bottom On Trumphoria Surge


No wonder gold got clocked like it did!
Hedge funds were actually busy adding more longs and covering shorts over the past week’s reporting period. As soon as those downside support levels were taken out after the election results were digested, gold bulls were getting mauled in a big way.

As you can see, every single speculative category remains net long as of last Tuesday. A great number of those longs are either underwater or have already been liquidated.
I am more anxious to see this coming Friday’s report to be honest as that will contain the positioning changes AFTER the election; that is what will be most important. Suffice to it say that an awful lot of people bet on the wrong direction for a gold move and they are now paying the price.
Additionally, we had yet another drop in reported gold holdings in GLD this afternoon.

The last three trading days have seen GLD disgorging more than 30 tons of gold! Holdings are back at levels last seen in June of this year.
Based on what I can now see taking place in GLD, rallies in gold are going to be sold. Western-based investors are getting out and are moving into equities ahead of next year.
Since the metal has dropped so far, so quickly, I would not be surprised to see a bit of a bounce down here especially now that it has been able to hold initial support levels above $1200 but there are a myriad of gold negative fundamentals now in place. China and India can probably offer it some downside support but as far as any sort of sustained rallies go, there is nothing that I can see at this juncture which would lead me to believe that is likely, especially with the US Dollar moving the way it is.
By the way, those calling for hyperinflation and gold prices in the stratosphere as a result had best come up with a intelligent explanation as to why the US Dollar is going to fall apart in an environment in which the US is the only major Western industrialized nation where interest rates are rising and where growth prospects look the best.
I think one can easily make the case that if a Trump administration brings in with it a real stimulus program, such as the infrastructure plan I see being discussed, along with regulatory reform, US growth prospects are going to be looking rather good. That by itself could very well induce the Fed to move interest rates higher at a FASTER PACE than the market initially envisioned in order to nip off any nascent inflationary pressures. Such a development would bring even more support into the US Dollar.
By the way, as a sort of side note to this.. look at how quickly hedge funds have going from a net short position in copper to a net long one! And most of this took place AHEAD of the election results! Yikes!


-
I know Mike is a very solid investor and respect his opinions very much. So if he says pay attention to this or that - I will.
~ Dale G.
-
I've started managing my own investments so view Michael's site as a one-stop shop from which to get information and perspectives.
~ Dave E.
-
Michael offers easy reading, honest, common sense information that anyone can use in a practical manner.
~ der_al.
-
A sane voice in a scrambled investment world.
~ Ed R.
Inside Edge Pro Contributors

Greg Weldon

Josef Schachter

Tyler Bollhorn

Ryan Irvine

Paul Beattie

Martin Straith

Patrick Ceresna

Mark Leibovit

James Thorne

Victor Adair