


A number of subscribers have written in asking about the technical state of the broad U.S. stock market, which we haven’t looked at for a while. With the failure of an important support level a few days back and the election drawing near, it’s certainly a timely question.
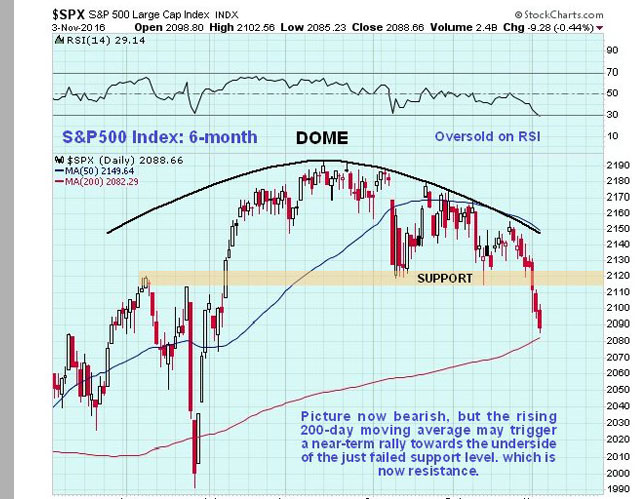
We’ll start by looking at a 6-month chart for the S&P500 index, on which we see that early this week, forced lower by the “distribution dome” shown, it broke down below important support. Ideally, we should have shorted it on its last approach to the dome boundary after the middle of October, but we missed the chance. Now it has already arrived at its rising 200-day moving average, which may generate a near-term bounce back up to the failed support; this is now resistance, where the market may again be shorted, perhaps by means of puts in something like SPDR S&P 500 (SPY).
Here we should note that despite the 200-day moving average still rising, this is now a weak picture, for reasons that become clearer on the 1-year chart. In any case, if the market continues to drop, the 200-day moving average will quickly roll over and turn down.
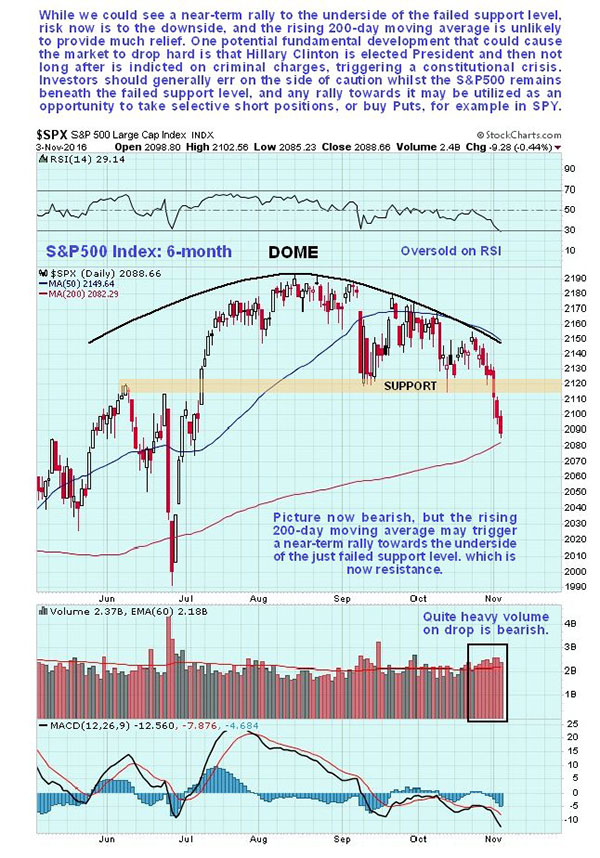
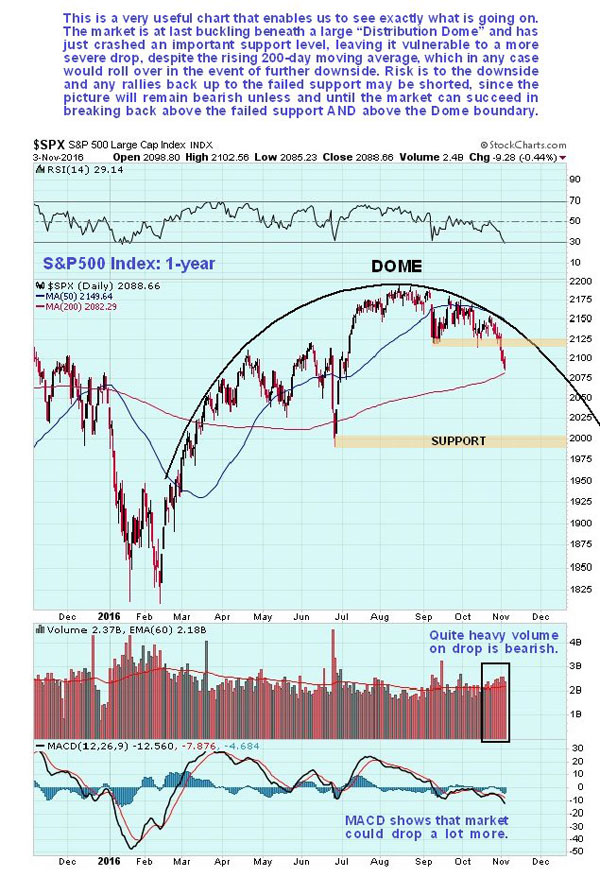
On the 1-year chart all becomes clear, and we see why the market is now dropping away. It is being forced into retreat by the fine, large dome pattern shown now pressing down on it from above—this is what triggered the support failure early this week. Volume has been persistently heavy on this drop, which is bearish, and the moving average convergence/divergence (MACD) indicator shows that there is plenty of room for it to drop further. An immediate downside target is the support shown in the 2000 area.
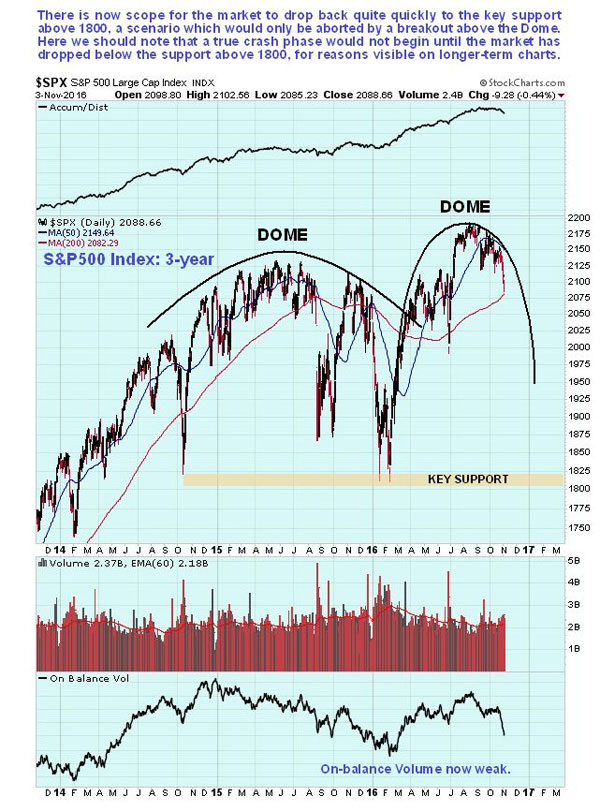
The 3-year chart shows that the current dome is the successor to an earlier one that took much longer to form. The earlier dome forced the index to plunge back toward 1800 early in the year, after the Fed’s foolish and tiny interest rate rise last December, but aborted soon after. This illustrates that these domes can and quite often do abort. The crucial point is that until they do, the trend can be assumed to be down, and knowledge of the position of a dome boundary enables the judicious placing of overhead stops to protect any open short positions.
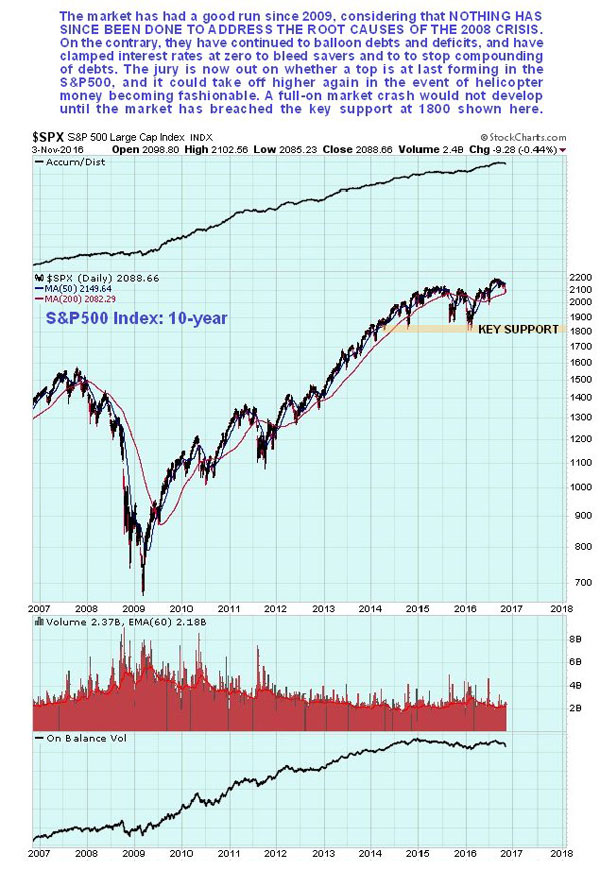
The 10-year chart is useful as it puts the action of recent years into perspective. On this chart we can see that a potential top area is forming, but that it won’t be confirmed as such unless and until the index breaks below the key support at and above 1800, which we already looked at on the 3-year chart.
If this support does fail, it would usher in a true crash phase, and the risk of a near vertical plunge. One fundamental scenario that could trigger this would be a constitutional crisis arising from Hillary Clinton first being voted into the presidency, and then being indicted as a criminal. Although it may seem farfetched, this is not beyond the bounds of possibility. Outside of the U.S., Clinton is widely perceived to be a liar, a crook and a warmonger, who has only escaped prosecution thus far because of cronyism and nepotism—she is above the law. Many average voters are simply too ignorant and insouciant to comprehend what she is really like—many do though, to a greater or lesser degree, and will only vote for her because they like Trump even less.
However, even inside the U.S., the intelligence community and various others that she has crossed and insulted are deeply fed up with her, and they have recently been supplied with all the ammo they need to bring her down, if they so choose. And that could happen fast.
Returning to the 10-year chart, the key support shown may not fail. In the event that so-called helicopter money becomes fashionable, it could take off again and advance to new highs, regardless of the state of the economy.
Conclusion
The trend of the market is down, and it may be traded to the downside as long as the S&P500 index remains below the dome shown on its 1-year chart. A near-term bounce toward this will throw up a shorting opportunity. There exists the possibility of a more severe decline setting in soon.
Clive Maund has been president of www.clivemaund.com, a successful resource sector website, since its inception in 2003. He has 30 years’ experience in technical analysis and has worked for banks, commodity brokers and stockbrokers in the City of London. He holds a Diploma in Technical Analysis from the UK Society of Technical Analysts.
Disclosure:
1) Statements and opinions expressed are the opinions of Clive Maund and not of Streetwise Reports or its officers. Clive Maund is wholly responsible for the validity of the statements. Streetwise Reports was not involved in the content preparation. Clive Maund was not paid by Streetwise Reports LLC for this article. Streetwise Reports was not paid by the author to publish or syndicate this article.
2) This article does not constitute investment advice. Each reader is encouraged to consult with his or her individual financial professional and any action a reader takes as a result of information presented here is his or her own responsibility. By opening this page, each reader accepts and agrees to Streetwise Reports’ terms of use and full legal disclaimer. This article is not a solicitation for investment. Streetwise Reports does not render general or specific investment advice and the information on Streetwise Reports should not be considered a recommendation to buy or sell any security. Streetwise Reports does not endorse or recommend the business, products, services or securities of any company mentioned on Streetwise Reports.
Charts provided by Clive Maund

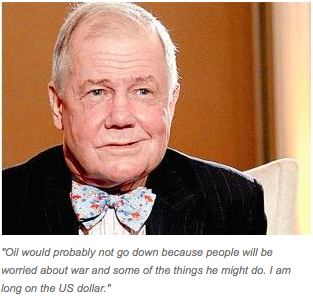 In an interview with ET Now, Jim Rogers, author, Street Smarts: Adventures on the Road and in the Markets, says though he registered a protest vote and did not vote for either Clinton or Trump, he thinks Trump will likely triumph over Hillary Clinton in US presidential elections.
 “grab your socks. We are off for a bit of volatility. Keep in mind Trump would be great for a domestic market rally. Cutting corporate taxes to 15% will bring home $3 trillion to say the least. The Reagan Tax Cuts resulted in the Dow rising 600%. Tax increases, have ALWAYS resulted in declines. That is the blunt reality that Washington fights.”


