
Currency
 The Canadian dollar has weakened and is back above the 1.32 line on Tuesday, after posting strong gains in the Monday session. Currently, USD/CAD is trading slightly above the 1.32 line. On the release front, Canada will publish Housing Starts, with the indicator expected to improve to 194 thousand. In the US, there are no major releases on the schedule.
On Wednesday, the Federal Reserve will release the minutes of its September policy meeting, in which it held rates at 0.25 percent. As well, FOMC members William Dudley and Esther George will speak at public engagements.
….related:


Not a day passes without OPEC making oil and gas headlines, and today is surely no exception. Seemingly in lockstep with OPEC, the market is once again pacified on the promise that changes to the global oil supply glut are a’ comin’.
Yesterday, the Wall Street Journal quoted anonymous sources close to the matter who had it on good authority that the Saudi’s were willing to cut “up to” 400,000 barrels per day (and that they had planned to do so all along, with or without an OPEC agreement). We can assume this figure is off August or September levels, which are near-record highs for the oil-rich country.
Of course, there are 400,000 different possible production cut figures included in this “up to 400,000” range — including a big fat zero — so fundamentally speaking, like so much of the OPEC speak, this could mean nothing.
But this isn’t the first time OPEC chatter or supposition or guesswork has moved markets, and it won’t be the last. Because, as Oilprice contributor Rakesh Upadhyay pointed out back in August, just a month before the freeze was announced, fundamentals aren’t what’s driving the oil market — speculation is. And nothing feeds speculators like OPEC.
As Upadhyay wrote, “Though most analysts agreed that a production freeze was not going to alter the fundamentals, prices rose sharply, with the hedge funds adding record long positions,” as evidenced by the chart below, which shows what happened in February when OPEC cuts were on the table for Doha. Fundamentals didn’t change — the glut wasn’t easing — yet hedge funds and speculation on OPEC rumors drove up prices.

The hope quickly faded when the Doha meeting fell short of expectations, but prices continued to climb. Then, the market found new hope in the Vienna meeting. We then wondered — this time quite wistfully — if a freeze could… maybe, possibly… happen in that meeting over the summer, much in the same way one might hold onto hope that we might someday win the lotto. Our hopes were dashed yet again — but not before the market reflexively inched up again.
Soon after, Saudi comments, which indicated that a new spirit of cooperation among OPEC members might be taking shape, sending prices upward yet again. An unofficial meeting was announced. Algiers, they said. “Stabilize the market” they said (which can apparently be done with talk, rather than production cuts). Russia chimed in, vacillating between joining the “market stabilization” efforts and not. We asked ourselves, this time ever more cautiously, dare we hope again? Most thought not, but speculators threw caution to the wind, moving markets this way and that on almost a daily basis in response to every utterance regarding the freeze.
Then the announcement came that OPEC had reached a deal. The earth shook, moving markets again — this time by a large percentage — and this time backed up by a more tangible hope.
Meanwhile, the industry scrambled to make sense of what it all meant. How big would the cut be? Which members would do the cutting? How did Saudi Arabia and Iran reach any kind of consensus when they were worlds apart — on multiple fronts? And then there was the ultimate question that had every analyst from here to Venezuela furiously figuring and calculating and refiguring and recalculating: just how high could prices go?
Speculators continued to largely disregard the ins and outs of the deal, which were absent at the time, and we saw markets tick up happily in response.
When the size of the production cut — between 240,000 and 740,000 barrels per day — was announced, one could feel the weight of the disappointment within the industry overall. The analysts wanted more; wanted deeper. Most OPEC members had been scrambling to reach record high oil production leading up to the meeting, some successful. Given current production levels, the small cut was seen by most analysts as a mere token gesture that would do very little to address what most would agree is the reason behind the price “problem” — the global supply glut.
And further skepticism surfaced over the fact that no specific member had agreed to any specific cut — they just agreed that as a group, “they” would do some cutting — some months down the road — and that the “they” in that equation wouldn’t be Iran. And it wouldn’t be Nigeria. And it wouldn’t be Libya.
And still, amid all this ambiguity and mystery, and with some distant promise to shave a mere 240,000 barrels of oil per day off OPEC’s record production figures, oil climbed above $50 a barrel. Today, Brent is trading at $52.64, which is a 12-month high-a monumental swing on mere talk.
And sure, some minor fundamentals have changed, such as five weeks of crude oil inventory draws in the U.S., but those inventory numbers are still way too high. In reality, OPEC hasn’t actually done anything to ease the glut. They’ve just talked… about talking… two months from now. In fact, the only actions that OPEC has taken is to pump oil at record paces, adding to the glut, and hoping that speculators will lap up what they’re dishing out in rhetoric. That’s what OPEC is doing today.
So happy are the markets on this wispy nothingness, in fact, that some are suggesting the oil markets are poised for a major meltdown, as speculators buy up contracts that are equal to a year’s worth of U.S. consumption — amounts that can’t possibly be delivered and will be pushed off to next month’s contracts or cancelled. To put this in perspective, there are 480 million barrels of oil on order for delivery in November to Cushing, Oklahoma — a facility that is capable of handling only 50 million per month.
What will also be pushed aside are some other cold, hard facts, such as Libya’s production increases, or Iraq’s, or Iran’s, and how fundamentally, this means the remaining OPEC members would have to make deeper cuts to offset these increases and still meet the organization’s promised cut. Deeper cuts that could hurt whichever member is tasked with taking on this burden.
But to keep the market’s eye on the OPEC ball despite market saturation, the Algerian Energy Minister, desperate to save his country from an economic collapse, made yet another announcement on behalf of OPEC that the bloc would be willing to cut yet another 1% “if we need to” on top of the cuts proposed out of the meeting in Algiers, adding that there would be even more meetings forthcoming — the first of which will be in Istanbul on Oct 9-13, again, on the sidelines of another energy meeting, the World Energy Congress. But this time, the informal talks about the freeze will include non-OPEC Russia and non-OPEC Azerbaijan.
As Reuters reports, the meeting signals that OPEC “is more serious now about managing the global supply glut.” Russia apparently doesn’t share this perceived seriousness, with Russia’s Energy Minister Alexander Novak saying on Friday that he doesn’t expect to sign a deal with OPEC during this meeting. Just more talk.
And yet another meeting is scheduled in Vienna for October 28 and 29, according to OPEC sources, followed by a “long-term strategy” meeting on November 1-4, and a technical meeting again in Vienna on November 23 and 24, and possibly a follow-up meeting of the High Level Committee a day later on November 25. Finally, recommendations will be presented at the previously disclosed and much anticipated meeting on November 30.
That’s plenty of evenly spaced talk that is sure to keep OPEC in media headlines, and give the oil speculators something to play with until that time. After that, it’s anyone’s guess as to how long prices will hold, but it’s likely that regardless of the outcome of the 30 November recommendation meeting, OPEC will continue to feed the beast with talk — and the market will readily accept the handout, even if it’s in lieu of the fundamentals.
By Julianne Geiger for Oilprice.com
…related: Victor Adair on why he is short oil: Live from the trading desk: The Big Themes Keep Making Money
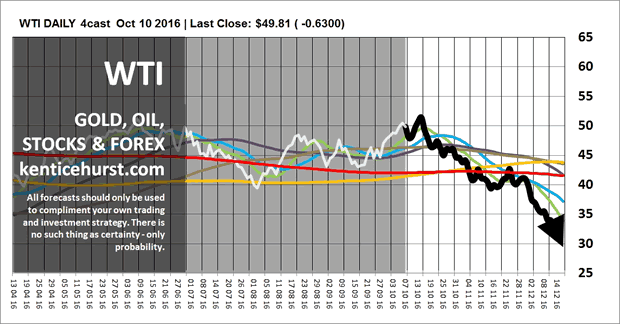
We are getting closer to our long forecast drop in the commodities complex with the possibility of some important lows next year. WTI is still putting in a top, the dead cat bounce that has lasted throughout this year is running out of steam and we should see the push for lower lows over the next couple of months and in to 2017.
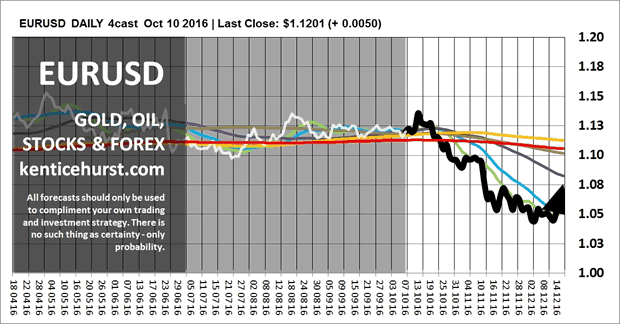
We continue to forecast a period of Dollar and Yen strength over the next few months which will have an impact on many of the markets we forecast. We have been forecasting for some time that the the Pound would be the weakest of the major currencies going forward and we got our drop last week, a little earlier and deeper than forecast but none the less well within our forecast parameters.
We have also been forecasting a new down leg down in the Euro against the Dollar over the coming weeks and our forecast has remained on track for some time, there is still the possibility of a final rise before we fall.
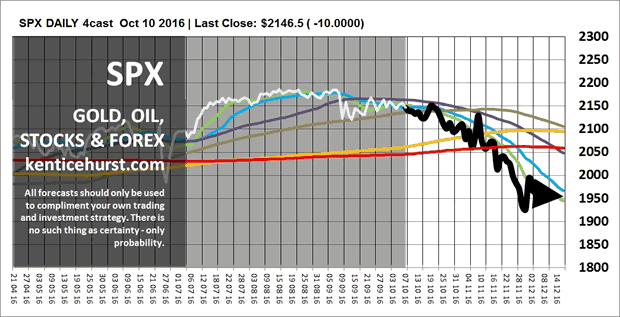
We are forecasting a correction in global stocks over the next six months, we think the SPX along with most of the major indices has either put in a top or is in the process of topping out, this fits in well with our commodity and forex forecasts.
Our S&P500 forecast has for some time been indicating that we are on the verge of a period of weakness it may take a few more weeks before we begin to see the market drop in earnest.
We are currenly expecting a new down leg in commodities, a stronger Dollar and an even stronger Yen during the fourth quarter of this year, we anticipate these dynamics will create the conditions for some key markets to sell off for a period which will relieve some over bought conditions necessary for a healthy market.
Taking patterns in nature that repeat over different time frames like fractals as the basis for the forecast methodology, our forecast patterns can last for months and years, we create a most probable long term fractal pattern and then continually test it and model it over multiple time frames to ensure the pattern remains a probable event.
You can follow our short term forecasts on our web site.
The Federal governments new mortgage rules just announced will have a significant impact on the mortgage industry and could kill a lot of the dreams of millennials and 1st time buyers with low equity.
…also: Live from the trading desk: The Big Themes Keep Making Money


-
I know Mike is a very solid investor and respect his opinions very much. So if he says pay attention to this or that - I will.
~ Dale G.
-
I've started managing my own investments so view Michael's site as a one-stop shop from which to get information and perspectives.
~ Dave E.
-
Michael offers easy reading, honest, common sense information that anyone can use in a practical manner.
~ der_al.
-
A sane voice in a scrambled investment world.
~ Ed R.
Inside Edge Pro Contributors

Greg Weldon

Josef Schachter

Tyler Bollhorn

Ryan Irvine

Paul Beattie

Martin Straith

Patrick Ceresna

Mark Leibovit

James Thorne

Victor Adair