
Stocks & Equities
Here’s the question of the day: are corporate stock buybacks fueling the stock market?
Let’s look at a couple of charts and a news report to help determine the answer.
Quarterly Stock Buybacks
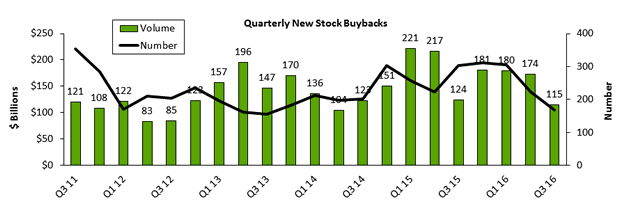
Stock buybacks are at a nine-quarter low according to an Email TrimTabs press announcement:
“Buybacks have been trending lower for the past two years, which is a cautionary longer-term signal for U.S. equities,” said Winston Chua, analyst at TrimTabs. “Along with central bank asset purchases, buybacks have been a key pillar of support for the bull market.”
“The U.S. stock market isn’t likely to get as much of a boost from buybacks as it did in recent years,” noted Chua. “Apart from big tech firms and the too-big-to-fails, fewer companies seem willing to use lots of cash to support share prices.”
There are numerous references to that announcement, but until now, nobody checked to see if the relationship was in fact true.
S&P 500 vs. Volume Lows in Share Buybacks
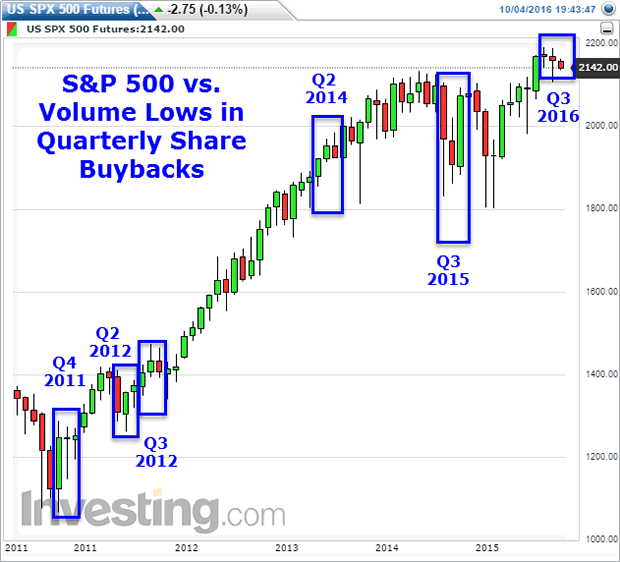
If there is a relationship, I fail to see what it is, at least by looking at the chart.
That does not mean there is no relationship. Rather, it does not show up.
Logic would dictate that share buybacks lower P/E ratios thereby boosting earnings, making stocks look more reasonably priced.
But if reasonable P/E logic was in play, P/E’s would not be as ridiculous as they are. Then again, Wall Street charlatans point buybacks and forward P/Es as evidence the stock market is cheap.
Competing Theories
- Stock buybacks are still sufficient to fuel the stock market
- Something else is happening, such as another Fed-sponsored mania
#2 is a given. #1 certainly doesn’t hurt. But market sentiment is so strong now, stock buybacks just may not matter much at all.
When stock market sentiment turns, I strongly suspect buyback announcements will be meaningless.
….also:
Gundlach Says Deutsche Bank Woes Show Harm of Negative Rates

Climate extremists have somehow taken over the debate in Canada allowing laws already made, and in the works to tax citizens billions of dollars despite that there will be no changes of significance, or no reasonable, measurable gains
…also: Canada’s Progressive Left Support Donald Trump…..

Quotable
“All the gold which is under or upon the earth is not enough to give in exchange for virtue.” –Plato
Commentary & Analysis
Gold Crushed – Bonds Crushed: Our subscribers are happy

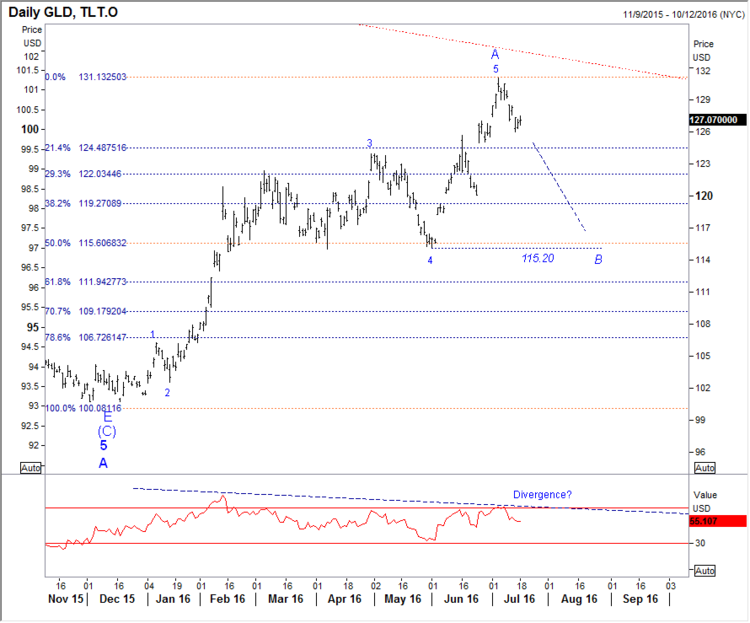
We turned bearish on gold back on July 15th 2016 in our Key Market Strategist service. This service uses Elliott Wave analysis applied to actively exchange traded funds for gold, oil, long bonds, stocks, and the US dollar. Here is what we said to our subscribers back on July 18th:
GLD Daily [last 127.07]: We are now short on Friday’s close at 126.84; looking for a trade to 115.20. A move to 133.69 represents key resistance; we have witnessed declining momentum into the recent rally high (divergence), suggesting the five-wave rally to A may be complete. Despite lots of geopolitical turmoil out there (South China Sea and Turkey), gold is trading flat to down…poor reaction to the news? We think so.
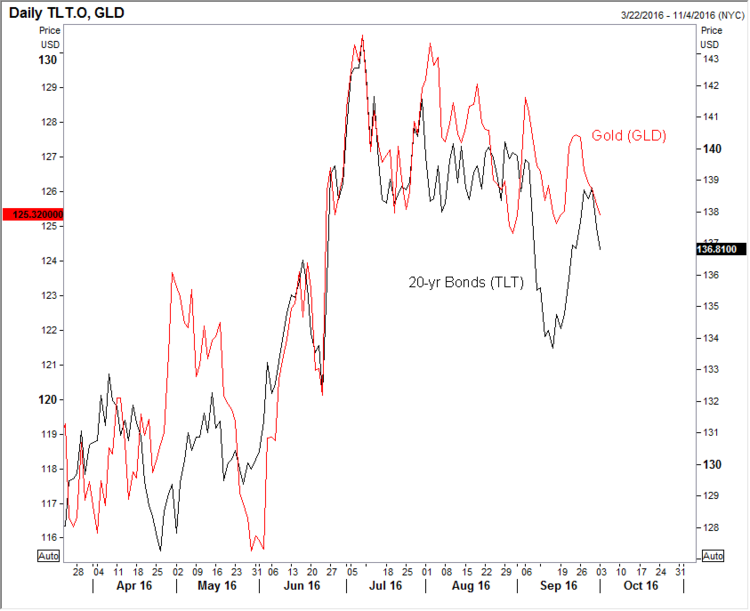
We’ve also been short long bonds for a while and our subscribers are happy there too. In fact, our short long bond position goes hand in hand with our short gold idea, as there is a tight correlation between long rates and gold, as you can see in the chart below comparing TTL (20-yr long bond index) and GLD (gold etf); we most recently shared this correlation with our subscribers on Monday Oct 3rd:
GLD (Gold) versus TLT (20-yr long bond index) Daily: If you are bearish bonds, you should likely be bearish gold too…at least that is what this chart overlay tells us…
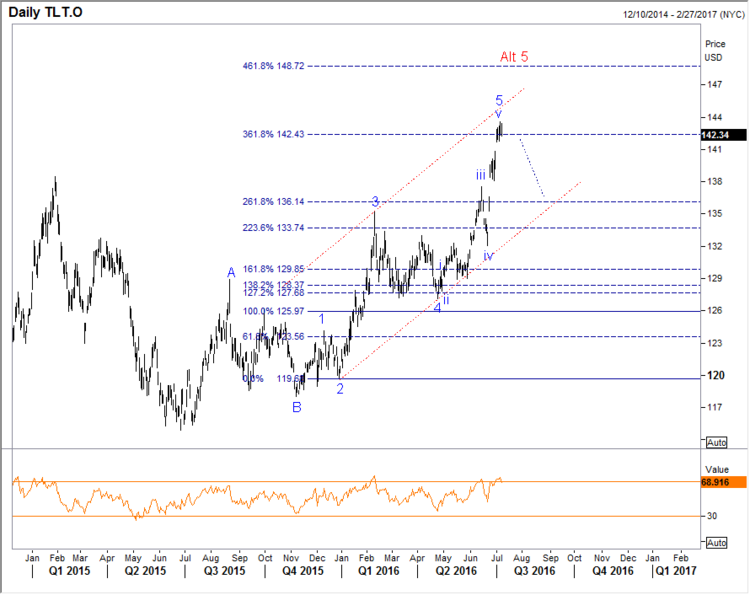
And if interested here is a look at our TLT (20-year bond index chart) analysis; we told our subscribers to go short on July 11th:
TLT Daily [last 142.34]: Going short long bonds here seems a very good risk/reward trade based on the extended sharp rally we’ve witnessed. We had a 361.8% extension target into 142.43—that has been achieved. Alternatively the rally extends to the 149 level.
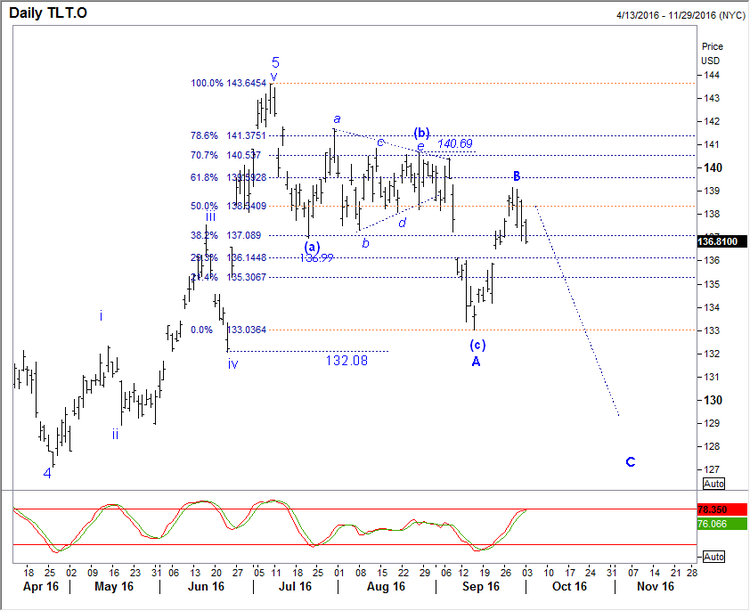
Here is a look at our TLT wave analysis from 10/3/16:
If you are looking for simple directional analysis, and not the usual gold-bug hype, our Key Market Strategist service may be right for you.
For only $89 per year, we think this service is a bargain.
You can learn more about the service here.
We hope you will become one of our valued subscribers.
Jack Crooks
President, Black Swan Capital

It would appear the powers-that-be have just stumbled on to the ugly fact that all the bailed-in depositor money in the world won’t stop the novated, rehypothecated, collateral chain collapse contagion that Deutsche Bank’s $40 trillion-plus derivatives book’s Damocles sword hangs over the status quo. However, being the problem-solving types, the European technocrats have a ‘fair-share’ solution – back a derivative clearing-house with taxpayer money to solve the new too-biggest-to-fail problem “that no one saw coming.”
While the “rules” right nbow are that everyone from shareholders, bondholders, and depositors alike on up the capital structure are supposedly “bailed-in” to save an ailing bank, this problem is just way too big.
Here’s the problem… in 3 charts…
Derivatives book – yuuge…


The question confronting investors right now is whether the lateral trading range in the major indices represents consolidation of the long-term uptrend, which precedes an eventual upside breakout from the range? Or does it represent distribution (i.e. selling) which precedes an eventual breakdown of the trend?
Bulls and bears have assembled evidence to support their respective take on this conundrum, but the most basic and useful evidence suggests the first outcome, namely an eventual upside resolution. Let’s examine the evidence in support of this conclusion.
While the bears have correctly observed that in the previous instances when the major indices have bumped up against trading range resistance – or temporarily exceeded it – the market has always had a sharp decline. It’s also true that during the sideways range-bound market of 2015 there was definite evidence that distribution was taking place among informed investors. This preceded the July-August collapse last year and the secondary collapse in January-February of this year.
All through the spring and summer of 2015 the list of stocks making new 52-week lows on the NYSE was growing. It remained elevated well above 40 – the dividing line between a healthy and unhealthy market – for much of the year. Anytime there is a stretch of several consecutive days where new lows are above 40 while new lows are shrinking it strongly implies internal selling pressure beneath the surface of the broad market. This was one indication that distribution was taking place last year while the Dow and S&P were churning in a sideways trend. Finally, after several months of this internal selling pressure the market broke under the weight of it, as can be seen in the following graph.

After bottoming in February the stock market has only seen a total of nine days where the new 52-week lows numbered 40 or above. That’s an impressive stretch of internal health and it shows that there has been little or no selling urgency or distribution since then. The dearth of new lows argues strongly, therefore, in favor of the longer-term bullish trend remaining intact heading into 2017.
On a short-term basis, however, there has been a definite loss of momentum. As we’ve reviewed in recent reports the NYSE short-term directional components of our Hi-Lo Momentum (HILMO) index keep deteriorating. Here’s what the three components look like as of this writing on Wednesday. The blue line is the short-term directional indicator, the red line is the momentum bias, and the green line is the internal trend.
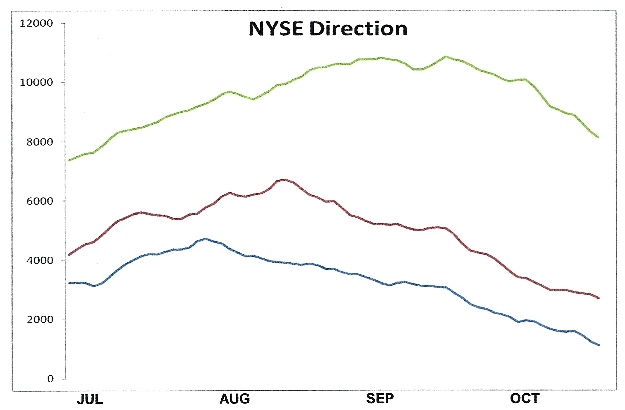
The downward-slanted trend in the above graph is indicative of a loss of forward momentum on a near-term basis and explains why the major indices have been unable to rally in sustained fashion since peaking in August. As long as the short-term momentum indicators are declining it will also mean the market is vulnerable to negative news and may at some point experience another pullback.
Acting as a counterbalance against this short-term downward pressure is the longer-term internal momentum indicator, shown below. Currently this is the only one of the eight major HILMO components that is rising on a sustained basis. My interpretation of this graph is that as long as this indicator continues its nearly vertical climb it should act as a deterrent to a serious bear raid. That has certainly been the case since July-August when the internal cross-currents first became evident. It’s also why any attempt at short selling among the bears has ultimately backfired due to the strongly rising longer-term momentum current reflected in this indicator.

So while the loss of short-term internal momentum may negatively impact the near-term trend, it shouldn’t prove fatal to the major uptrend that began in March-April 2009.
Mastering Moving Averages
The moving average is one of the most versatile of all trading tools and should be a part of every investor’s arsenal. The moving average is one of the most versatile of all trading tools and should be a part of every investor’s arsenal. Far more than a simple trend line, it’s a dynamic momentum indicator as well as a means of identifying support and resistance across variable time frames. It can also be used in place of an overbought/oversold oscillator when used in relationship to the price of the stock or ETF you’re trading in.
Clif Droke is a recognized authority on moving averages and internal momentum. For more information visit www.clifdroke.com
….related:
For short term trading Todd Market Forecast


-
I know Mike is a very solid investor and respect his opinions very much. So if he says pay attention to this or that - I will.
~ Dale G.
-
I've started managing my own investments so view Michael's site as a one-stop shop from which to get information and perspectives.
~ Dave E.
-
Michael offers easy reading, honest, common sense information that anyone can use in a practical manner.
~ der_al.
-
A sane voice in a scrambled investment world.
~ Ed R.
Inside Edge Pro Contributors

Greg Weldon

Josef Schachter

Tyler Bollhorn

Ryan Irvine

Paul Beattie

Martin Straith

Patrick Ceresna

Mark Leibovit

James Thorne

Victor Adair