
Energy & Commodities
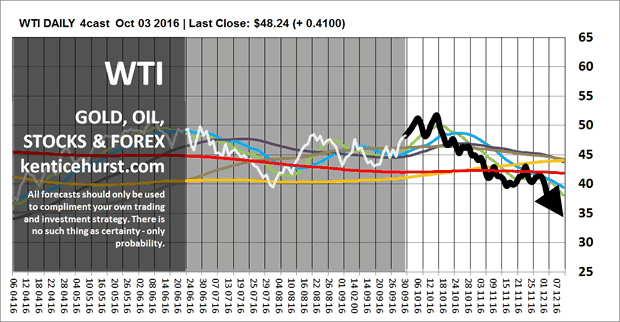
We continue to forecast a drop in the commodities complex over the next few months with the possibility of some important lows next year. WTI is still putting in a top, the dead cat bounce that has lasted throughout this year is running out of steam and we should see the push for lower lows over the next couple of months and in to 2017.
We continue to forecast a period of Dollar and Yen strength over the next few months which will have an impact on many of the markets we forecast. The Dollar will continue to advance against Sterling, we are forecasting the Pound to be the weakest of the major currencies going forward.

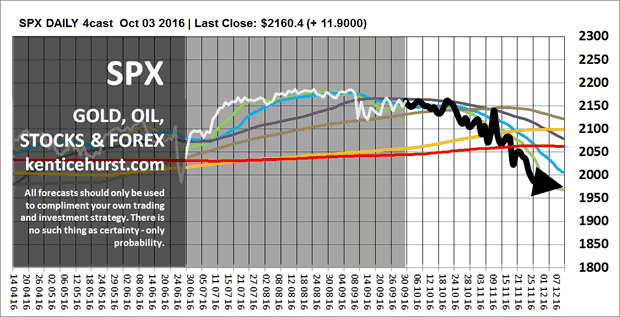
We are forecasting a correction in global stocks over the next six months, we think the SPX along with most of the major indices has either put in a top or is in the process of topping out. This fits in well with our commodity and forex forecasts.
We are currenly expecting a new down leg in commodities, a stronger Dollar and an even stronger Yen during the fourth quarter of this year. we anticipate these dynamics will create the conditions for some key markets to sell off for a period which will relieve some over bought conditions necessary for a healthy market.
Taking patterns in nature that repeat over different time frames like fractals as the basis for the forecast methodology, our forecast patterns can last for months and years, we create a most probable long term fractal pattern and then continually test it and model it over multiple time frames to ensure the pattern remains a probable event.
You can follow our short term forecasts on our web site
…related:
Not Even An OPEC Deal Will Stop Oil Going Lower, Goldman Warns

The new mortgage rules put in place by the Federal Government have the potential to cripple the real estate industry Canada wide. The timing couldn’t be worse as BC’s new tax has triggered a serious slowdown in Vancouver real estate.
…related: Oh, Oh, The Latest Vancouver Real Estate Numbers


Give me a few minutes of your time and I will show you how I made $2,450.00 income off my Yamana Gold shares in just 4 months, and more importantly how you can too.
Having owned Yamana gold shares for over a year, like all gold investors, I was pleasantly surprised at the momentum that all gold stocks had in the first half of the year. Yamana Gold (TSX:YRI) started the year trading near $2.00 a share before bullishly breaking out to $5.99 by May 18th. Having been around the block a few times in regards to these types of stock moves, I suspected the overbought shares would eventually begin to consolidate or retrace the prior rally.
My first instinct was to ask the question if I should simply sell the shares and take my profits. But, I was reluctant to lose my position so easily. So I figured, if I think the stock is approaching the top end of its range, why not use the shares to make myself some income using options.
Let me show you what I did.
First off, many beginners stereo type options as risky. I don’t look at it that way. To me options are a tool, a tool that can be used to create risk, but also can be used to hedge risk, or to generate income.
Here was my scenario. I owned 5000 shares of Yamana or about $30,000 of stock at the $5.99 price. Back on May 18th, I sold 50 contracts of the September 16th, 2016 $7.00 covered calls which were bidding $0.49. I made $2,450 ($0.49 x 5000) in immediate cash flow for the obligation to have to potentially sell the shares for $7.00 at any point prior to the September expiration. That represented an 8.18% cash flow income return in just 4 MONTHS!
Well, 4 months passed, and on September 16th, the shares of Yamana Gold were trading a $5.84, just a few cents away from the levels back in May. The calls profitably expired freeing me from by potential obligation to sell.
Let’s just be clear on a few points. I made this income on the shares I already owned. In a negative interest rate world, how hard is it to find income? Yet I made 8.18% in 4 months. Most importantly, I never took any more risk then any other investor.
What I know is that most investors are intimidated by options, but you don’t have to be. The solution is easy. You need to educate yourself. Once you do, you will realize that it is not that hard to do. Is it time for you to take your investing skills up a notch?
 Patrick will presenting two workshops in Vancouver and Calgary as part of the TMX Options Education Day. This is a fantastic opportunity to learn about options from Patrick and a number of other TMX/Montreal exchange experts:
-
Vancouver – Saturday, October 15th
-
Calgary – Sunday, October 16th

Quick take: At the end of September the inflation-adjusted S&P 500 index price was 88% above its long-term trend
The chart of the S&P Composite stretching back to 1871 based on the real (inflation-adjusted) monthly average of daily closes.

…for larger charts and full analysis click HERE
..also:
What a Trump Win Means for The Stock Markets? Disaster or Buying Opportunity

The trading month doesn’t always end on a Friday but when it does we like to take a look at the monthly charts. Generally, I prefer daily and weekly charts because they have more data points. However, monthly charts carry more significance than weekly charts which carry more significance than daily charts. You get the point. One reason and a good reason we expect the current correction to continue is the sector monthly charts.
The chart below plots the monthly candle charts of GDX and GDXJ. Earlier this year the miners exploded above their 20-month moving averages and into a new bull market. They were trading at three year highs before a bearish reversal in August that reversed the entire gains from July. September saw a recovery but failure to hold most of those gains. This tells us that selling pressure remains present and miners will likely see lower prices in October.
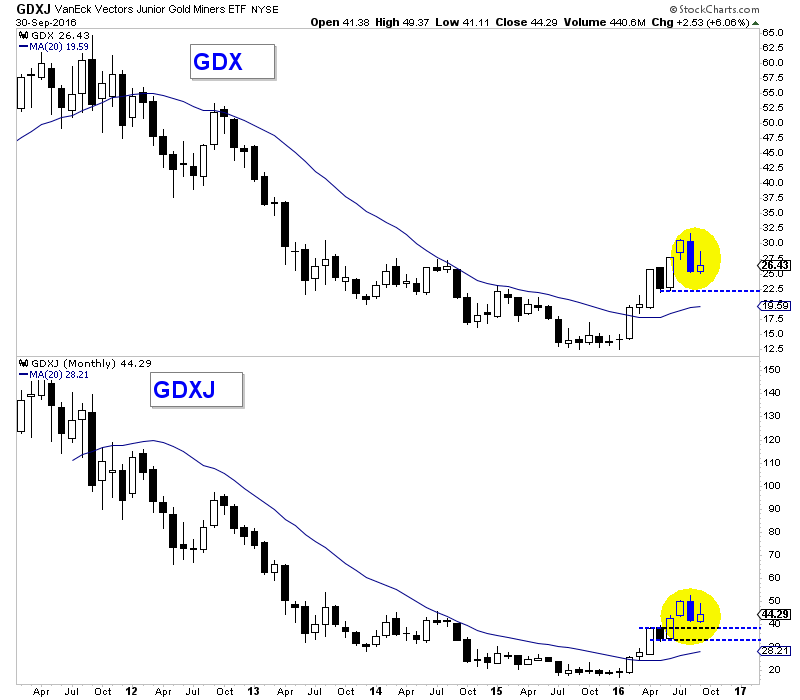
GDX, GDXJ Monthly
The metals show a similar picture. Markets moved well above their 20-month moving averages but the August candle engulfed July’s candle while September recovered only to a small degree. That implies lower prices in October. Gold has support around $1290 while Silver has support near $18. Like the miners, the metals remain a healthy distance above their rising long-term moving averages.
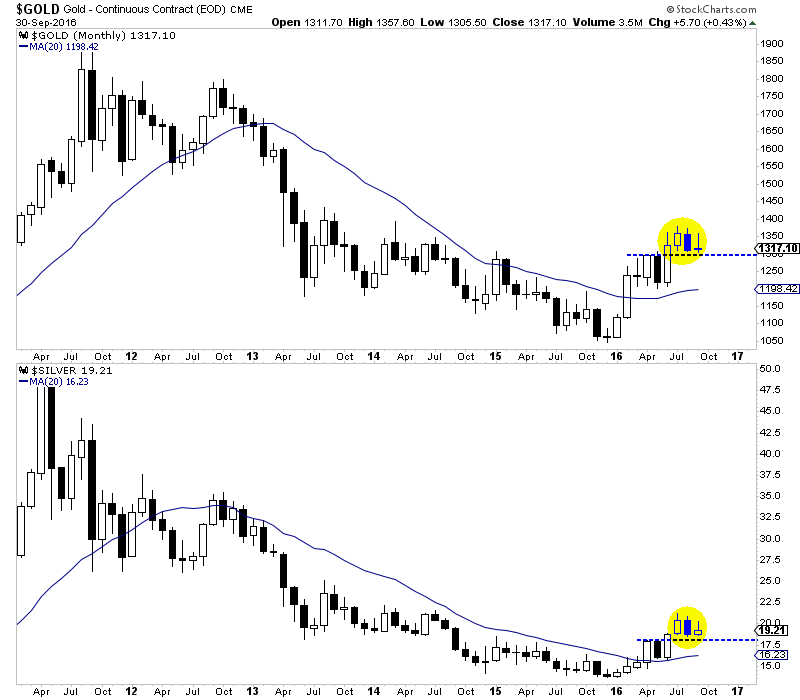
Gold, Silver Monthly
The monthly charts and in particular the action of the past two months leads us to believe lower prices in October are more likely than not. The monthly charts obviously take more time to develop (we have to wait an entire month) but they are the most significant. Time will tell but we see the potential for an important low in October. Traders and investors are advised to wait for lower prices and an oversold condition. We will focus on opportunities scattered amongst individual companies. Jordan Roy-Byrne, CMT, MFTA
…related: Greg Weldon’s recent take on Gold, a metal he was bullish on at the lows:

-
I know Mike is a very solid investor and respect his opinions very much. So if he says pay attention to this or that - I will.
~ Dale G.
-
I've started managing my own investments so view Michael's site as a one-stop shop from which to get information and perspectives.
~ Dave E.
-
Michael offers easy reading, honest, common sense information that anyone can use in a practical manner.
~ der_al.
-
A sane voice in a scrambled investment world.
~ Ed R.
Inside Edge Pro Contributors

Greg Weldon

Josef Schachter

Tyler Bollhorn

Ryan Irvine

Paul Beattie

Martin Straith

Patrick Ceresna

Mark Leibovit

James Thorne

Victor Adair