
Wealth Building Strategies
 “An investment in knowledge pays the best interest.” – Benjamin Franklin
By building a culture of innovation into the DNA of both your leadership and company, you become more competitively positioned and create greater long-term shareholder value. Business leadership must be persistent, aggressive and focused in transforming the company, so innovation becomes the way you are, not something you do.
The 6 keys to building a culture of innovation are:
Make innovation a strategic priority. Ensure you develop and implement a strategic plan to grow your organization, and make innovation a key priority within that plan. Review and update the strategic plan regularly (no less than annually), ensure the organization is aligned with the achievement of the plan, and consistently measure your progress against its goals.
Communicate why innovation is a priority. Communicate to all levels of your organization, so employees are aware of your plans, understand their roles, are committed to taking action and can define success. Provide regular and meaningful updates on progress. Be clear and transparent. Create a common language in order to achieve greater organizational cohesion.
Implement a system that enables innovation. For a business initiative to become successful, it will need a system to nurture, support and measure it. For instance, you could select a system like Lean, which started in manufacturing and now is being adopted in Health Care and Technology, as the backbone of driving transformative thinking. Or give people time to innovate (i.e. Google gives its employees 20% of their time to innovate)
Lead by example. Take the time to focus on becoming a better business leader, so you can model the behaviors you expect of others, particularly during difficult or critical periods. Nothing will make the cultural change more successful than this one act. Be persistent, be authentic and be open minded to opportunity.
Hire, train and build innovative talent. Make the recruitment and retention of key staff that support your innovation strategy a key priority. Help your current staff to develop new skills and find the right way to contribute in a more innovative environment, while hiring new staff that can fill the gaps and have the skills and abilities to drive innovation. Be consistently focused on market problems and customer needs.
Fail faster: Encourage more risk-taking and make failing for taking measured risks both acceptable and an opportunity. Find ways to decrease the failure cycle time, which will drive new opportunities from the failures, and move the company ahead faster.
Don’t innovate for the sake of it. Rather use innovation as a core strategy to build a dominate market position, enabling your company to adapt and transform, creating long-term shareholder value well into the future.
– Eamonn Percy

…also from Eamonn:

For Thursday September 22, 2016 3:00 P.M. PST
DOW + 99 on 1900 net advances
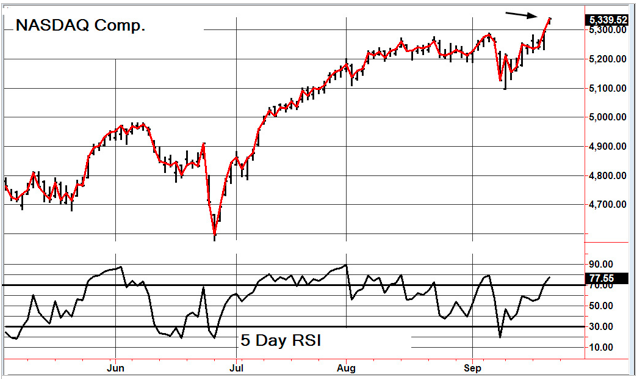
NASDAQ COMP + 44 on 1250 net advances
SHORT TERM TREND Bullish
INTERMEDIATE TERM TREND Bullish
STOCKS: A solid follow through to yesterday’s jump. Many analysts are wondering why the vault higher was so great.
The fact is, the market was ready to rally. We discussed this in the days leading up to the Fed decision. If the market had been overbought with a lot of call option buying on the day of the decision, the reaction would likely have been much more subdued.
GOLD: Gold rose another $9. Same story. No rate increase.
CHART: The NASDAQ Composite looks to have broken out of a congestion zone that lasted a bit over a month.
BOTTOM LINE: (Trading)
Our intermediate term system is on a buy.
System 7 We are in cash. We’ll need a pull back.
System 8 We are in cash. Stay there.
News and fundamentals: Jobless claims came in at 252,000, less than the expected 21,000. Existing home sales were 5.33 million, less than the anticipated 5.44. On Friday we get the PMI mfg index flash.
Interesting Stuff: I would have liked to question Janet Yellen yesterday. I would have asked, “Interest rates have been near zero for almost 9 years and the economy is still too weak to raise rates? Doesn’t that mean that your policies have been an abject failure?”
TORONTO EXCHANGE: Toronto rose 86.
BONDS: Bonds were higher again.
THE REST: The dollar dropped again. Silver surged and crude oil jumped.
Bonds –Bullish as of Sept. 21.
U.S. dollar -Bullish as of August 30.
Euro — Bearish as of August 30.
Gold —-Bullish as of Sept. 21.
Silver—- Bullish as of Sept. 21.
Crude oil —- Bullish as of August 3.
Toronto Stock Exchange—- Bullish from January 22.
We are on a long term buy signal for the markets of the U.S., Canada, Britain, Germany and France.
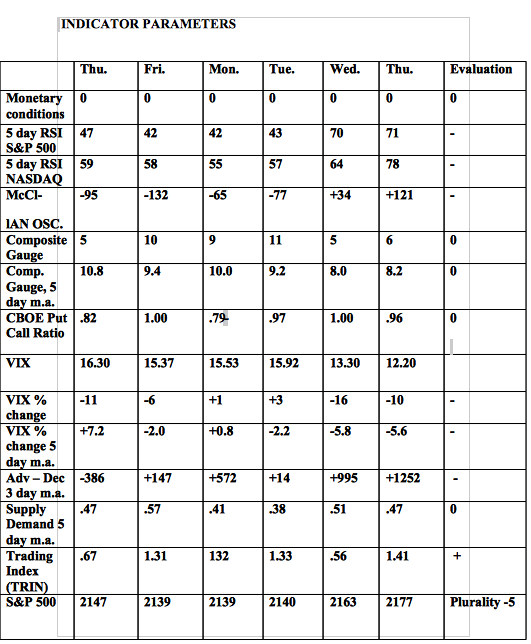
Monetary conditions (+2 means the Fed is actively dropping rates; +1 means a bias toward easing. 0 means neutral, -1 means a bias toward tightening, -2 means actively raising rates). RSI (30 or below is oversold, 80 or above is overbought). McClellan Oscillator ( minus 100 is oversold. Plus 100 is overbought). Composite Gauge (5 or below is negative, 13 or above is positive). Composite Gauge five day m.a. (8.0 or below is overbought. 13.0 or above is oversold). CBOE Put Call Ratio ( .80 or below is a negative. 1.00 or above is a positive). Volatility Index, VIX (low teens bearish, high twenties bullish), VIX % single day change. + 5 or greater bullish. -5 or less, bearish. VIX % change 5 day m.a. +3.0 or above bullish, -3.0 or below, bearish. Advances minus declines three day m.a.( +500 is bearish. – 500 is bullish). Supply Demand 5 day m.a. (.45 or below is a positive. .80 or above is a negative). Trading Index (TRIN) 1.40 or above bullish. No level for bearish.
No guarantees are made. Traders can and do lose money. The publisher may take positions in recommended securities.
http://www.toddmarketforecast.com
….related:

 On the heels of the Fed’s decision not to raise rates, today the man who has become legendary for his predictions on QE, historic moves in currencies, and major global events on why the world financial system is headed for total collapse.
Egon von Greyerz: “It was no surprise to me that the Fed did not raise rates today…
…related from Martin Armstrong:
 Many people have asked are we collapsing as did Rome? The answer is absolutely YES. Like Rome, the state always turns against its people as its need for money always expands. Like the Romans, we have lost our independence, our integrity, and our freedom. The world political economy is melting down before our eyes as government constantly seeks more and more power. This desire for more power unfolds because they see that the free market is always going against them. To prevent the free market from winning, they always lash out and punish those who stand in their way. Government pretends to be benevolent, but the only tool they know is punishment.
…speaking of meltdowns:

 First published Sat Sep 17 for members: Yes, you heard me right. The miners are setting up in a pattern which can see them double within the next nine months. So, let me explain.
But, before I get into that explanation, I want to preface this write up by saying that I put a lot of thought into where I believe we are in this complex, and will try to convey my thoughts with as much detail as possible. So, it may take several readings to understand what I am saying, since I am providing you with all the information I have been considering before I came to my conclusions at the end of the write up.
With the current action we have been experiencing over the last month, it seems as though the GDX has completed 5 waves off its January lows, which I have classified as wave i. That means that the current pullback is likely a wave ii, with the alternative being wave 2 of iii (noted in yellow). And, since my biggest complaint about this market in 2016 has been that we have not had a clearly defined 2nd wave pullback, the market may be providing me with a “gift.” You see, once we have a clearly defined i-ii structure in place, our Fibonacci Pinball method will be set up to provide rather accurate guideposts once this correction runs its course, and we break out to higher highs.
Within a 2nd wave, the market will usually drop to the .382 retracement of the prior 5 wave structure in the a-wave of the 2ndwave. Thus far, what we are counting as the a-wave of this wave ii has come up a bit short of the .382 retracement, which is located at 24.38. Now, when the market comes short of a Fibonacci target, we often see the (b) wave of the following wave structure striking the appropriate target. That means that the (b) wave of the b-wave can very well strike that target before we see a (c) wave rally.
Moreover, this assumes that the market will see a standard b-wave structure. Normally, under most circumstances, the market will provide a well-defined (a)(b)(c) structure within a larger degree b-wave structure. Thus far, we have not seen that, as we have only seen one corrective rally, which is why I have still been giving the market the opportunity to develop the standard structure, which would provide us with a (c) wave rally.
But, keep in mind that these are simply the “standards,” which means, by definition, there will be outliers at times. And, since this larger corrective structure, when complete, suggests that we “should” see at least the 22 region (.500 retracement) as a target for the entire wave ii, one should treat any rally in a (c) wave of a b-wave as an opportunity to hedge their portfolio, rather than attempting to trade that structure to the upside in an aggressive fashion.
Ultimately, it would take a break down below the .382 retracement of 24.38 to provide more certainty that the market is heading directly down to the 22 region to complete the c-wave of wave ii sooner rather than later. So, you may consider me foolish, but I have to abide by standards, and am still looking for that rally to complete a “standard” b-wave, which needs a (c) wave rally to commence quite soon. Moreover, Dr. Cari Bourette, of MarketMood.net, is also expecting higher in the upcoming week based upon her gold market sentiment analysis. In fact, she even has the potential for the entire correction to imminently complete.
Now, as far as the c-wave is concerned, the most common target for the c-wave is the 1.00 extension off the top of the b-wave, where a=c. And, if the b-wave is now in place, then the a=c overlaps right at the .500 retracement in the 22 region. That is what we call “confluence.” The second most common target is where the c-wave is equal to 1.382 times the size of the a-wave, off the top of the b-wave. And, that overlaps with the .618 retracement of wave I in the 19.80 region. Yes, this is another point of “confluence.” All of this suggests that, as it stands now, the maximum I would be comfortable with is the 19.80 region for wave ii. Anything below that region increases the potential that the lows in the market have not yet been seen.
This is where the larger degree projections to the upside come in. Assuming that the 19.80 region holds as support, it suggests that the minimum target for wave iii in the 1.618 projection of waves i and ii is in the 51 region. Again, this assumes that we drop no further than the 19.80 region, and also strike the standard target for a wave iii on the upside. However, since it is quite possible that we hold the 22 region, and since the metals complex often strikes extensions beyond the 1.618 for its 3rd waves, it would suggest that the wave iii of a larger degree wave (1) would likely target the 55-60 region.
Furthermore, since wave i took approximately 6 months, and wave iii is often stronger than a wave i, it would suggest that wave iii can also complete within 6 months, and potentially earlier once wave ii completes. And, assuming that wave ii can still take us another several weeks to another month or so, we should easily be able to double, and maybe even triple in the GDX within the next nine months, as long as we hold the 19.80 region for wave ii.
This also suggests that within 12-15 months, we can challenge and potentially even slightly exceed the 2011 highs in the GDX to complete the larger degree wave (1), which should kick off a multi-month wave (2) pullback. This would also provide an extraordinarily high probability signal that a multi-decade bull market in this complex is underway.
As far as the underlying metals themselves, they seem to be within a slightly more accelerated bullish path, but which can still take them back towards their 2011 highs within the next year as well. While the GDX seems to be in a i-ii structure, the count I have been following in the GLD and silver is a i-ii, 1-2 structure. While the GDX is still within its machinations for its wave ii, I have the same relative count for the wave 2 of wave iii in GLD and silver, in other words, still likely needing more of the correction to fill in.
Therefore, the way it looks at the moment, the wave 2 of iii correction in the metals does not yet look complete. As with the GDX, while we may see an immediate continuation lower to complete the c-wave of wave 2, I believe the silver chart may be suggesting we see a rally before that c-wave down takes hold. As you can see from the attached 144-minute chart, every time we have had this positive divergent set up on the silver 144-minute chart MACD, it has portended the commencement of a strong rally. This has been the case for each and every rally we have experienced in 2016. Will it fail this time? This I cannot answer, as I only deal in probabilities and not certainties. And, each and every time we have had this set up in 2016, we have seen a rally.
In conclusion, due to the “standards” we ordinarily see in the market, the silver 144-minute chart signal, and Dr. Bourette’s market sentiment analysis, I am still going to look for another rally to take hold as long as the GDX is over 24.38. Moreover, I am going to assume that rally is going to be the (c) wave within a b-wave corrective rally, setting us up for one more drop in the c-wave of wave ii.
Alternatively, should the next rally see GDX and silver break out to new highs over their August highs, and the GLD break out over 132, before seeing that c-wave down, then I will assume the correction has completed, will stop out of all my hedges, and expect that we are on our way into the heart of a 3rd wave rally in the metals complex.
See charts illustrating the wave counts on the GDX, GLD and Silver (YI) at https://www.elliottwavetrader.net/scharts/Charts-on-GDX-GLD-Silver-YI-201609181373.html.
Avi Gilburt is a widely followed Elliott Wave technical analyst and author of ElliottWaveTrader.net (www.elliottwavetrader.net), a live Trading Room featuring his intraday market analysis (including emini S&P 500, metals, oil, USD & VXX), interactive member-analyst forum, and detailed library of Elliott Wave education.


-
I know Mike is a very solid investor and respect his opinions very much. So if he says pay attention to this or that - I will.
~ Dale G.
-
I've started managing my own investments so view Michael's site as a one-stop shop from which to get information and perspectives.
~ Dave E.
-
Michael offers easy reading, honest, common sense information that anyone can use in a practical manner.
~ der_al.
-
A sane voice in a scrambled investment world.
~ Ed R.
Inside Edge Pro Contributors

Greg Weldon

Josef Schachter

Tyler Bollhorn

Ryan Irvine

Paul Beattie

Martin Straith

Patrick Ceresna

Mark Leibovit

James Thorne

Victor Adair