
Economic Outlook
University of Michigan survey results show Current Economic Conditions plunged to 103.5 – the lowest since Oct 2015. The biggest driver of this weakness is tumbling inflation expectations (with 1Y outlook dropping to 2.3% – the lowest since Sept 2010).
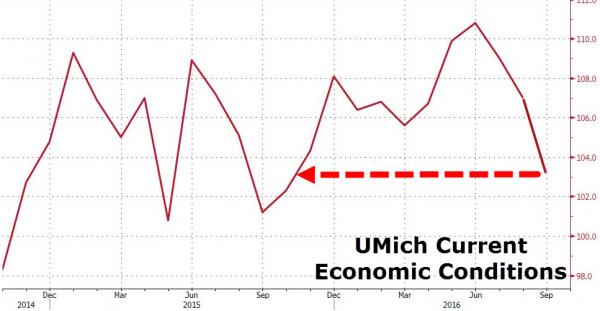
Confidence was unchanged in early September from the August final and barely different from the July reading.
…related:

I want to talk about a corner of the market that has been overlooked for far too long despite offering sustainable high yields of 4% or more—with dividends primed to soar even more.
This sector is a distant cousin to a more familiar group of stocks: utilities. Utility stocks were once Wall Street’s best kept secret: high dividends, cheap valuations, sustainable business models, and steady revenues were all reasons why many big investors quietly bought these small regional companies. Sadly, the cat’s out of the bag. Utility stocks are up nearly 14% year-to-date as investors pile into the sector:
Utilities Gone Haywire
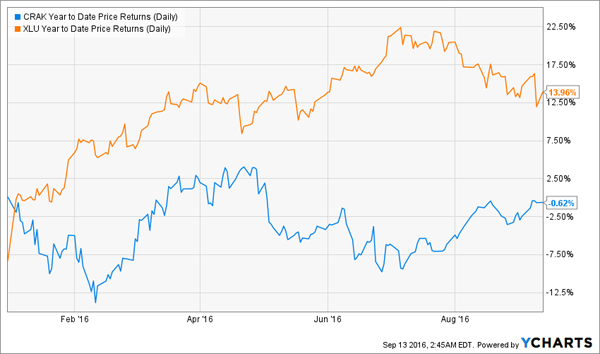
Just look at the performance of the SPDR Utility ETF (XLU), which is up massively even after a recent correction from its shocking 22% year-to-date return earlier this summer. But notice the other line in that chart—that’s the VanEck Vectors Oil Refiners ETF (CRAK), a new and tiny ETF that tracks the oil refineries sector. This ETF is new and tiny for one simple reason: the market has ignored refineries even as it has a love affair with utilities..…continue reading HERE
…also Michael Campbell on – The Formula For Social Unrest & Political Upheaval

 Quantitative Easing (QE) is a risk. Negative Interest Rate Policy (NIRP) is a big risk. Governments using the threat of terrorism as an excuse to dramatically increase their own powers and reduce individual freedom is a huge risk. X hundred trillion dollars of notional derivative value is meaningless.
The hundreds of trillions of dollars of notional derivative value and the associated counterparty risk is a potential life-threatening problem for some of the major banks, but if you believe that derivatives are like a sword of Damocles hanging over the global economy then you’ve swallowed the propaganda hook, line and sinker. The claim during 2008-2009 that the major banks had to be bailed out to prevent a broad-based economic collapse was a lie and it will be a lie when it re-emerges during the next financial crisis.
The global economy could easily handle JP Morgan, Goldman Sachs, Bank of America, Citigroup and Deutsche Bank all going out of business. The shareholders of these companies would suffer 100% losses on their investments, the bondholders of these companies would suffer substantial ‘haircuts’, most employees in the investment-banking and proprietary-trading parts of these companies would lose their jobs, but it’s unlikely that depositors would be adversely affected as the basic banking businesses would simply come under new management. Furthermore, while there would be short-term disruption, Apple would continue to sell loads of iPhones, Exxon-Mobil would continue to sell loads of oil, Toyota would continue to sell loads of cars, and both Walmart and Amazon would continue to sell loads of everything. Life would go on and in less than 12 months most people would not notice that some of history’s banking behemoths had departed the scene.
The real economic threat posed by derivatives is that when there is a blow-up the central banks and governments will swing into action in an effort to keep the major banks afloat. Rather than doing nothing other than ensuring that there is a smooth transfer of ownership for the basic banking (deposit-taking/loan-making) parts of the businesses, we will likely get a lot more of the policies that transfer wealth from the rest of the economy to the banks. That is, we will get a lot more price-distorting QE and programs similar to TARP.
The justification will be that saving the banks is key to saving the economy, but in reality the biggest threat to the economy will come from the policies put in place to save the banks.
…..related: Michael Campbell on – The Formula For Social Unrest & Political Upheaval
In previous articles, we have examined the gold’s performance in different election cycle years. Now, we deepen our analysis and investigate the behavior of the shiny metal in each presidential cycle in more detail. We analyze how gold performed under each President and which governing party (or whether the new President is an incumbent or a newcomer) affects the gold market the most.
The first cycle ran from 1973 to 1976, when Richard Nixon (who in 1971 closed a gold window), and later, after the Watergate scandal, Gerald Ford were in office. As the gold standard was abandoned, while inflation and uncertainty surged, it was a good period for the shiny metal, which rallied 114.27 percent.
The next presidential term was even better for gold, which skyrocketed 392.50 percent under Jimmy Carter in 1977-1980 due to the rampant inflation and weak greenback. Carter was definitely the best president for the price of gold. However, gold’s move in the post-election year was much stronger after Nixon’s nomination, and the annual returns gradually deteriorated over the term, while the dynamics after Carter’s nomination was the opposite (weak reaction and improving returns over the term).
The Ronald Reagan’s era was not positive for gold, as the improving domestic economy pushed the shiny metal down 41.29 percent during his first term and only 21.09 up during the second term. In both cycles, the post-election year was the worst for gold. The same applied to George H. W. Bush’s presidency. The first year after the nomination was the weakest for the yellow metal, which lost 21.27 percent overall during the term.
After George H. W. Bush, Democratic Bill Clinton took the office for two terms, but gold remained in a bear market. It gained only 12.77 percent during the first four years and lost 28.04 percent over Clinton’s second term, as the U.S. dollar was strong. It is notable that the post-election year in the first election won by Clinton was the second-best for the shiny metal in that cycle.
The George W. Bush’s presidency was definitely supportive for gold, which surged 46.60 percent over the first term and 113.11 percent over the second due to rising fiscal deficits. However, the post-election years were the weakest in both election cycles.
The first term of Barack Obama continued to be positive for the yellow metal, which rallied 91.40 percent due to worries about the post-recession economy. In that cycle, the post-election year was not the worst, but the second worst. During Obama’s second term, gold plunged 26.82 percent. The table below summarizes gold’s behavior in each presidential election cycle.
Table 1: Gold’s performance in presidential election cycles between 1973 and 2016
What are the conclusions for our analysis of gold’s behavior during the post-1971 presidential election cycles? First, including the first half of 2016, there were eleven presidential election cycles since the 1970s when gold started to be freely traded. Gold increased during seven of them and usually (in eight cases) experienced the worst performance over the cycle in the post-election year.
Second, there were six Republican presidential terms and five Democratic. The latter were far better for gold, as it gained, on average, 88.36 percent over Democratic presidencies and only 38.75 percent over Republican presidencies. Although it makes some sense, as Republican governments are a bit more focused on curbing inflation and fiscal deficits, the process was very sensitive to Carter’s presidency under which gold skyrocketed.
Third, when a newcomer became the president gold behaved much better (100.40 percent) than in case of incumbents’ victories (28.72 percent) in the whole cycle, but worse in the post-election year (1.28 percent versus 3.47 percent, respectively). But when we separate Republicans and Democrats, we see different outcomes. Gold performed stronger under Republican incumbents than under Republican newcomers or Democrat incumbents, both in the whole election cycle and in the post-election year. Again, due to Carter’s presidency, Democrat newcomers were, after Republican incumbents, the best for gold in the post-election years. Fourth, gold gained more over cycles when presidents had support in Congress (184.07 percent versus 19.43 than when the Congress was dominated by the second party). However, we doubt whether it was an important factor in the gold price dynamics. The analysis is based on very little data and it is not easy, as sometimes presidents had support for half of their presidency or support of the House of Representatives or Senate, only).
The bottom line is that the long-term analysis of gold’s behavior in presidential election cycles is inconclusive. Gold marked its best time under Carter’s presidency, but otherwise it went up and down under both Republicans and Democrats, incumbents or newcomers. It seems that the gold’s performance depends much more on the broader economic context, including monetary policy, rather than who leads the government. It shined when the U.S. economy was in stagflation both under Nixon/Ford and Carter. And the yellow metal was weak when the U.S. economy strengthened, no matter whether it was under the Republican Reagan or the Democrat Clinton. It suggests that the choice between Donald Trump and Hillary Clinton may be not as important for the gold market as is commonly believed. Certainly, Trump would be an unprecedented president due to his unpredictability and populism, thus gold may get a boost if he wins. However, investors should remember that the post-election year is usually the weakest year in the presidential election cycle.
If you enjoyed the above analysis and would you like to know more about the consequences of the U.S. presidential elections for the gold market, we invite you to read the September Market Overview report. If you’re interested in the detailed price analysis and price projections with targets, we invite you to sign up for our Gold & Silver Trading Alerts. If you’re not ready to subscribe at this time, we invite you to sign up for our gold newsletter and stay up-to-date with our latest free articles. It’s free and you can unsubscribe anytime.
Thank you.
Arkadiusz Sieron
Sunshine Profits‘ Gold News Monitor and Market Overview Editor
The World is upside down. For 5000 years investors have been paid an interest rate to compensate for the risk and for the use of the capital. Now, thanks to government incompetence in financial disasters, we now paying government for the privilege of using our money!
…..related: Michael Campbell on – The Formula For Social Unrest & Political Upheaval


-
I know Mike is a very solid investor and respect his opinions very much. So if he says pay attention to this or that - I will.
~ Dale G.
-
I've started managing my own investments so view Michael's site as a one-stop shop from which to get information and perspectives.
~ Dave E.
-
Michael offers easy reading, honest, common sense information that anyone can use in a practical manner.
~ der_al.
-
A sane voice in a scrambled investment world.
~ Ed R.
Inside Edge Pro Contributors

Greg Weldon

Josef Schachter

Tyler Bollhorn

Ryan Irvine

Paul Beattie

Martin Straith

Patrick Ceresna

Mark Leibovit

James Thorne

Victor Adair