Stocks & Equities

Stock Trading Alert: Stocks Extend Their Fluctuations As Investors Await Series Of Economic Data Releases

Briefly: In our opinion, speculative short positions are favored (with stop-loss at 2,210, and profit target at 2,050, S&P 500 index).

Our intraday outlook is bearish, and our short-term outlook is bearish. Our medium-term outlook is now neutral, following S&P 500 index breakout above last year’s all-time high:

Intraday outlook (next 24 hours): bearish
Short-term outlook (next 1-2 weeks): bearish
Medium-term outlook (next 1-3 months): neutral
Long-term outlook (next year): neutral

The main U.S. stock market indexes were mixed between -0.2% and +0.5% on Wednesday, as investors continued to hesitate after recent move down. The S&P 500 index continues to trade below its two-month-long consolidation following June – July rally. Is this a new downtrend or just quick downward correction? The nearest important level of resistance is at around 2,170, marked by Friday’s daily gap down of 2,169.08-2,177.49. On the other hand, support level is at 2,120-2,130, marked by recent local lows, as we can see on the daily chart:
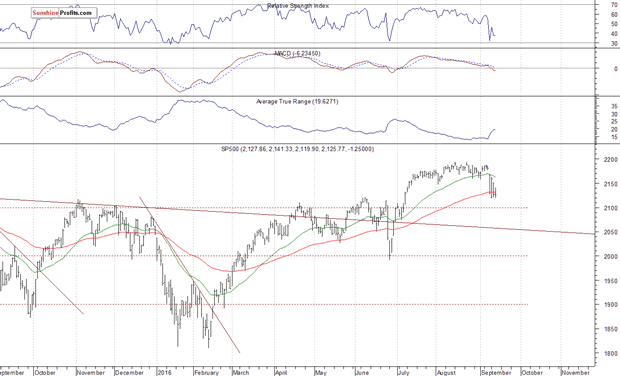
42535 a
Larger Image

Expectations before the opening of today’s trading session are positive, with index futures currently up 0.4%. The European stock market indexes have been mixed so far. Investors will now wait for series of economic data announcements: Initial Claims, Retail Sales, Producer Price Index, Philadelphia Fed, Empire Manufacturing at 8:30 a.m., Industrial Production, Capacity Utilization at 9:15 a.m., Business Inventories at 10:00 a.m. The S&P 500 futures contract trades within an intraday uptrend, as it retraces some of its yesterday’s decline. The nearest important level of resistance is at around 2,130-2,135, marked by short-term local highs. On the other hand, support level remains at 2,100-2,110, as the 15-minute chart shows:
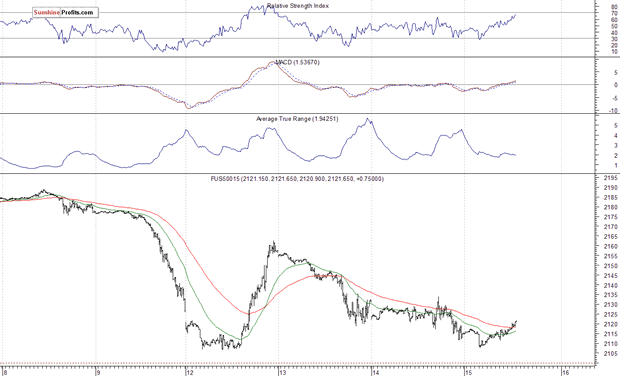
 42535 b

Larger Image

The technology Nasdaq 100 futures contract follows a similar path, as it retraces some of its yesterday’s move down. The nearest important level of resistance is at around 4,750-4,770, marked by short-term local highs. The nearest important support level is at 4,700-4,720. For now, it looks like a consolidation following Monday’s rally:
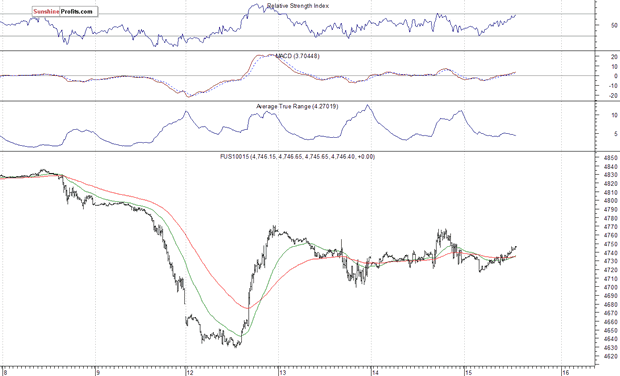
42535 c
Larger Image

Concluding, the broad stock market continues to fluctuate following its recent move down. For now, it looks like consolidation within a downtrend. Therefore, we continue to maintain our speculative short position (opened on July 18th at 2,162, S&P 500 index). Stop-loss level is at 2,210 and potential profit target is at 2,050 (S&P 500 index). You can trade S&P 500 index using futures contracts (S&P 500 futures contract – SP, E-mini S&P 500 futures contract – ES) or an ETF like the SPDR S&P 500 ETF – SPY. It is always important to set some exit price level in case some events cause the price to move in the unlikely direction. Having safety measures in place helps limit potential losses while letting the gains grow.

Thank you.

Michael Campbell on – The Formula For Social Unrest & Political Upheaval

The Skeptical Investor – September 2016

Produced by McIver Capital Management

Ethan Dang, Portfolio Manager with McIver Capital Management in Vancouver.

www.McIverWealth.com

McClellan: A Significant Trend Change Is Starting

Corp-Bonds-Mc-Osc-Sep-2016

The regular McClellan Oscillator is based on Advance-Decline (A-D) data for the NYSE. This week’s chart looks at an interesting example of that, with a big message for the current moment.

…continue reading HERE

…..related: 

 quick note from Jason Goepfert at SentimenTrader – What We Just Witnessed Is A Rarity In The Past 54 Years

S&P 500 Testing Recent Breakout

Summary

History tells us retests often occur after markets push to important new highs.

Historical example of retest after a breakout from a long-term consolidation box.

What can we learn from the S&P 500’s monthly chart?

Retests Can Occur After Breakouts

Typically, when markets (NYSEARCA:SPY) break out from long-term consolidation boxes, it tells us something has fundamentally changed. However, the fundamental drivers that kept the market contained in the consolidation box may still need one more shakeout or retest before the market can push higher.

For example, after the S&P 500 (NYSEARCA:VOO) went basically nowhere between November 1993 and February 1995, the bulls finally mustered enough conviction to push price above the orange box below. After the bullish breakout from the long-term range, sellers needed one more shakeout before the market pushed higher. The retest occurred above the green arrow.

saupload SPX1995RetestA

….continue reading HERE

….related:

Marc Faber: Dow Could Reach 100,000

The Smartest Market in the World Isn’t Buying the Bounce

One of the most critical ideas you need to understand as an investor is that while the media focuses on stocks, they are the usually the last asset class to “get” major changes to the financial system.

This is simply due to liquidity and size of markets.

1.     Globally, the stock market is about $69 trillion in size, trading about $191 billion in shares per day.

2.     The bond markets are well north of $140 trillion, and trade about $700 billion in volume per day,

3.     The currency markets are unmeasured as every currency trade is ultimately a pairs trade (meaning to buy one currency you have to sell another). However, we do know that the currency markets trade $5.3 trillion in volume per day. 

Put another way, the currency markets trade over 26 times more volume than the global stock market every single day. As such they are the most liquid, sensitive markets in the world.

So major changes in the markets first hit in the currency markets. And the key item to watch is the $USD.

GPC91416

The US Dollar is coiling tighter and tighter into a triangle pattern. If we get a breakout to the upside, the next target is 97.

Historically, spikes to this level have resulted in a stock market meltdown soon after.

GPC914162

If you’re concerned about a stock market meltdown you need to download our 21-page investment report titled the Stock Market Crash Survival Guide.

Best Regards

Graham Summers

Chief Market Strategist

Phoenix Capital Research