Posted by Chris Ciovacco - Ciovacco Capital Management, LLC.ement, LLC.
on
Wednesday, 7 September 2016 14:58
Big Moves Often Follow
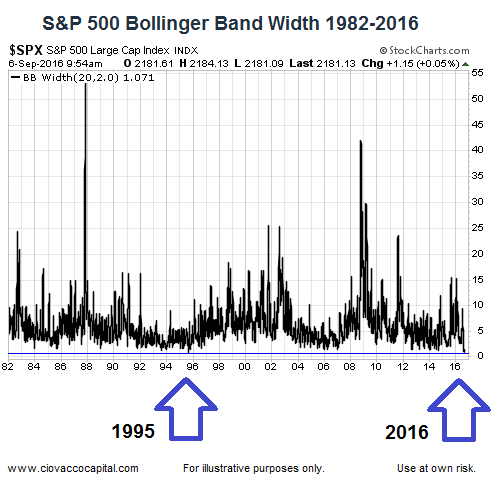
Regular viewers of CCM’s weekly videos may be familiar with the expression “the longer a market goes sideways, the bigger the move you tend to get after a breakout or breakdown”, which aligns with the concept of periods of low volatility often being followed by big moves in asset prices.
Lowest Level Dating Back To 1982
Bollinger band width is one way to track relative volatility. When Bollinger band width readings hit extremely low levels, it tells us to be open to a big move. The S&P 500’s daily Bollinger Band width has never been lower than it is today, using data back to 1982, which means a big move could be coming soon in stocks.
….read more HERE
….related:
Michael’s Featured guest John Johnson, Chief Strategist of of Davis Rea – Be Really Careful Here
Posted by Rick Rule via King World News
on
Wednesday, 7 September 2016 14:48
 With chaos ready to erupt at any moment, this is about to shock the world.
Eric King: “Rick, we have the gold and silver markets doing exactly what you said they were going to do when we spoke in 2015. You said to KWN readers around the world that they needed to be patient and the bear market hell would come to an end, the gold and silver markets would turn and the high-quality mining shares would skyrocket. That bull move is already solidly underway. What do you say to KWN readers at this point?”
Rick Rule: “A couple of things are important here: Don’t trade your core positions, but.…continue reading HERE
…also from Michael Campbell:
Complexity Failure Crisis & Panic
Posted by Martin Armstrong - Armstrong Economics
on
Wednesday, 7 September 2016 14:40

I have been warning that 2017 was the Year of Political Hell with four major referendums/elections that would undermine the confidence in government – BREXIT, US Presidential Elections, French Elections, and Germany Elections. These four events hold the potential to overturn the expectations of the future. Whatever the general public felt about government would flip. The key to a shift from Public confidence to Private lies within the scope of these four elections. This is what our computer has been forecasting – political instability on the rise. This is the age of anti-establishment (3rd party) rising globally.
However, I have also warned.….continue reading HERE
Sep 6, 2016
- Gold has a rough general tendency to decline ahead of the monthly US jobs report, gyrate wildly when the report is released, and then rally modestly higher for another one to three weeks. The cycle tends to repeat itself with varying degrees of intensity.
- Please click here now. Double click to enlarge this daily bars gold chart.
- It’s clear that gold responded to the latest jobs report in “textbook” fashion. I suggested gold would decline to about $1310 ahead of the jobs report. It went to about $1306.
- Since then, gold has rallied to about $1335 and the technical situation is now very good. Note the 14,7,7 series Stochastics oscillator at the bottom of the chart. There’s a crossover buy signal in play.
- Even though Indian demand is currently soft, gold is very well supported by institutional money managers. At this point in time, it could be persuasively argued that neither the love trade nor the fear trade are the prime movers of the gold price.
- Instead, gold is being supported by the “competitive cost of carry” trade. Low rates and negative rates on most fiat currencies make gold very attractive as a currency.
- Please click here now. Double click to enlarge. Silver also looks well supported, and the chart “feels” solid.
- The cost of carry theme means that in the short to medium term, a big price spike higher is unlikely, and a big tumble lower is equally unlikely. Obviously, at some point the fear trade will come back into play, and it’s very late in the game for the US business cycle.
- The US stock market tends to lead the economy by about six months. A rollover to the downside could happen any time between now and 2018, with September, October, and January being the most likely months for a meltdown to commence.
- Please click here now. Double click to enlarge this daily bars dollar versus yen chart.
- Since tumbling to the 100 area on the Brexit event, the dollar has steadied and traded sideways between 100 and 107. The FOREX market is the largest market in the world, and price action of the dollar versus the yen has a huge effect on the gold price.
- Just as the dollar has rolled sideways against the yen since the Brexit, gold has drifted sideways in a rough $1370 to $1310 price range.
- In Japan, central bank chief Kuroda is likely to cut interest rates again at the upcoming September 21 meeting. He’s also likely to increase his QE program.
- Kuroda may also try to stimulate bank lending by targeting his bond purchases at different types of bonds. If he’s successful, bank lending is inflationary, and good for gold.
- If he fails, gold will still benefit from the overall drop in interest rates. That’s because the drop in rates makes gold more competitive with fiat from a cost of carry perspective.
- The US central bank is also holding a key policy meeting on September 21. A rate hike should create a spike in fear trade demand for gold, because it would likely hit the stock market very hard.
- Amateur gold price enthusiasts should take note of the fact that gold is owned as a competitive currency by a myriad of unleveraged institutional money managers.
- In 2008, gold’s main owners were leveraged funds. Gold is in much stronger hands now than it was in 2008, and in the case of a stock market crash, gold may act quite a bit differently than it did in 2008.
- There’s a growing loss of confidence theme amongst institutional money managers, in regards to central banks around the world. Increasingly, gold is replacing T-bonds, and becoming the most favoured safe haven.
- Please click here now. Double click to enlarge this daily bars oil chart.
- Yesterday was a very important day for the global oil market; Russia and Saudi Arabia announced a“cooperation pact”. Oil spiked about two dollars higher on the news, and it may put a new floor under the oil price. The door to production cuts from OPEC is now open.
- US jobs reports show that jobs growth is probably peaking out. A price floor and even modestly higher oil prices will cause more money managers to begin to utter the stagflation catch phrase. That’s good news for gold.
- Please click here now. Double click to enlarge this key daily bars GDX chart. Both the $21 and $25 price zones are superb entry points for gold stock enthusiasts, and traders can be light sellers in the $27.50 and $32 area.
- Gold stocks are very well supported now, because gold is well supported by the competitive cost of carry trade. Against gold, gold stocks have been in a bear cycle since 1996. That cycle appears to be ending now, and its end will be confirmed by an upturn in bank loan profits, and money velocity. A rising oil price floor could be the catalyst that creates the upturn. For the Western gold community, good times are here, and great times are near!
Thanks!
Cheers
st
Sep 6, 2016
Stewart Thomson
Graceland Updates
website: www.gracelandupdates.com
Posted by Rambus Chartology
on
Tuesday, 6 September 2016 13:58
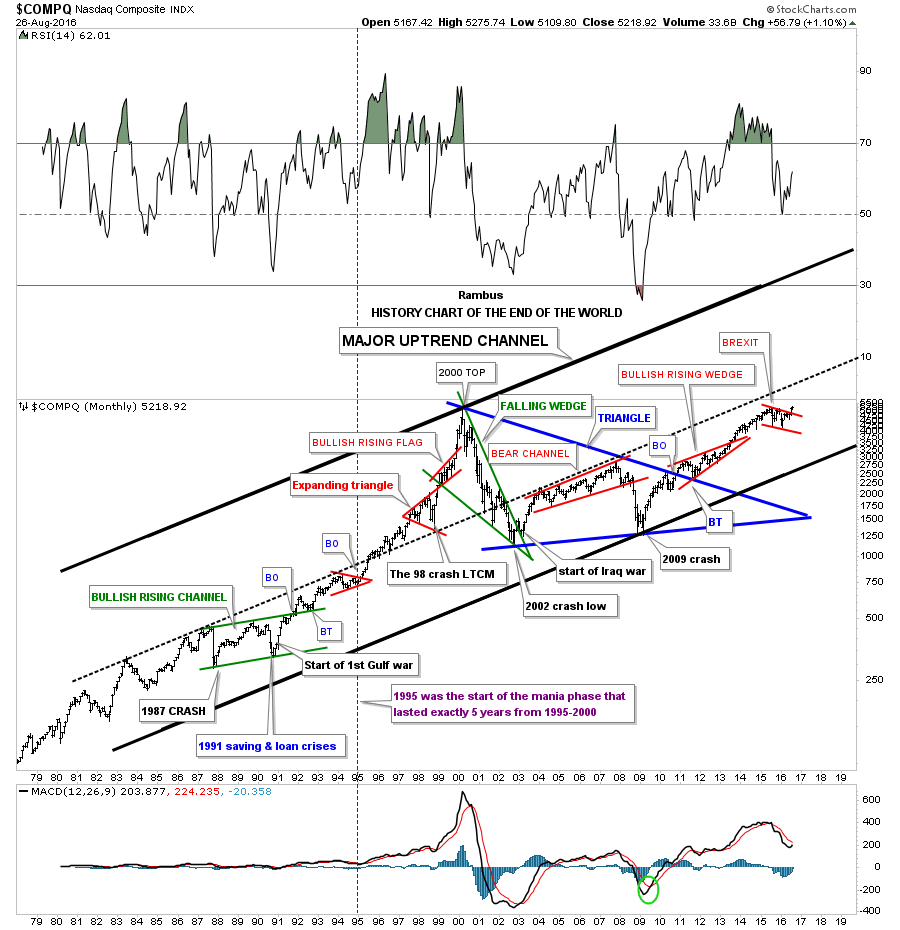 I would like to show you a long term 40 year monthly chart for the $COMPQ which I call the history chart. Some of you were not even born when some of these significance events happened. At the time they seemed significant enough that most thought the end of the world as we knew it was near. Some of the older members will remember some of these events like they just happened yesterday.
I was personally involved in the stock market during each one of these times, and I can assure you it did feel like the world was coming to an end. When one observes some of these stock market events from a distance they hardly matter in the big picture. Perspective is everything.
Take the 1987 crash for instance. The $INDU was down over 500 points in a single day, but in 1987 that was over a 20% drop.The world didn’t come to an end and the markets began to rally off that historic low for several years. Then in 1991….continue reading HERE
….also Michael’s Featured Guest: Be Really Careful Here


