
Timing & trends
 Perspective
One could not deliberately contrive the conditions behind some of the above headlines. The headline writer at the FT must have enjoyed the irony about the worst productivity number and market highs. We did and we don’t think it is an example of the stock market climbing the “Wall of Worry”.
It is another example of bureaucratic madness such as buying bonds in the late 1940s in a futile attempt to keep long-dated Treasuries from rising above 3 percent. Then stepping up the effort in the belligerent attempt in the 1960s to keep them from rising above 6 percent. At the high yield of 15 percent the price of their bond holdings was down hugely.
And then there was the central banks compulsion to sell gold right down to 253 dollars. That is per ounce.
Now senior central banks are buying corporate bonds at unprecedented low yields and stocks at extreme valuations.
Why?
Because they think it will stimulate the economy.
Beyond this, there is the possibility that, underneath it all, they are down to just trying to prove that intervention works. Well, it must work because that’s what the theory says. In 1989, most folks in Eastern Europe finally understood that command central planning was not working.
In the same year, best-selling US economics textbooks were celebrating the wonders of central planning in Communist countries. Well, they had full-on command central planning and it was assumed by American professors, such as Blinder, to work. The 1936 German version of Keynes’ masterpiece included a preface that boasted that his theories would work best in an authoritarian political system:
“The theory of aggregate production, which is the point of the following book, nevertheless can be much easier adapted to the conditions of a totalitarian state than the theory of production and distribution of a given production put forth under conditions of free competition and a large degree of laissez-faire. This is one of the reasons that justifies the fact that I call my theory a general theory.”
Ironically, ambitious US statists have used Keynes to make America more authoritarian. Whew!
Stock Markets
Senior stock indexes are flying at 70,000 feet in an airplane designed for 30,000. There is not enough oxygen to sustain intelligent life.
We have been mentioning, the “old” Ted-Spread, which has been trying to break above the level reached with the last financial crisis in Europe. Another way of monitoring money market risk is through Libor, which is moving in a concerning direction.
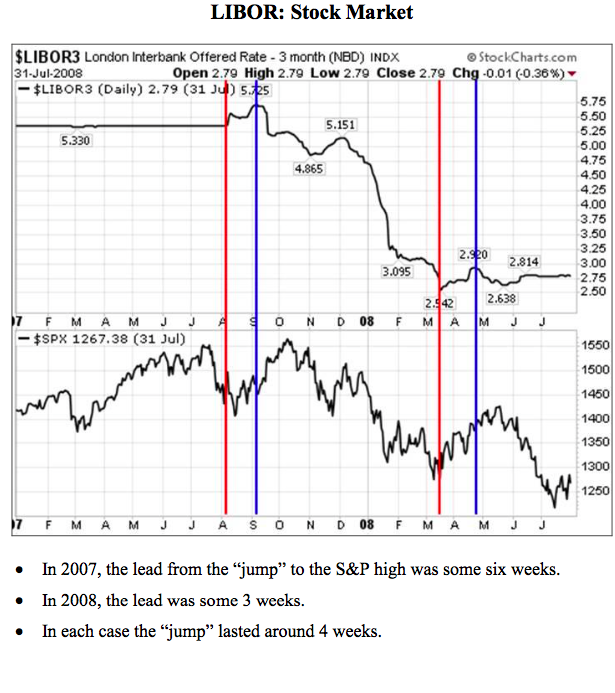
A sharp increase in Libor has preceded important market peaks. A chart follows.
In 2007, the increase began on August 1st and jumped 40 bps by September 4th. The high for the S&P was on October 11.
On 2008, the increase started on March 17th and by April 21st it was up by 38 bps.
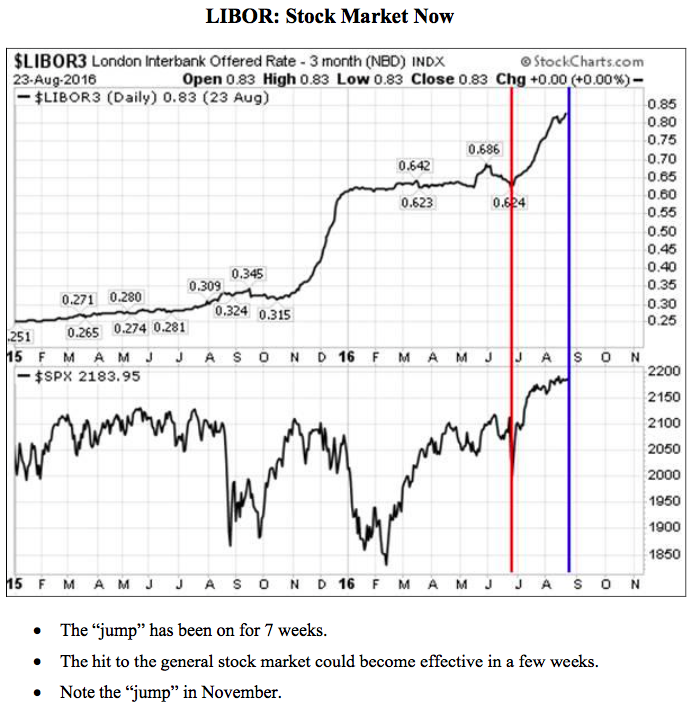
The “jump” began from a low of .315 last October and reached .60 in December, which signaled the severe hit into January-February.
A move of only 28 bps did some damage.
The most recent “jump” began in late June at .62 and now it is at .83, up 21 beeps.
At higher-rates in 2007 and in 2008 it took an increase of some 40 bps to force a significant decline in the S&P.
At today’s lower-rates, of which there has been only one example, 28 bps was needed to prompt a decline.
Perhaps 28 or so bps will do it again?
The beeps will tell us.
In the meantime, Ross has had a “model” that called for one more rally and this is it. This page has been calling for positive vibes for the senior indexes through August. (The NDX took off and set the best Daily RSI since 2014.)
And not-so-positive for key sectors such as the Transports and Banks.
The TRAN worked for us going into last year’s peak and it has not (repeat not) been confirming the new highs in the senior indexes. The rally out to April reached 8148, the rally into July reached 8048 and the latest reached 7951 on Tuesday. Today it is down .50 percent while the senior indexes are unchanged.
BKS reached 71.53 in May and has rallied to almost 71 this week. The high in July 2015 was 81.
The April high for XBD was 172 and the next rally has made it to 168. The peak in July last year was 203.
Europe Financials (EUFN) seem to be working on a “Round Trip”. The low with the last European crisis was 11.71 at the end of 2011. The bull market high was 24.23 in 2014. The low in February was 14.31 and the bounce made it to 18.69, right at the 40-Week ma. Brexit drove it down to 14.31 and the recovery has made it to 17.10. This is shy of the 40-Week at 17.50.
On the broad US market, the NYA had made it to 10892 in the middle of the month. This has been a well-corrected rally but it is up to resistance. Last year’s high was 11255.
Outstanding sectors such as Utilities (XLU) and Base Metal Miners (XME) reached technical excesses in July and have rolled over. XLU took out the 50-Day early in the month. XME was down 5 percent yesterday, breaking below the 50-Day.
Clearly, the bps are getting the Base and Precious Metal Sectors. These were the big performers on the way up. Are they leading on the way down?
Yes, indeed!
Credit Markets
The world is again in love with junk interest rate instruments. Will the love be requited or unrequited?
The history of interest rates is a record of costly disappointment. Ironically, that was the case in 1981 when everyone hated long-dated Treasuries. At 15 percent.
That was at the end of a serious phase of CPI inflation and the beginning of inflation in financial asset prices. That financial assets could inflate was controversial.
Now it is equally controversial that prices for financial assets can deflate.
The long Treasury prices became inflated enough in early July to register some rare technical excesses. The high on the TLT was 143.36 when the world believed that the rate would replicate the decline to Germany’s “Zero” level.
However, the decline has again worked its way to the 50-Day ma, which has provided support. A good test of the high seems likely.
Germany’s bond market is small compared to that of the US. Our view is that with so many diverse players in the game, Treasuries are vulnerable to market forces.
The ECB “owns” the European corporate market.
Excesses noted some weeks ago in the High-Yield market have not been corrected, but have continued to build. The rebound for VWEHX has now clocked the biggest swing in the Weekly RSI since the rally to 6.17 in June 2014. This rally has been from 5.28 reached in dismal February and the high has been 5.85 this week. There is resistance at this level.
The US corporate market is not owned by the Fed and is mightily vulnerable to the next decline in crude oil.
Currencies
What a struggle!
Archaic theories compel the Fed to drive the dollar down. Market forces are always current and have been resisting policy. Can you imagine that?
For us, the DX is a technical pattern on a chart. That is working towards another sensational rally.
The “One more” rally for stocks and crude has been accompanied by a decline in the DX. For the last week it has been stabilizing at 94.5.
On the longer term, the pattern is similar to the bottom set in the first half of 2014 at the 80 level. The trade was either side of the 20-Week ema and the breakout was getting above the line at 81 in that fateful August.
Now the trade is at 94.50 and the ema is at 95.50.
Later in September, it could breakout and the initial target becomes the 98 handle. It could be disquieting to central bankers.
BOB HOYE, INSTITUTIONAL ADVISORS
WEBSITE: www.institutionaladvisors.com


 Few companies offer something so popular that their name becomes a verb. But that is one of the many achievements of Uber, a company founded in 2009 which is now the world’s most valuable startup, worth around $70 billion.
Uber is not alone in this ambition. Companies big and small have recognised the transformative potential of electric, self-driving cars, summoned on demand.
But firms that pioneer new technological trends do not always manage to stay on top. Think of Nokia and BlackBerry in smartphones, Kodak in digital cameras or MySpace in social networking.
….read the entire article HERE
…related from Michael:

originally published on September 1, 2016, 6:53 AM:
Briefly: In our opinion, speculative short positions are favored (with stop-loss at 2,210, and profit target at 2,050, S&P 500 index).
Our intraday outlook is bearish, and our short-term outlook is bearish. Our medium-term outlook is now neutral, following S&P 500 index breakout above last year’s all-time high:
Intraday outlook (next 24 hours): bearish
Short-term outlook (next 1-2 weeks): bearish
Medium-term outlook (next 1-3 months): neutral
Long-term outlook (next year): neutral
The U.S. stock market indexes lost 0.1-0.3% on Wednesday, extending their short-term consolidation, as investors continued to hesitate following June – July rally. The S&P 500 index remains relatively close to its recent new all-time high of 2,193.81. The nearest important level of resistance is at around 2,190-2,200. On the other hand, support level is at 2,160-2,170, marked by short-term local lows. The next support level remains at 2,150. Will the market continue higher? Or is this some kind of a topping pattern before downward reversal? There have been no confirmed negative signals so far:

Expectations before the opening of today’s trading session are positive, with index futures currently up 0.2-0.3%. The main European stock market indexes have gained 0.1-1.1% so far. Investors will now wait for some economic data announcements: Initial Claims, Productivity number at 8:30 a.m., Construction Spending, ISM Index at 10:00 a.m. The S&P 500 futures contract trades within an intraday uptrend, as it retraces its yesterday’s move down. The nearest important level of support is at around 2,160-2,170. On the other hand, resistance level remains at 2,175-2,180, marked by some recent local highs, as we can see on the 15-minute chart:

The technology Nasdaq 100 futures contract follows a similar path, as it retraces its recent decline. The nearest important resistance level is at 4,800 mark. On the other hand, support level remains at 4,760-4,770, among others, as the 15-minute chart shows:

Concluding, the broad stock market continues to trade within a short-term consolidation, as the S&P 500 index remains relatively close to last month’s record high. Will it continue its long-term uptrend following few-week-long fluctuations? Or is this a topping pattern? We still can see overbought conditions accompanied by negative technical divergences. Therefore, we continue to maintain our speculative short position (opened on July 18th at 2,162, S&P 500 index). Stop-loss level is at 2,210 and potential profit target is at 2,050 (S&P 500 index). You can trade S&P 500 index using futures contracts (S&P 500 futures contract – SP, E-mini S&P 500 futures contract – ES) or an ETF like the SPDR S&P 500 ETF – SPY. It is always important to set some exit price level in case some events cause the price to move in the unlikely direction. Having safety measures in place helps limit potential losses while letting the gains grow.
Thank you.
World wide countries Western Government policies are drowning in a sea of red ink, unemployment and economic stagnation. You’d think the policies that caused these headaches would get the blame by the media at least. BUT NO, calls for more of the same policies are screamed from the rooftops. What is it that prevents appeals for doing the exactly the opposite can’t be heard….
Speaking of Government futility, infrastructure spending on a golf course, a racetrack and a clubhouse is not an intelligent economic expenditure. It will upset the children who’ll have to pay for it. Children who’ve a right to ask how we could have blown such a historic opportunity.


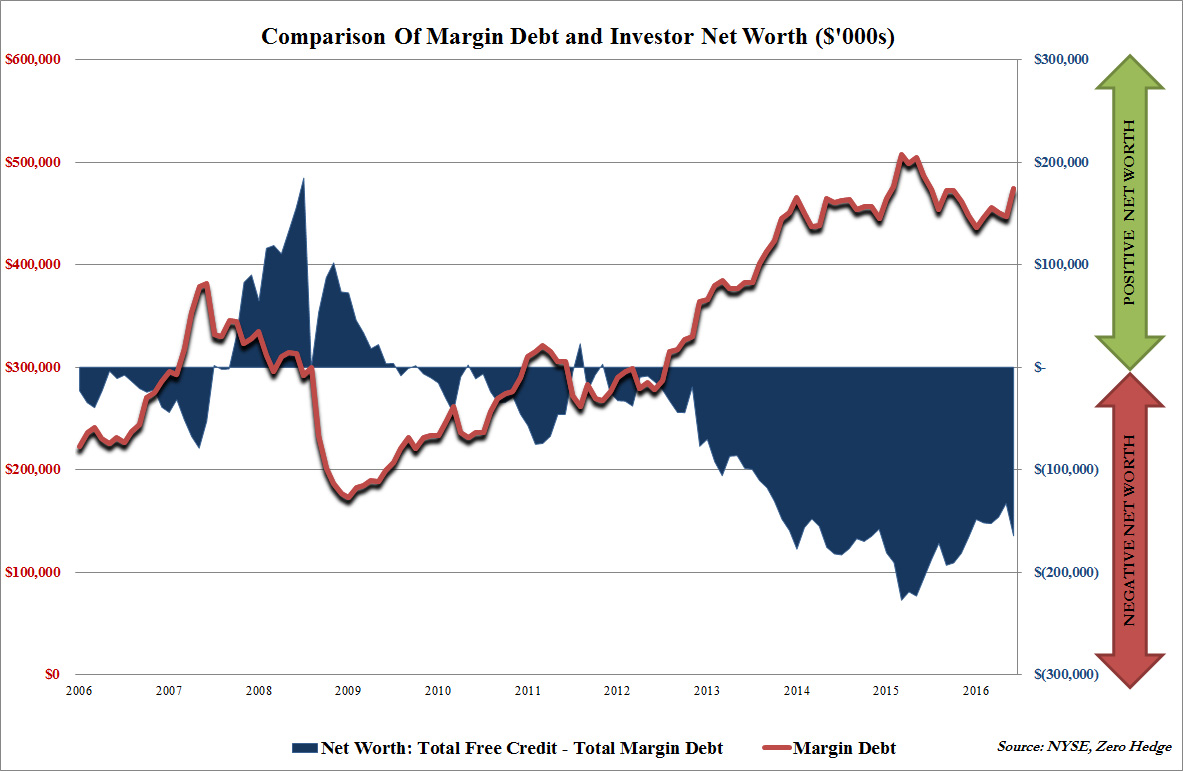 Having plumbed the depths of despair in early 2016, market participants are now in a state of near-record euphoria. One indication of this comes from the latest NYSE margin debt data, which showed the biggest jump since April 2015, rising by $27 billion to $474.6 billion, the highest since last July, as investor net worth calculated by the difference of Margin Debt from Free Credit Cash Accounts and Credit Balances in Margin accounts, once again dipped lower.
…..continue reading and view charts HERE
…related:
Marc Faber Rings the Alarm Bell, Predicts a 50% Near Term Correction in Stocks

-
I know Mike is a very solid investor and respect his opinions very much. So if he says pay attention to this or that - I will.
~ Dale G.
-
I've started managing my own investments so view Michael's site as a one-stop shop from which to get information and perspectives.
~ Dave E.
-
Michael offers easy reading, honest, common sense information that anyone can use in a practical manner.
~ der_al.
-
A sane voice in a scrambled investment world.
~ Ed R.
Inside Edge Pro Contributors

Greg Weldon

Josef Schachter

Tyler Bollhorn

Ryan Irvine

Paul Beattie

Martin Straith

Patrick Ceresna

Mark Leibovit

James Thorne

Victor Adair