Timing & trends

Aug 30, 2016

  1. At the current pace of quantitative easing, Japan’s central bank is buying so many bonds that it now has about 24 months left before there are no more bonds left to buy.
  2. The BOJ is buying close to $800 billion (USD) of bonds annually. The bank’s QE program is truly gargantuan, and Kuroda made a key speech at Jackson Hole indicating he has no intention of tapering it at all. 
  3. Please  click here now. Gold is extremely well-supported now, by both equity fund and FOREX money managers.
  4. Kuroda hinted at Jackson Hole that while he won’t taper QE, he has substantial room to increase the use of his negative rates program. He’s making another key speech next Monday, and I expect him to make it clear that as enormous as his QE program is, he’s going to lower interest rates further, and make it even more important policy than QE.
  5. The US jobs report is scheduled for release this Friday at 8:30AM. When Janet Yellen hiked rates last December, a huge institutional panic out of stock markets and the dollar developed.
  6. These institutions surged into gold and the yen. A big jobs report number is likely to spur Janet to unveil a second rate hike at the September 21 FOMC meeting. 
  7. This is probably the most important jobs report of the entire year, and Janet’s reaction to it could begin a major stock market and US dollar crash.
  8. The September and October timeframe is what I call, “US stock market crash season”. The worst stock market crashes have historically occurred during these months, and Friday’s jobs report has the potential to create another one.
  9. Gold price enthusiasts should pay keen attention to all the upcoming speeches made by key players at both the BOJ and the Fed. Those speeches and policy decisions are likely to create important changes on the charts that gold market technicians focus on.
  10. On that note, please  click here now. Double-click to enlarge this daily bars gold chart. Ahead of the US jobs report, gold is likely to briefly decline to the $1310 area or a bit lower, but Kuroda’s speech on Monday is likely to bring in fresh buying. The bottom line:
  11. If the jobs report shows not many new jobs were created, gold is likely to rally nicely. If the report shows lots of jobs were created, Janet is likely to hike rates and create panic buying of gold as the stock market tumbles. It’s truly win-win for the Western gold community at this point in time.
  12. Indian buying has also started to pick up again, and Chinese New Year buying begins in December.
  13. Please  click here now. Double click to enlarge this daily bars T-bond chart. There are a few different ways to interpret this chart, but it’s beginning to look like a big double top pattern may be forming, with highs in the 175 area, and the neckline at about 168.
  14. Please  click here now. Double-click to enlarge this daily bars oil chart. The T-bond took a bit of a tumble after Janet’s first rate hike, but then it acted as a safe haven. 
  15. That’s because the oil rally from about $34 to $53 was not an inflationary concern. Janet can justify a September rate hike with a good jobs report, but if oil begins a fresh rally higher, she may find that institutional money managers begin losing confidence in her ability to keep the T-bond price elevated in the face of a rise in inflation.
  16. Low rates are crushing bank profit growth in Japan, Europe, and America. An oil price surge can create a major problem for central bankers in these areas; rate hikes help bank profits, but raise the risk that governments may lose control of their enormous debt servicing costs. 
  17. The PBOC could announce a major yuan devaluation if Janet hikes rates in September, and that could potentially unleash the type of stock market crash that occurred in 1929. It’s clear that risks are growing in a myriad of ways, and gold is the safe haven beacon that shines brightest.
  18. Also, Janet is faced with a US election, a French election, an Italian referendum, as well as the “meat and potatoes” of the Brexit. 
  19. At Jackson Hole, she discussed the possibility of negative interest rates and new forms of QE as tools to manage the next US economic recession. The use of these tools is more good news for gold.
  20. Please  click here now. Double-click to enlarge this daily bars silver chart. Solid support sits just below the current price level. Note the nice “bull hook” that is taking shape on the Stochastics oscillator, at the bottom of the chart.
  21. Silver is one of the greatest assets of all time, second only to gold on the greatness scale. Price enthusiasts can be buyers in the $18.50 – $16 zone. I’m one of those enthusiasts!
  22. Please  click here now. Double-click to enlarge this daily bars GDX chart. This price correction is a bit different from the other corrections that have occurred in 2016.
  23. That’s because of the enormous importance of Jackson Hole, the jobs report, and the upcoming Fed and BOJ meetings. There is some clear technical damage, and GDX is unlikely to make new rally highs until after the September central bank meetings.
  24. The current area is a buying zone for eager gold stock investors, but where the correction low occurs will be determined by Janet & Kuroda, not by technicians looking at the GDX price chart. Note the extremely low position of my Stochastics indicator, at the bottom of the chart. It suggests that gold stocks are poised to rally strongly, and that is likely to happen right after Friday’s jobs report is released! 

Thanks! 

Cheers
st

Stewart Thomson  
Graceland Updates website: www.gracelandupdates.com

…..related: The Precious Metals Sector and the Fed

Fundamentals for Uranium Look Great; Is the Uranium Market Ready to Soar?

“A genius can’t be forced; nor can you make an ape an alderman.” ~ Thomas Somerville

By any estimate, the uranium market is trading in the extremely oversold ranges, but when the trend is down, a market can trend into the extreme of extremely oversold ranges, and we have seen this occur many times in the past. The 15-year chart illustrates that the next layer of support comes into play in the $21.50-$22.00 ranges, so despite being extremely oversold the market still has room to trend lower. One positive is that the trend is about to turn neutral and if it does it would be the first move into the neutral zone in a very long time.

Uranium

Screen Shot 2016-08-30 at 7.06.07 AM

Taking a long-term view; a monthly close above $35 would be needed to indicate that a multi-month bottom is in place. From a contrarian perspective, uranium would start to look quite tempting at any level below $23.00.

42397 b
Source:www.indexmundi.com/

On the five year chart, Uranium is has broken through former support (27.50-28.00) now turned resistance and it appears that almost all the ingredients are in place for a test of the $21.50-$22.00ranges.

Fundamentals

Uranium costs about $60 a pound to produce and yet mining companies can barely get $30.00 a pound for it. At some point, something has got to give, and that will most likely be the mines. More and more mines will close up shop and call it quits, and it is not easy to bring an offline mine online again; it takes time to get an inactive mine back online.

Countries like Japan, Germany and a host of other nations dreaming of giving up on Nuclear energy are well just dreaming. Japan is now re-embracing nuclear, as will Germany and or any other country with hopes to wean itself away from Nuclear power. It is either Nuclear power or Coal, and since these countries claim to be fighting global warming, they will rather embrace Nuclear than coal.

From the fundamental perspective, the picture looks quite compelling, but fundamentals tend to paint a falsely positive picture. If we take a look at Cameco, one of the top players in this sector, the technical picture is far from positive. Despite trading in the oversold ranges, the stock broke down after posting a surprise second-quarter loss.

42397 c

The brown dotted lines represent the multiple levels of support the stock has broken through; in fact, the stock has just traded below is 2004 lows. We would not be surprised if it dipped to $8.50 with a possible overshoot to $7.20 before a long term bottom takes hold. If uranium trades lower but Cameco’s stock price does not take the same path, it will trigger a positive divergence signals and such signals are usually indicative of a bottom.

Conclusion

Overall while there are many factors in the fundamental arena calling for a bottom, the technical and psychological patterns offer opposing viewpoints; both suggest that uranium is likely to test the $22 ranges before a long-term base in is in place. As the sector has taken a massive beating since it peaked in 2007, it would be a good idea to keep this sector on your radar and possibly start looking at some stocks in the industry.

“Ability is of little account without opportunity.” ~ Napoleon Bonaparte

Here’s and interesting point of view: Marc Faber: Disaster Alert


The Precious Metals Sector and the Fed. . .

Technical analyst Clive Maund reflects on how Federal Reserve statements may affect markets, and explains why he thinks the precious metals markets are due for a correction.

Metals and fed cover

Chart courtesy of www.sentimentrader.com

While the Fed is almost powerless these days, as it has succeeded in “painting itself into a corner,” the markets still seem to think that its utterances are important and react, sometimes violently, to its apparent stance, or implied stance. For this reason we have to treat Fed statements as important, even though they really aren’t. Today we have the Fed making pronouncements and the markets can be expected to gyrate around and react as usual.

In general they are not expected to “rock the boat.” Powerful vested interests—what may be described as the status quo—want Hillary Clinton as the next President, as she will serve as their marionette and do their bidding. Trump can talk a lot, but even if he gets in won’t make much difference for two reasons. One is that he is the candidate for the Republican Party, and the same plutocrats control the Republican Party that control the Democrats—they are two sides of the same coin. So if elected Trump will have to buckle down and do as he is told. If he tries to seriously take on the military-industrial complex that runs the U.S. he will end up like JFK. In any event, he has already indicated that he will yield and comply, by talking about “beefing up our great military” and by paying homage to “our great friend in the region (Mid-East) Israel.” 

So whoever gets in, the outlook for the ordinary American citizen remains hopeless, despite all the mindless pre-election hype and razzmatazz. Of the two candidates the powerful vested interests, of course, prefer Hillary, so we can expect the Fed to do as little as possible to upset the markets ahead of the elections (i.e., nothing of any consequence). This being so, today’s Fed remarks might be greeted with a sigh of relief and spark another up-leg in the broad market, which is now supported by a gigantic slush fund.

Although at first sight it looks like we are being presented with a buying opportunity in the precious metals sector, which has reacted back over the past couple of weeks, we have to careful here. There has been no major correction in this sector all this year, which is inflated after months of rallying, and we will look at some evidence here that the correction may have considerably  to go, in points terms if not in time terms.

We will start by looking at the eight-month gold chart. As we can see, although stocks have been slammed over the past couple of weeks, gold has barely dropped yet, although it has broken down from a Triangle as predicted at the start of the week in Gold and Silver Probable Short-term Scenario. If the dollar rallies, gold could get whacked back to the vicinity of its 200-day moving average, now at about $1,220. Such a drop would lead to further heavy losses in PM stocks over a short-term time frame, and would be expected to be followed by a reversal to the upside, and thus present a MAJOR buying opportunity.

metalsfed 1

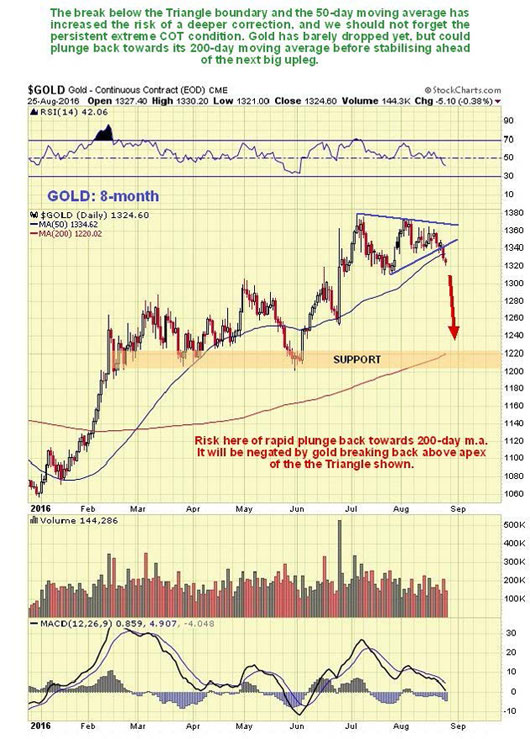
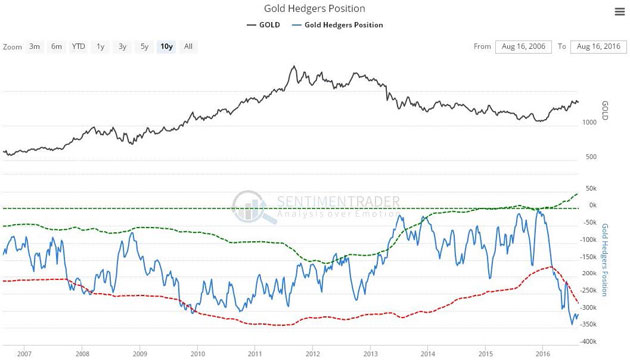
The latest gold Hedgers chart (a form of COT chart, shown at the top of the article) shows an extremely lopsided situation that normally calls for a significant drop, and it has contributed to our cautious stance of recent weeks…

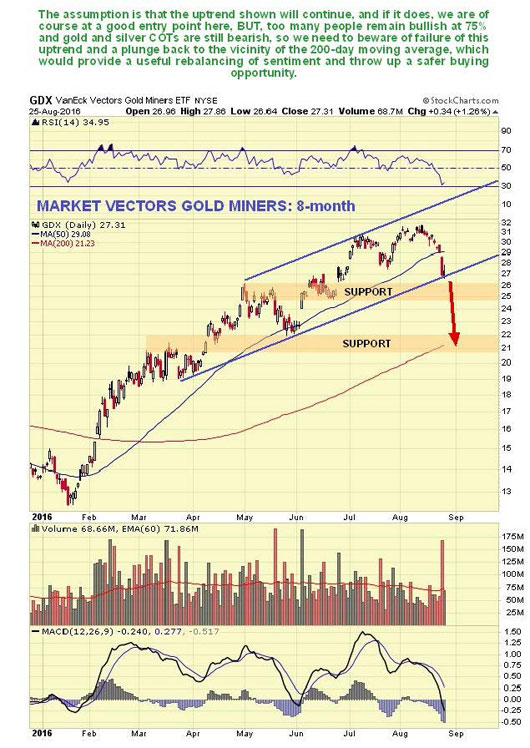
On the latest 8-month chart for GDX the sector looks like it is at another buy spot. It may be, depending on how markets react to the Fed later, but other factors such as the gold chart above, and sentiment readings that we will look at in a moment, urge caution and suggest that instead the sector could break down into a short-term plunge that sees GDX correct back to the vicinity of its 200-day moving average. If the sector reacts positively after the Fed, it will be in order to buy it, but prudent to set quite close stops.

metalsfed 2

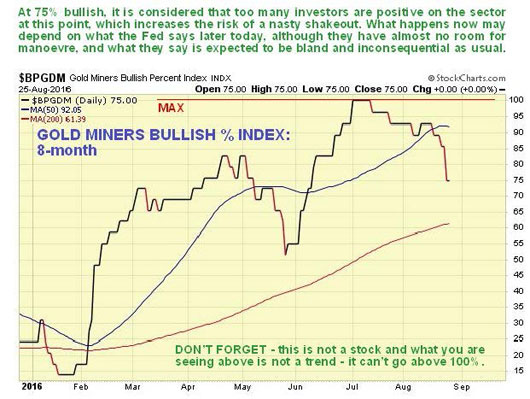
After the latest retreat the Gold Miners Bullish Percent Index is still at an uncomfortably high reading of

75% bullish, which increases the risk that this correction is not done yet and could end with a nasty flushout that will also throw up a great buying opportunity.

metalsfed 3

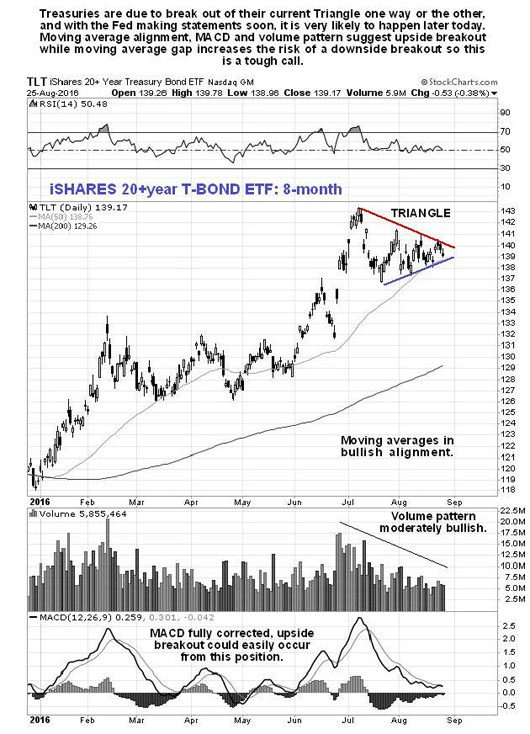
One thing worth pointing out here is that it looks like a breakout by Treasuries is imminent, and it may well be triggered by the Fed’s remarks today. On the 8-month chart for Treasury proxy TLT we see that the neat Symmetrical Triangle that has been forming in recent weeks is now closing up. Various factors suggest an upside breakout, although the gap between the moving averages is now large, so the opposite outcome is possible, depending on the market’s interpretation of the Fed. . .

metalsfed 4

So let’s see how the markets react after the Fed later today.

Clive Maund has been president of www.clivemaund.com, a successful resource sector website, since its inception in 2003. He has 30 years’ experience in technical analysis and has worked for banks, commodity brokers and stockbrokers in the City of London. He holds a Diploma in Technical Analysis from the UK Society of Technical Analysts.

….related: A Bit More Downside Potential In Gold Stocks

Disclosures:
1) Statements and opinions expressed are the opinions of Clive Maund and not of Streetwise Reports or its officers. Clive Maund is wholly responsible for the validity of the statements. Streetwise Reports was not involved in any aspect of the content preparation or editing so the author could speak independently about the sector. Clive Maund was not paid by Streetwise Reports LLC for this article. Streetwise Reports was not paid by the author to publish or syndicate this article. 
2) This article does not constitute investment advice. Each reader is encouraged to consult with his or her individual financial professional and any action a reader takes as a result of information presented here is his or her own responsibility. By opening this page, each reader accepts and agrees to Streetwise Reports’ terms of use and full legal disclaimer. This article is not a solicitation for investment. Streetwise Reports does not render general or specific investment advice and the information on Streetwise Reports should not be considered a recommendation to buy or sell any security. Streetwise Reports does not endorse or recommend the business, products, services or securities of any company mentioned on Streetwise Reports.
3) From time to time, Streetwise Reports LLC and its directors, officers, employees or members of their families, as well as persons interviewed for articles and interviews on the site, may have a long or short position in securities mentioned. Directors, officers, employees or members of their families are prohibited from making purchases and/or sales of those securities in the open market or otherwise during the up-to-four-week interval from the time of the interview until after it publishes.

Charts provided by Clive Maund

The Facts Are In: Union Leaders Are Shooting Themselves In The Foot

For every dollar increase in Corporate Taxes, wages drop by more than a dollar. That’s according to a recent study that is backed up by a wealth of previous studies. Why then do Union leaders, Politicians and special interest groups continue to demand higher taxes????

…speaking of Politicians: It’s Time To Take A Stand

corptax


Sequential TD9’s in Gold Miners

Technical observations of RossClark@shaw.ca

Seven of the nine gold miners with market capitalizations over 10 billion Cad$ have generated TD Sequential 9 Sell Setups during this year’s rally. The most common reaction is a correction back to the 20-month exponential moving average. Longer-term investors should be patient.

Screen Shot 2016-08-29 at 6.50.25 AM

Barrick

42375 a
Larger Image

Newmont

42375 b
Larger Image

Franco Nevada

42375 c
Larger Image

iShares TSX Global Gold Index ETF (XGD.TO)

42375 d
Larger Image

….related from Jordan Roy-Byrne:

A Bit More Downside Potential in Gold Stocks