
Real Estate
Ozzie Jurock says if you’re thinking about that hot spot on a Gulf Island poke yourself with a sharp stick. There are definitely things to check out first.
Last weeks Hot Properties with Ozzie Jurock: Real Estate: Underlying Strength


 Wednesday August 17: Five things the markets are talking about
Today is FOMC minute’s reporting day. Will investors get the granularity on the timing of US rate normalization they so much crave? Market odds are leaning towards a resounding ‘no.’
Already this week, investors have been served up some mixed messages from voting and non-voting members. Net result, the market remains skeptical that the central bank would increase rates before the end of 2016. As questionable US data of late (inflation and retail sales) provides a strong argument preventing a rate increase at the Fed’s meetings in September or December.
On Monday, Fed President Williams (San Francisco) suggested that the central bank should be considering new tools to deal with a stubbornly slow economic growth, including raising its inflation target. Yesterday, New York Fed President Dudley counter argued that the US economy should pick up in H2 and that the November presidential election should not factor into the Fed’s decision to raise interest rates. In translation, gradual rate rises are warranted.
This push/pull from Fed members certainly makes it more difficult to trade in these already “thinly” traded holiday sessions. Expect this afternoon’s minutes release at 02:00pm EDT to not make it any easier for capital markets.
1. Crude and commodities look to the Fed for direction
related:

Martin’s answer to a question:
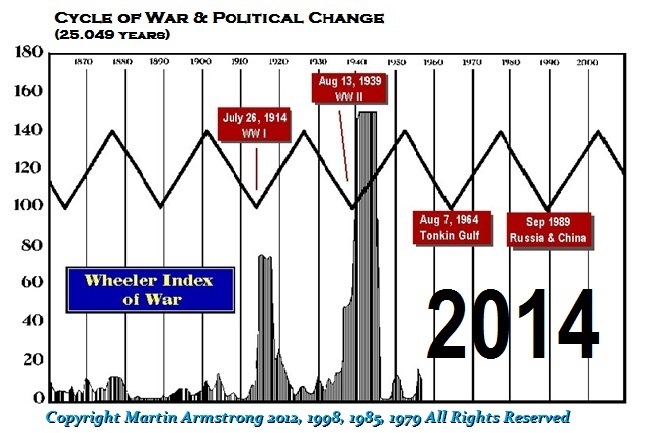
“The majority of wars have begun in the spring and summer with August being the danger zone.
The War of the Roses began on May 22, 1455, which was one of the earliest. The 100 Years War really began on June 24, 1340. As we bottomed in global climate during the 1700s, this cycle shifted the wars to late summer. The American and French revolutions technically began in July. However, the insurrection of August 10, 1792, was one of the real defining events in the history of the French Revolution since the monarchy fell 6 weeks later. If we look at World War I, that began on July 28, 1914, and World War II began on September 1, 1939. The Vietnam War and the Tonkin Gulf incident was August 1, 2014. The Gulf War (first invasion) took place on August 2, 1990. The Iraq War (second invasion) began on March 20, 2003, but this was clearly a monetary war game set in motion by Dick Cheney, as it appears clearly out of sync historically with conflicts.
We are in the danger zone this month for armed conflict. The cycle turned up in 2014. Ever since, we have seen a rising international arms race created by Obama and a rising trend of civil unrest and terrorism. We have Iran and North Korea in a mad rush to enter the nuclear weapons game. So yes. Beware of the month of August. Statistically speaking, this tends to be the favored season for war events.”
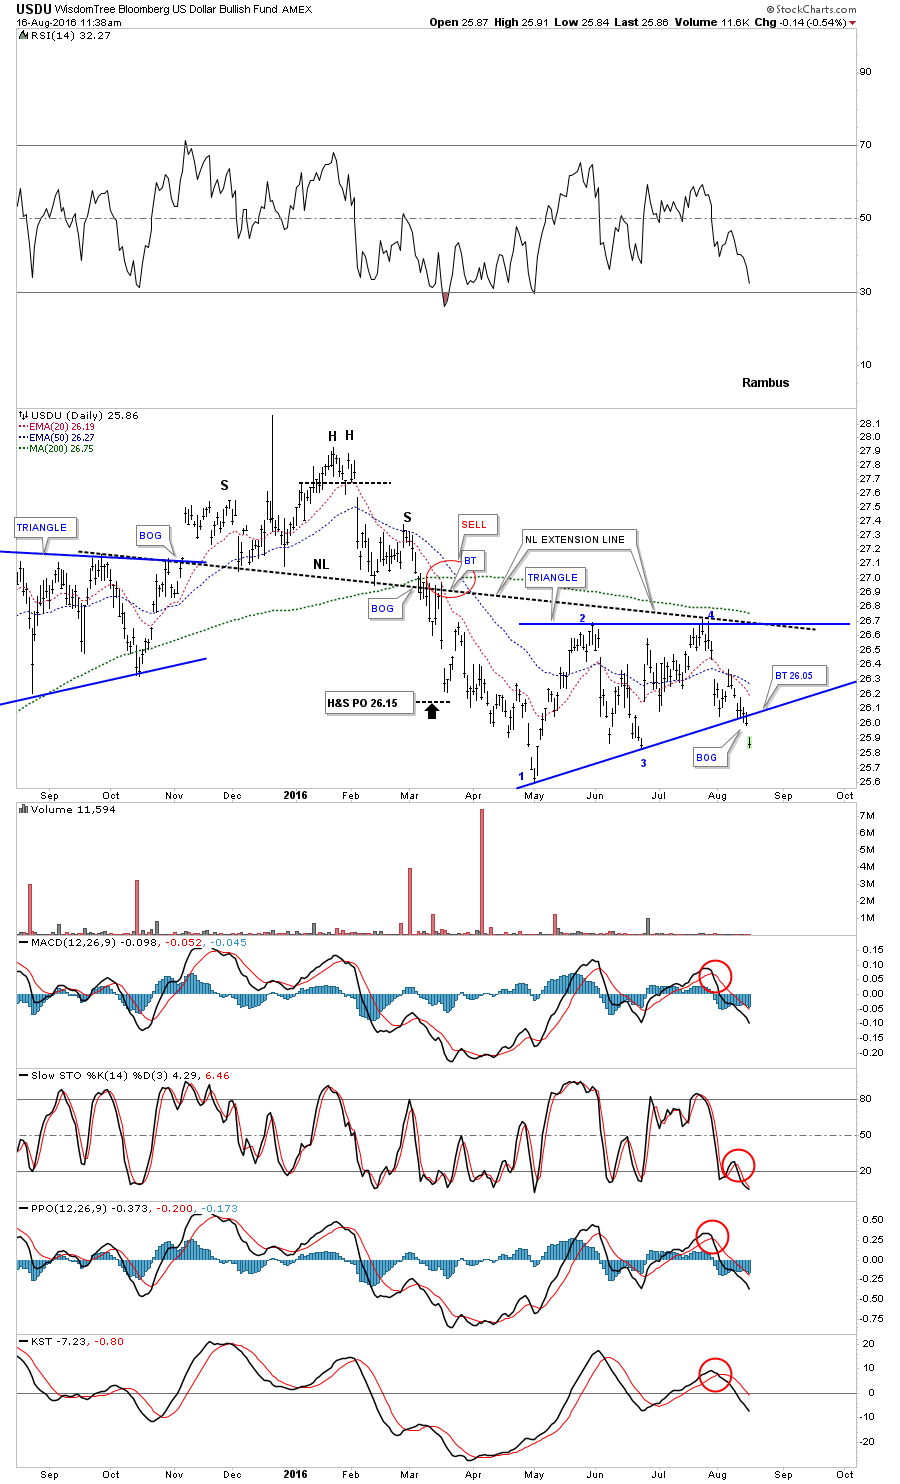
We started following this US dollar index about a year or so ago which has a more equal weighting of different currencies than the $USD. Even though I don’t post it much this Alternative US dollar index has some very interesting Chartology on it which may be giving us an important clue as to the intentions of the Dollar.
If you recall the Standard US dollar index ($USD) was testing a major inflection point in May around the 92 area earlier this year. It did finally bottom but left some unfinished business behind. This is the daily chart I was following at the time for the USDU which shows the H&S top in place and the decline that took the price action down to the low at the 25.50 area. From that low the USDU began a decent rally but couldn’t trade above the neckline extension line at reversal point #2 before the bears took charge again. The bulls were able to stop the decline at reversal point #3 and a laborious rally took the USDU back up to the top of the trading range where the neckline extension line came into play again along with the 200 day moving average.
Reversal point #4 started the next decline back down to the bottom rail of what we can now call a triangle that has four completed reversal points when the price action hit the bottom rail recently. The bulls were able to only put in a modest rally over next four days when the bears took charge again. As you can see, yesterday the bears were able to break the bottom rail of the blue triangle and today that was followed by a large gap down. When you’re following a well defined chart pattern and you see a gap over an important trendline that generally signals the pattern is finished building. It’s never 100% but generally that is a good sign.
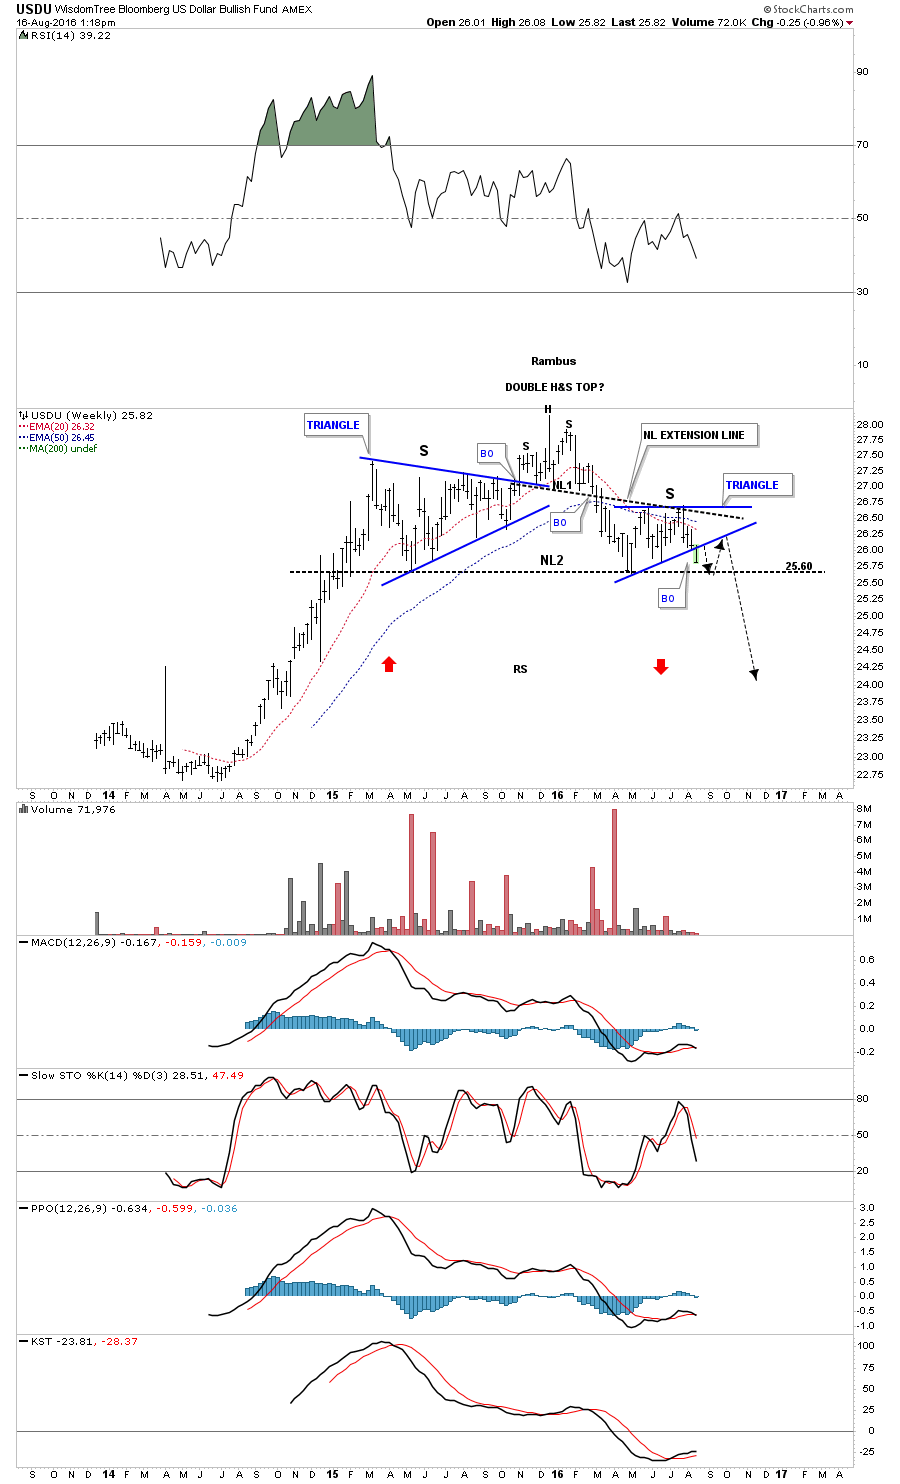
As always it’s important to put the consolidation pattern in perspective to see how it fits into the bigger picture. The weekly chart below shows the potential of what might be happening. As you can see the blue triangle is breaking down this week which may very well be the right shoulder of a much bigger H&S reversal pattern with the big neckline #2 being part of a double H&S top.
The next thing we’ll be watching very closely is how the price action interacts with big neckline #2. There is a good possibility that we could see a ping pong move between NL# 2 and the bottom rail of the blue triangle consolidation pattern as shown by the black arrows. That’s what I would expect to happen but there is no way to know ahead of time. So now we can watch the price action and let it tell us what it wants to do by the way it trades between the neckline and the bottom rail of the blue triangle. If the bears are really in charge and the bulls are extremely weak then we could see a breakout gap below neckline #2. At least we have something concrete to work with now.
One last note on the weekly chart below. I’ve added two red arrows that shows how this index could reverse symmetry back down if this big H&S top plays out. How the price action went up is often how it comes back down over the same area when there was a strong move with small or no consolidation patterns that formed. Stay tuned. If this pattern plays out we could be witnessing a large trend reversal in the most important chart on the planet .
….related: Faber Warns of A Currency Collapse

-
I know Mike is a very solid investor and respect his opinions very much. So if he says pay attention to this or that - I will.
~ Dale G.
-
I've started managing my own investments so view Michael's site as a one-stop shop from which to get information and perspectives.
~ Dave E.
-
Michael offers easy reading, honest, common sense information that anyone can use in a practical manner.
~ der_al.
-
A sane voice in a scrambled investment world.
~ Ed R.
Inside Edge Pro Contributors

Greg Weldon

Josef Schachter

Tyler Bollhorn

Ryan Irvine

Paul Beattie

Martin Straith

Patrick Ceresna

Mark Leibovit

James Thorne

Victor Adair