
Currency
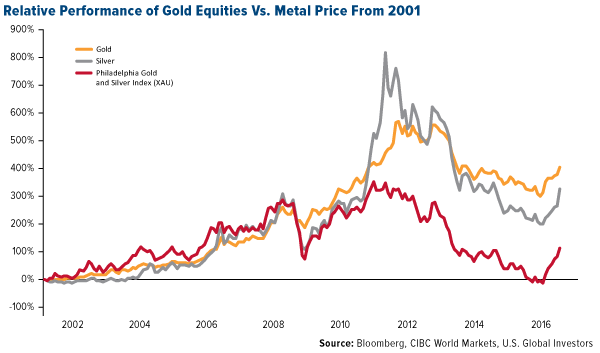
 We have already figured out that, faced with the choice between doing “helicopter money” and allowing a deflationary implosion to occur, those in power will elect the former, because it buys them more time by keeping the system limping along for longer, and we have now arrived at the stage where it will be one or other. The market has already figured it out too, which is why gold and silver have started a new bullmarket.
…related: Faber Warns of A Currency Collapse

Strengths
- The best performing precious metal for the week was gold, holding in with a 1 basis point drop. According to the World Gold Council, global gold demand in the second quarter increased 15 percent due to a 141 percent rise in investment demand. The Royal Mint also commented on a “surge” in demand, specifically when the Bank of England cut rates – during that week the Mint saw a 25-percent increase in transactions on its bullion website, reports BBC. The Mint’s “signature gold” has also allowed buyers to purchase fractions of gold bars, causing sales to jump 140 percent.
- Japan is the “star performer” among smaller gold consumers, reports Bloomberg, with four straight quarters of positive net investment into bars and coins. Demand expanded to 5.8 metric tonnes in the second quarter. The World Gold Council cites distrust of Abenomics, negative interest rates and a rising yen for the investment boost. In China, vehicle sales in July gained the most in 17 months, sending palladium to touch a one-year high. Speculation is that supply won’t be enough to meet demand, reports Bloomberg, as the metal is used in the making of car parts.
- Gold prices jumped this week as investors reevaluated the likelihood that the Fed will raise rates this year, reports Investing.com. The Labor Department said nonfarm business sector labor productivity fell 0.5 percent in the second quarter (extending the longest decline since 1979). According to BMO Private Bank, economists surveyed expected a 0.4 percent gain for the three months ended June.
Weaknesses
- The worst performing precious metal for the week was platinum losing 2.03 percent, on what may have been profit taking following the very strong rally in the platinum group metal prices over the last two weeks.
- According to BCA Research, the U.S. labor market strength is a “conundrum.” Last week’s jobs report came in strong and although U.S. real GDP is up only 1.2 percent year-over-year, employment has grown by a stronger 1.9 percent year-over-year, the group points out. It is uncommon for GDP growth to be weaker than employment growth, and such a gap is “unsustainable as businesses will experience continued erosion in profit margins.”
- Following the U.K.’s vote to leave the European Union, gold prices soared to the highest level since 2014. The higher price is one reason that China, the world’s biggest producer and consumer of gold, cut purchases in July, reports Bloomberg. The People’s Bank of China increased its gold holdings by the smallest amount since it began disclosing purchases about a year ago.
Opportunities
- David Haughton of CIBC says the gold rally we’ve experienced so far this year is sustainable. He points to three key factors: 1) Comparing this rally to five others over the past 40 years shows gold equities are still 40-50 percent off the previous high, while historical cycles reached around 20 percent of old highs in the same time frame. 2) Most companies are now demonstrating fiscal discipline that could support outperformance ahead. 3) Investors are mostly underweight gold equities and macro factors appear supportive.
- In its Gold Sector Review report, Credit Suisse points to several demand trend updates for the second quarter of 2016. The group explains that mine supply was flat year-over-year, as production from new streams was offset by declines in existing assets. They forecast mine supply to fall 7 percent by 2018 versus the 2015 level driven primarily by declining grades and a lack of new projects coming on-stream due to industry capex cuts since 2013.
- In the Financial Times this week, investment expert and precious metals analyst Diego Parrilla writes that the gains seen this year in gold are just the beginning of a new gold bull market. “My view that there is a perfect storm for gold is based on three closely interrelated dynamics, whereby central banks and global markets are both testing the limits of monetary policy and credit markets as well as the boundaries of fiat currencies.”
Threats
- Andrew Garthwaite of Credit Suisse published his opinion on gold and gold mining stocks Friday, pointing to three tactical concerns he has with the metal: 1) Gold moves inversely with real bond yields, and he thinks real rates will rise. 2) Gold moves inversely with banks, and he thinks financials will outperform if bond yields rise. 3) Gold is overvalued base on his model.
- With the probability of three rate hikes from the Fed through to the end of 2017, Picet Wealth Management believes that gold may have met its match after a stellar start to the year, reports Bloomberg. “With the dollar in a long-term uptrend, bullion isn’t likely to break the $1,430 an ounce level,” said Luc Luyet, a currencies strategist at the Picet.
- With a rally in gold prices so far this year, purchases in India (the world’s second-biggest consumer) will be reduced, reports Bloomberg, trimming import prospects amid high inventories. Historically, the second half of the year is normally better for gold demand from Indian brides, but so far this year a “rally of 25 percent in the first six months has hit the buffers,” continues Bloomberg, with higher costs deterring jewelry buyers.

Bond Sentiment will lead to a Cycle Turn
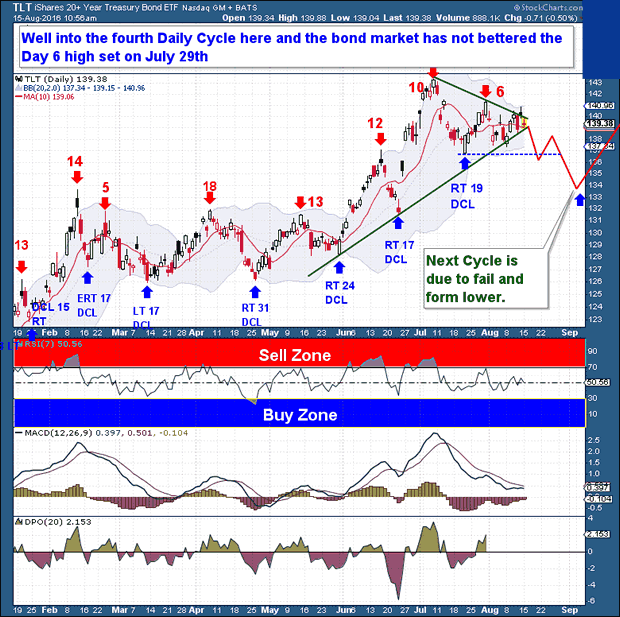
The Bond market has obviously been in a strong rally since the April Investor Cycle Low (ICL). History teaches, however, that even during solid bull market moves, corrections into major Cycle Lows are a normal part of the Cycle flow process.
And this is where we find Bonds today. The Commitment of Traders report shows a massive Long speculative position, while overall Bond Sentiment remains sky-high. Weekly Cycle timing is well into its topping range, and the 4th Daily Cycle (shown below) is beginning to struggle. I would never count Bonds out, at least until we see a failed Daily Cycle, but I am starting to believe that a new down leg in Bonds is almost upon us.
A technical caution – if price were to move higher and exceed the current day 6 high, a bullish continuation is possible. For the bulls, loss of the 10-day moving average would be extremely negative, as it would signal a potential downturn and Left Translated Daily Cycle.
The Financial Tap – Premium
The Financial Tap publishes two member reports per week, a weekly premium report and a midweek market update report. The reports cover the movements and trading opportunities of the Gold, S&P, Oil, $USD, US Bond’s, and Natural Gas Cycles. Along with these reports, members enjoy access to two different portfolios and trade alerts. Both portfolios trade on varying time-frames (from days, weeks, to months), there is a portfolio to suit all member preferences. NOTE: special offer SIGN UP PAGE!
….related: Big Hitters Warn Of Market Meltdowns


Commodities
The decline in crude oil fell into the Sequential Buy Pattern, which concluded earlier in the week. Also, as Ross pointed out it was declining into support. The market seems to be turning and it could retrace around half of the recent loss. That works out to 45.50, or there-a-bouts.
The turn was being helped by the weakening dollar, which could continue flat to down through August.
For most commodities, we have been looking for a trading range through August, and perhaps into September. Often crude can set a seasonal high around late September.
However, as pointed out a few weeks ago breaking below 41 would be significant. The low was 39.26 on Tuesday.
Most commodities started the August trading range at support. The DBC declined to the 200-Day ma at 13.96 on Tuesday and has recovered to 14.21.
Base metals (GYX) tested support at 271 a couple of weeks ago and are at 277. The last high was 283 and getting beyond that level the swing could reach 300.
Grains (GKX) soared to 339 in early June and slumped to 281 on Tuesday. This was down to 30 on the Daily RSI and at support. Firming for some weeks is possible. There is resistance at the 293 level.
Since March, lumber’s advance has had corrections limited by the rising 50-Day ma. The high at 338 a couple of weeks ago was at resistance. And, again, the correction was to the
50-Day, this time at 313 on Monday. There is resistance from 338 to 342 and we still think a cyclical peak is building.
This year’s “Rotation” in iron ore was outstanding. That’s in the price gain as well as in its technical peak. The low was 31 in January and the high was 60.58 in April, which generated a Sequential (9) Sell. The price fell to 42 at the end of May.
The next zoom made it to 58.65 on Monday.
This was with enough thrust to register a Sequential Sell on both the 9-week and 13-week determinations. This should be effective within a week.
We can’t help but wonder if iron ore and copper have been again leveraged in the financial engineering game that was the sensation in 2015. As Shanghai was blowing out.
Once rolled, the target becomes the low at 42. After all, iron is the most common element, not the most precious.
Small Cap Valuation Goes Sky High

Source: Zero Hedge
- “Normal” is around 11.
- Now at 21.
- Latest rally is testing the December high.
- What could drive it higher?
- What could go wrong?
GDP: Rate of Change and Recessions

- Note the “best” level reached in June 2007.
- Also note the jump as crude oil and credit spreads came off of their best in June 2014.
U.S. Leveraged Loan Default Rate Since 2003

Debt to EBITDA Ratios

- The two previous sharp increases occurred in severe contractions.
- Perhaps an involuntary plunge in earnings.
- The huge rise since 2011 seems to be during the “good times”.
- Could be driven by an inordinate increase in debt.
- While voluntary, it may soon be regrettable.
The above is part of Pivotal Events that was published for our subscribers August 4, 2016.
also: Peter Schiff on Central Banks Are Choking Productivity
Listen to the Bob Hoye Podcast every Friday afternoon at TalkDigitalNetwork.com

It’s a fledgling industry with a $6 billion dollar price tag. The question – is it time for a little weed in your portfolio? Justin Trudeau’s government intends legalize by next spring and 25 US states have now passed medical marijuana laws, 4 states allow recreational use.
Perhaps related? another Big Fat Idea – Making Money From The Oldies


-
I know Mike is a very solid investor and respect his opinions very much. So if he says pay attention to this or that - I will.
~ Dale G.
-
I've started managing my own investments so view Michael's site as a one-stop shop from which to get information and perspectives.
~ Dave E.
-
Michael offers easy reading, honest, common sense information that anyone can use in a practical manner.
~ der_al.
-
A sane voice in a scrambled investment world.
~ Ed R.
Inside Edge Pro Contributors

Greg Weldon

Josef Schachter

Tyler Bollhorn

Ryan Irvine

Paul Beattie

Martin Straith

Patrick Ceresna

Mark Leibovit

James Thorne

Victor Adair