
Gold & Precious Metals
Over the past two weeks the precious metals complex has retested its Brexit breakout and rebounded back to the July highs. Today’s jobs report has pushed the complex lower but has delivered an opportunity to cash heavy portfolios which have missed the bulk of the move. With that said, we wanted to share our current analog charts for Gold, gold stocks and junior gold stocks which suggest continued upside potential in the sector.
The first chart plots the current rebound in Gold compared to the average of its two strongest cyclical rebounds (1976 and 2008) and the average of four rebounds (including 1976 and 2008) within its secular bull markets. As we can see, the current rebound is closely following the average of the four rebounds. If Gold continues to follow that path then it could reach $1500/oz before the end of the year and retest its all time high of $1900/oz by the end of next year.
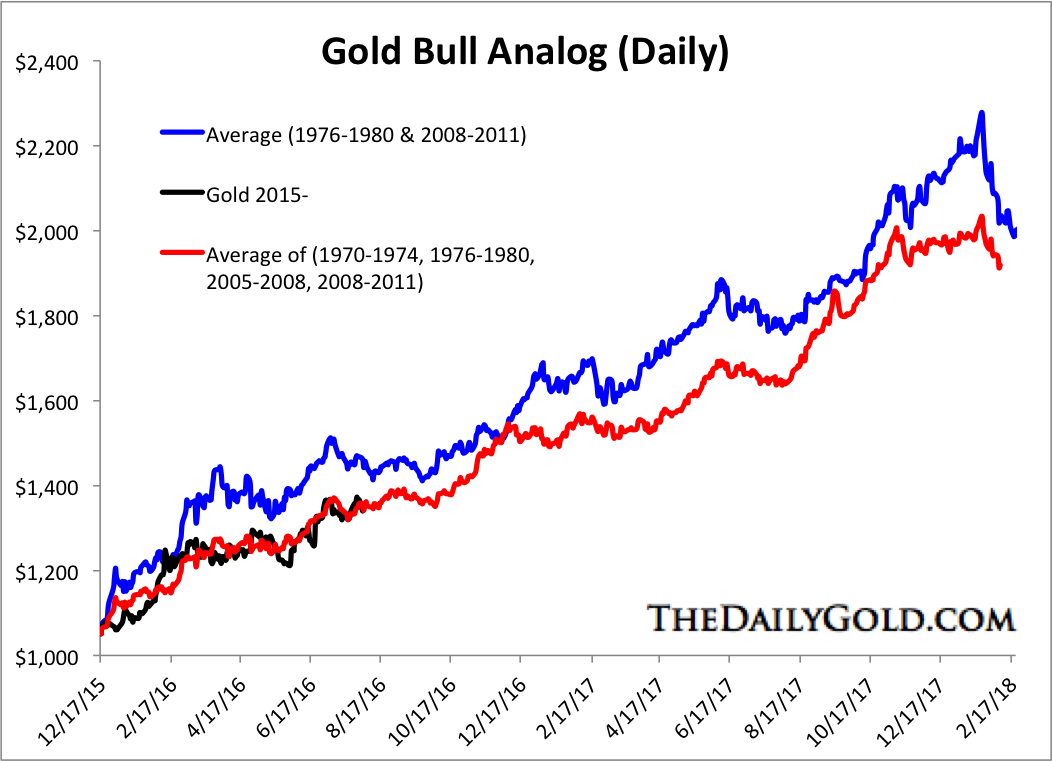
Gold Bull Analog
Turning to the stocks we find that the large miners are fairly extended at present. The HUI is currently above the other two rebounds. If the HUI continues to follow the path of the last cyclical bull market (2008-2011) then it has somewhat limited upside. However, considering my research and analysis, the recent low in gold stocks figures to be quite a bit more like the 2000 low. By following that path the miners could triple over the next two and a half years.
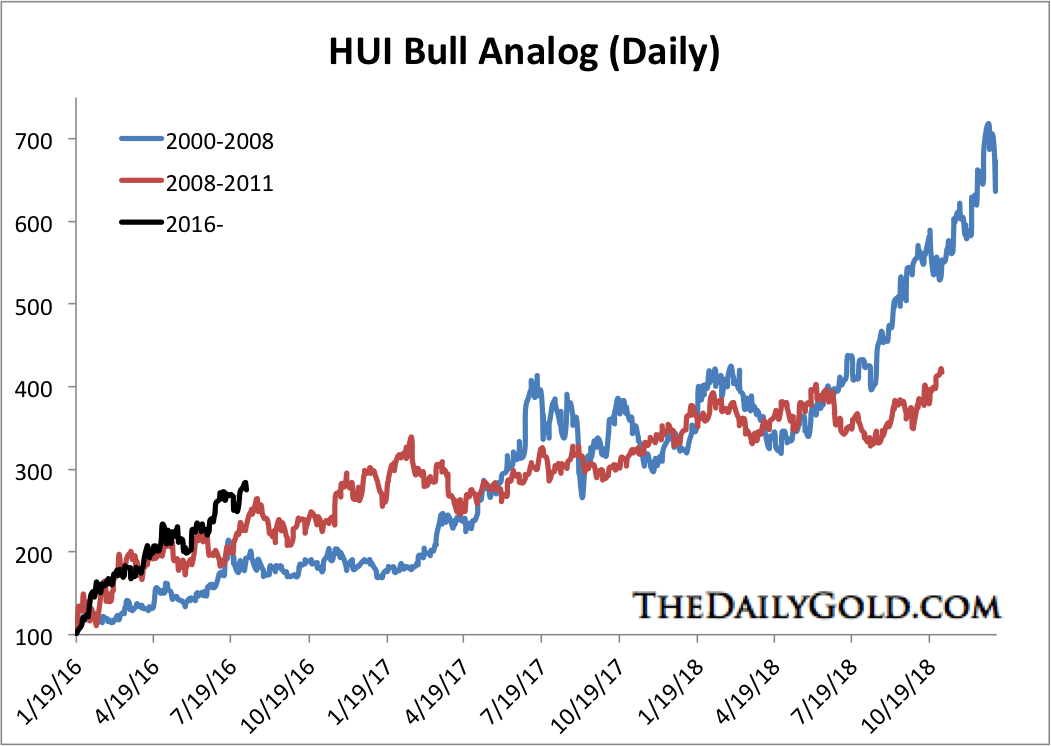
HUI Bull Analog
My own research and discussions with industry sources (folks with more experience and knowledge than me) leads me to believe the best value is currently in the juniors and the smallest juniors. My junior index bull analog chart shown below confirms that view. My index has already tripled but has plenty of upside potential over the next six months and two years.
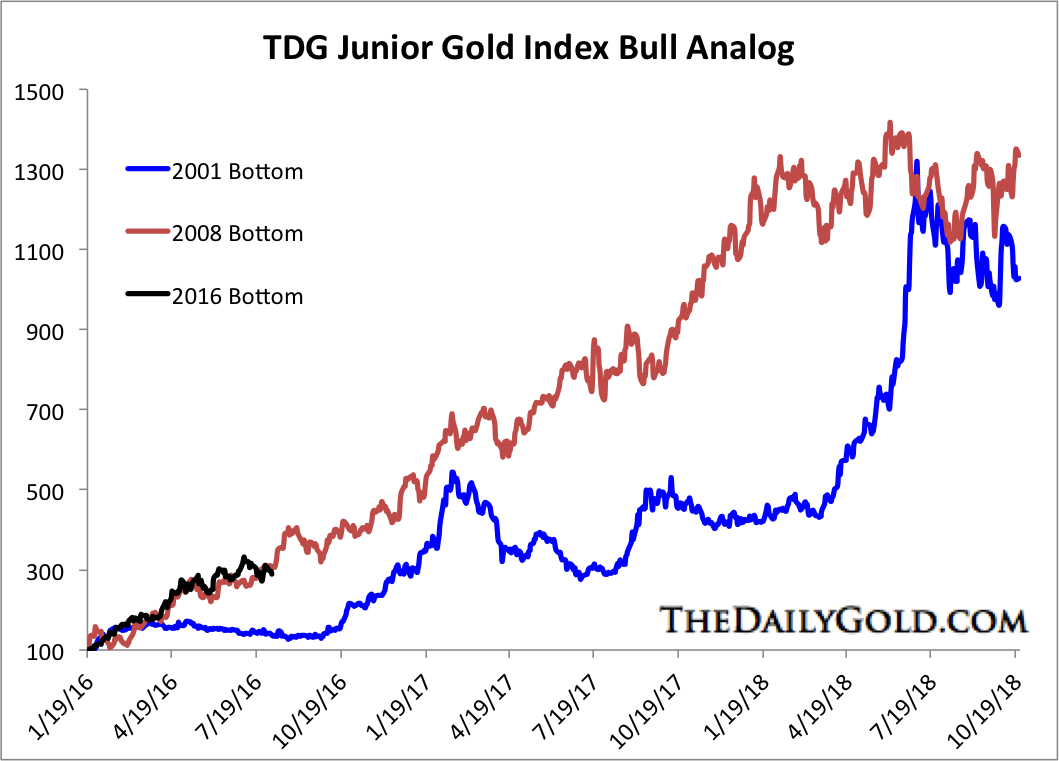
TheDailyGold Junior Bull Analog
Thus far Gold and gold stocks appear to be tracking history quite well. If the bull market continues then these charts should continue to provide some context as to where things could go. History is a very good guide but it is not perfect. No indicator by itself is infallible. In addition to historical analogs we also employ technical analysis, intermarket analysis and various sentiment indicators. We reiterate our view that precious metals are in the early stages of a cyclical bull market that has a chance to turn into a full blown mania. Our views are always subject to change but we remain bullish over the near term.
Jordan Roy-Byrne, CMT, MFTA
related:

 Can you afford NOT to get this special MoneyTalks exclusive 80 page report + accompanying video commentary? WE DON’T THINK SO
Is it because it is one of the most comprehensive breakdowns of the gold market we’ve ever seen? And includes data that will help you understand the markets for decades to come? AS A STARTING POINT, YES
Is it because it is a great deal at only US$99? PARTLY
Is it because Greg’s macro-analysis provides insights into the financial world as a whole? IT IS DEFINITELY A BONUS
The number one reason? THE OPPORTUNITY TO MAKE MONEY
On January 4th 2016, Greg Weldon came on MoneyTalks and presented the idea that the Precious Metals sector would END its four-year bear market, and embark on a new “leg” of what he called an ongoing secular bull market. He even offered some specific recommendations in his MoneyTalks exclusive report “Gold & Silver, Time to Rise and Shine”, including First Majestic Silver which is up +425%, and the Mining ETFs GDXJ and SIL.
Greg said that he felt Gold and Silver were as UNDER-VALUED at sub-$1100 levels, as it was when he wrote his bullish thesis in the form of the 2006 book “Gold Trading Boot Camp”, in which he predicted a housing market/consumer linked credit crisis in the US, which would lead the Federal Reserve to print money, monetize US Treasury debt, and expand their balance sheet by trillions of dollar, in essence devaluing the USD and sparking a major rally in the Precious Metals, when Gold was trading below $600 per ounce.
Now, with the understanding that Greg is NOT a ‘gold bug’, and has offered a bearish opinion on Money Talks throughout 2012 and 2013 …
… what if Greg were to suggest that today, even after the MASSIVE YTD-gains in the Precious Metals sector, that Gold (and Silver) remain not only “undervalued’, but are downright CHEAP at current prices … might you be interested to know exactly WHY he is saying that ???
Find out, by dissecting his latest massive, mega-macro research report “What is the “Real Value” of Gold in Today’s Market??”
For a mere US$99, a MoneyTalks special discount of MORE than HALF from the retail price of $249 … see all 80 pages, and check out the accompanying half-hour video with Greg’s color commentary, explaining WHY he is as bullish on the Precious Metals today, as he was in 2006, when Gold was trading at $600 … despite the doubling in price since then.
We ask, did you take advantage of the information contained in Greg’s January report??
For sure, you will not want to miss out on the next big move … a move that will again, most likely, make the purchase price seem like mere pennies on the dollar.
So, to access this wide-ranging and in-depth report that touches upon things such as Negative Bond Yields, a Global Bond Market Bubble, policies that Central Banks are likely to pursue in the future, the ongoing global Currency War, a still-intensifying global Sovereign Debt crisis-in-the-making, Commodities, along with the growing push towards expanded fiscal stimulus and renewed growth in fiscal deficits … along with detailed coverage of the Precious Metals sector….
You are going to have to order it personally through Greg’s assistant Katelyn Ellis. I know this is somewhat unusual but it was the only way we could offer the special price without upsetting Greg’s US-based clients.
EMAIL KATELYN before midnight Sunday to ensure you get a copy of the 80 page report and the accompanying video commentary. Or call Katelyn at 1.561.283.1815

“Short-sellers are going to have to decide next week to move down stops to protect profits, or the market will be in a position to rally further and force you out at the worst possible moment”

In the latest edition of the Oil Price Weekly Report, they take a look at some of the most interesting figures put out this week in the energy sector.
….read all the stories and charts above in the entire weekly issue HERE

The whole idea of a consensus in the scientific realm is to prevent anyone from asking uncomfortable questions. Oddly, there are other critical areas today where a considerable consensus carries no weight whatsoever
also Michael’s Mid-Week Comment – Vancouver’s Real Estate Market is Finally Cooling


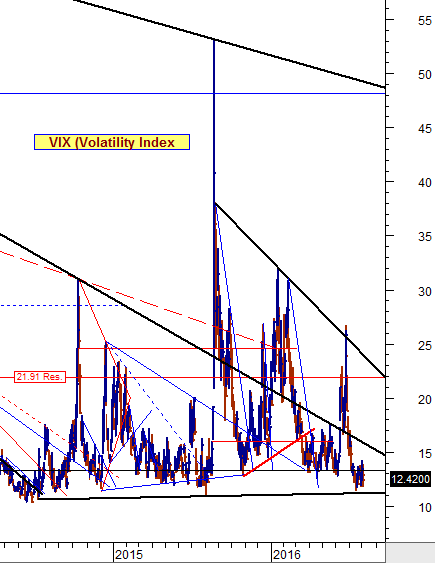
The risk levels for the future remain high …
Take a look at the chart of the VIX that we posted today and note that the VIX has been moving down toward its support line, but has not reached it quite yet. As it moves down, the stock market moves up because the VIX moves opposite to the stock market.
Seeing that there was a recent breach on the most recent fan resistance line, there is a very strong possibility that it will be retested.
also from Larry Edelson:

-
I know Mike is a very solid investor and respect his opinions very much. So if he says pay attention to this or that - I will.
~ Dale G.
-
I've started managing my own investments so view Michael's site as a one-stop shop from which to get information and perspectives.
~ Dave E.
-
Michael offers easy reading, honest, common sense information that anyone can use in a practical manner.
~ der_al.
-
A sane voice in a scrambled investment world.
~ Ed R.
Inside Edge Pro Contributors

Greg Weldon

Josef Schachter

Tyler Bollhorn

Ryan Irvine

Paul Beattie

Martin Straith

Patrick Ceresna

Mark Leibovit

James Thorne

Victor Adair