
Currency
The US Dollar Index price action has played out exactly as forecast in recent subscriber analysis. That analysis reduced the price expectation for the bear rally and the recent high of 97.62 was a bingo hit.
Let’s review the technicals beginning with the daily chart.
US Dollar Index Daily Chart
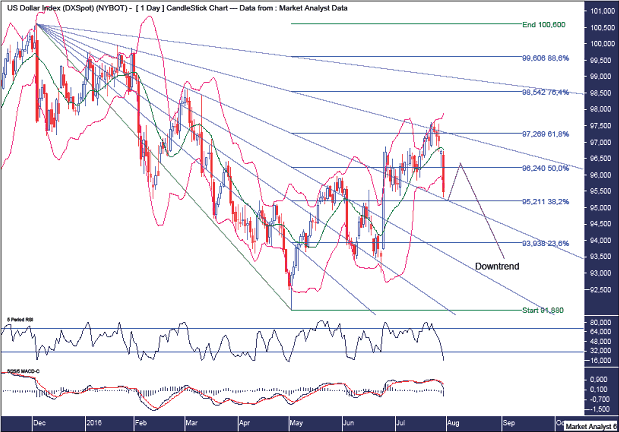 Previous analysis forecast this bear rally to clip the 61.8% Fibonacci retracement level of 97.26. Nice.
Previous analysis also forecast this bear rally to top out around resistance from the 76.4% angle. Nice again.
Price is now back down near the 61.8% angle and I expect some very temporary support to come in shortly and lead to a weak little rally. This rally should provide bears one last opportunity to get short before a big whoosh south commences.
The Bollinger Bands show price is back at the lower band and any subsequent rally will struggle to get back to the middle band in my opinion.
The RSI is looking very weak while the MACD indicator has just made a bearish crossover.
Let’s move onto the monthly chart.
US Dollar Index Monthly Chart
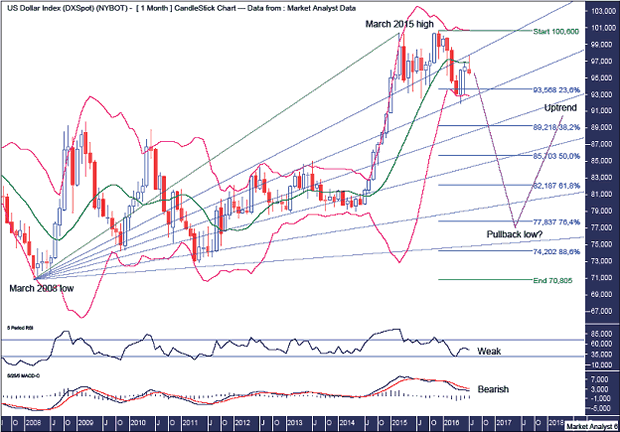
Previous analysis forecast this bear rally to top out around resistance from the 23.6% Fibonacci Fan angle and that is exactly what has occurred. I favour the final bear market low to be down at least at the 76.4% angle and possibly even the 88.6% angle.
The projection for pullback low remains unchanged being between the 76.4% Fibonacci retracement level at 77.83 and the 88.6% level at 74.20.
The Bollinger Bands show the middle band providing resistance as expected and laid out in previous analysis.
The RSI is weak while the MACD indicator is bearish.
Let’s wrap up the analysis by reacquainting ourselves of the even bigger picture using the quarterly chart.
US Dollar Index Quarterly Chart
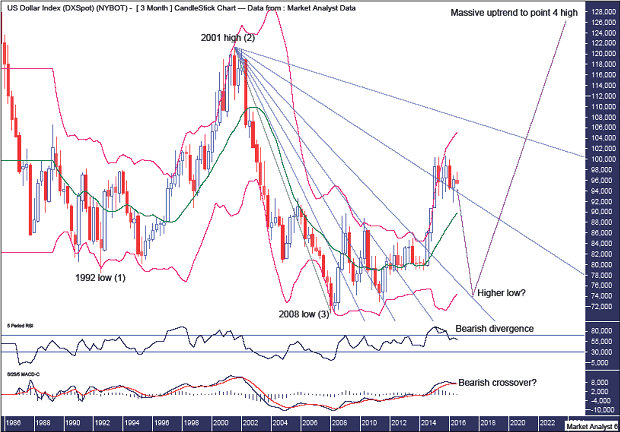
I have shown this chart before and it lays out my expectation of a massive 5 point broadening low in process with points 1 to 3 already in place. Price is now on its way to a point 4 high but I expect some volatile price action before that then.
The Bollinger Bands show price has left the upper band and next stop appears to be the middle band with the final low, a higher low, to be around support from the middle band.
I have drawn a Fibonacci Fan from the 2001 high to 2008 low. Price has recently been flirting above the 76.4% angle but I believe this a false dawn and price is set to break below and then get smashed down to the 61.8% angle to set up the higher low.
I expect this quarterly candle to form a bearish outside reversal candle which means price will have to take out the previous quarter’s low of 91.88
The RSI shows a bearish divergence while a bearish crossover in the MACD indicator looks imminent.
Summing up, I expect price to get absolutely creamed over the next 12 months or so with the bears set for a big feast!
http://www.thevoodooanalyst.com
related:

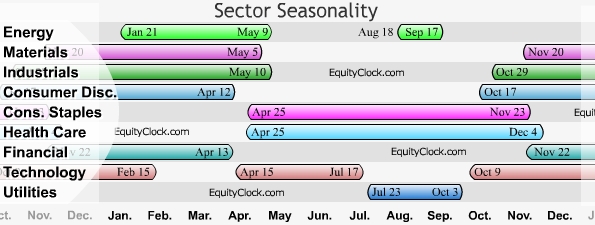
In their monster hit, “Turn,Turn,Turn” The Birds famously sang – “to everything, there is a season.” That’s certainly true with gold, stocks, currencies and every other investment, which is why Mike loves to talk with the foremost expert on seasonality – Don Vialoux. Find out which groups to drop and which ones are about to get hot.
…also Mike’s Editorial: They Just Don’t Get it

You gotta be wondering – how did this happen? 324 million people and the choice for President is between a blowhard who has never been held hostage by the truth and the pathological liar who’s used government as her own personal ATM machine. The answer reveals it’s part of a bigger story you can’t afford to miss.
Also Mike’s Quote of the Week: The Road To Significant Losses
 1. Martin Armstrong: Throw Out the Fundamentals—Negative Rates Could Push the Dow Up to 40,000
Armstrong covers a lot of ground, projecting a Trump win over Hillary, an eventual collapse of the euro, global monetary reform between 2018-2020, and, perhaps the most controversial, a “phase transition” in the stock market (like going from liquid to gas) as global capital escapes low or negatively yielding government bonds for corporate debt and equity.
2. A Truly Great Interview With Uber Money Manager, James Thorne
by Michael Campbell
Brexit, Federal Reserve, Turkish Coup…what does it mean for your investments? What’s coming next? Not an easy answer but Caldwell Investment’s chief strategist, James Thorne says there’s one the key variable that you must keep a close eye on.
…..continue reading or listening HERE
3. A Potential Life Changing Market
The markets have a way to push you just beyond your limits to get you to do the wrong thing at the wrong time and then reverse on a dime. The bearish sentiment from just a casual observation over the last few weeks has felt like there was no way the bulls could rally the PM sector higher before there was a decent correction. In a new bull market the surprises come to the upside and not the downside.

 A moderate stimulus package from the Bank of Japan overnight got the final trading day of the week off to a disappointing start, leaving traders to look towards the large number of earnings and data releases today to pick them up again.
Days like today once again make you question whether the central banks really are reaching the limits of what the markets consider to be effective monetary stimulus tools. With interest rates already negative and government bond purchases at or near the limit of what is feasible, central banks have had to pursue other unconventional tools which have failed to get the markets too excited.


-
I know Mike is a very solid investor and respect his opinions very much. So if he says pay attention to this or that - I will.
~ Dale G.
-
I've started managing my own investments so view Michael's site as a one-stop shop from which to get information and perspectives.
~ Dave E.
-
Michael offers easy reading, honest, common sense information that anyone can use in a practical manner.
~ der_al.
-
A sane voice in a scrambled investment world.
~ Ed R.
Inside Edge Pro Contributors

Greg Weldon

Josef Schachter

Tyler Bollhorn

Ryan Irvine

Paul Beattie

Martin Straith

Patrick Ceresna

Mark Leibovit

James Thorne

Victor Adair