
Gold & Precious Metals
In a bull market corrections can end quickly. One minute you are projecting another 5-10% downside and the next, the market has left lower prices in the dust. A negative reaction to the Federal Reserve statement could have caused lower prices but instead Gold and gold stocks are now primed for new highs. Fundamentally, we know the Fed will do nothing to prevent real rates from remaining negative. Since the trend has turned, Gold and gold stocks have mostly ignored the moronic, empty drivel emanating from these supposed geniuses. Moreover, despite reports of increased potential for a rate hike in September, weakness in precious metals abated and buyers returned.
The hourly chart below reveals that the correction in the gold stocks was simply a retest of the July breakout from the upward sloping reverse head and shoulders pattern (in May and June). The strong rebound over the past few days allows us to deem the retest successful.
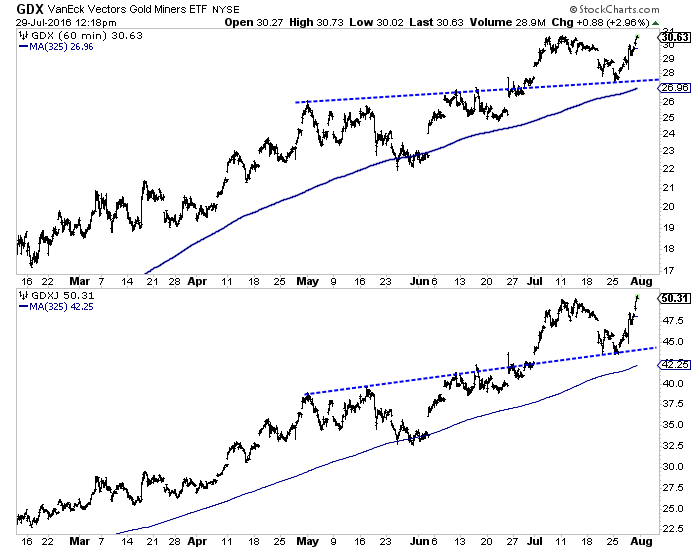
GDX, GDXJ Hourly
The weekly chart shows the same retest but also how the correction served as a retest of the breakout past the 2014 highs. The arrows mark the 2014 highs and the earlier low of this week. Our minimum downside targets were GDX $27 and GDXJ $41-$42. GDX touched $27 while GDXJ’s low came at $43.
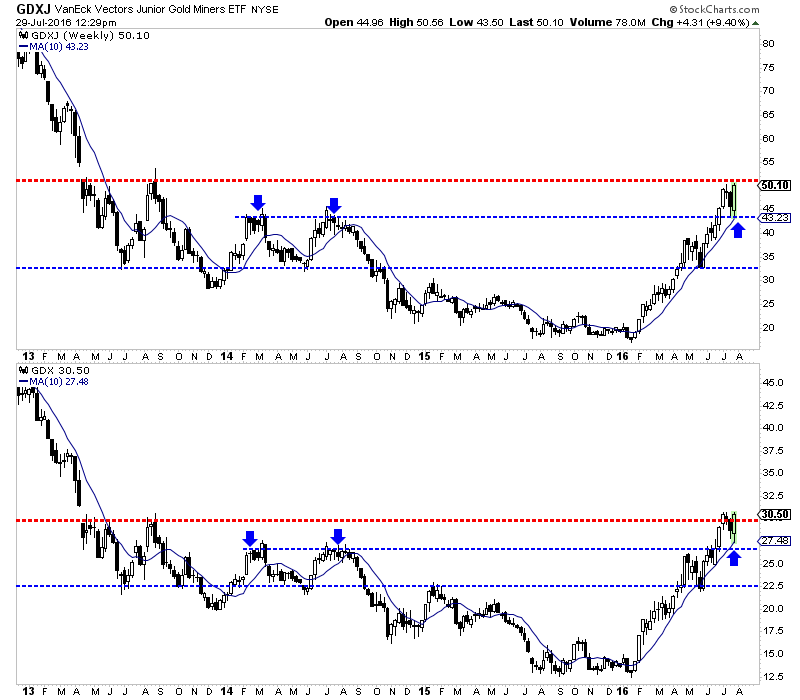
GDXJ, GDX Weekly Candles
Gold has also successfully retested its breakout. We thought it could come back to a minimum of $1300 and as low as $1280. Gold bottomed at $1310 this week and is set to close the week and the month well above $1330-$1335 resistance. Moreover, the strength in the miners since Wednesday reinforces that Gold will likely follow.
Summing it up, the correction is over and Gold and gold stocks could threaten new highs in August. A few weeks of consolidation near recent highs would not be bearish though. There are just too many people on the sidelines waiting to get in this market. They have been fooled by the CoT, the US Dollar rally or the meme that miners have gained too much too fast and need a big correction. Our views are always subject to change but we continue to see Gold reaching $1500-$1550 before any counter trend move. That implies plenty more gains in the miners in the weeks and months to come.
Jordan Roy-Byrne, CMT, MFTA

A year ago almost to the day we began tracking a “Macrocosmic” theme that would eventually see gold bottom and rise vs. stocks and bonds in 2016, joining its bullish status vs. commodities, which had been in place since 2014.
Nominal gold bottomed in December 2015 before silver, commodities and stocks as a counter cyclical environment birthed a new precious metals bull market. We updated the progress here, hereand here in 2016.
But markets, being the product of immeasurable moving parts, are always in motion and you cannot get too hung up on any one theme, ideology or habit. When the Semiconductor sector began burping up its positive signals for the economy and for stocks, we listened intently and I for one, put my capital where my mouth was and noted as much each week in NFTRH.
Back in April, with the first improvement in the Semiconductor Equipment sector”s bookings, we went on bull alert. By June 22, we had established a trend in the rising bookings and noted the Details Behind Semiconductor Leadership and the bullish implications that this Canary”s Canary in the coal mine carried.
With silver firmly leading gold and more recently palladium making a move as well, we had the makings of a risk “on” atmosphere. The “buy” point (and speaking personally, short-covering point) was the Brexit hysteria, which as NFTRH noted at the time was an (!) on the bear case and quite possibly, the deflationary case.
It was time for an economic growth spurt, quite possibly an inflationary economic growth spurt. First gold broke down vs. silver and then it did so vs. palladium. In January 2013 we used gold vs. palladium as a cross reference to the Semi Equipment upturn that had just begun.
This time we have an echo, only this time… silver is playing ball and hence, the precious metals are out in front of the broad market rallies and the indication may be inflationary as opposed to 2013″s global deflationary/US Goldilocks. Here is gold vs. commodities, with the key breakdowns in the last two panels.

The above signals are bifurcated as the top four panels point counter cyclical still, while the bottom two opened up a pro-economy cyclical view. We can only go by what is in the markets and what we have are some mixed signals. But the trend in the signals is toward a firming economy with potential increasing inflationary issues (the Fed”s stated goal is to increase headline inflation after all) as evidenced by the economy-leading, cyclical Semi Equipment sector and firming price signals within manufacturing.
So unlike the post-2012 phase when the precious metals and commodities got hammered into the depths of a bear market, we are using the “Greenspan blueprint” on the current cycle. In that scenario, gold and stocks can rise together.
The first phase of the precious metals” initial bull market rise is maturing and we have defined the stock market bull trigger out of the Brexit drama to be a “suck-in”, but so too was 1999-2000 a suck-in. A lot of actively shorting bears got blown up back then and a lot of actively longing bulls made money (temporarily, at least).
So the current stock market view is one of taking some of the well-earned profits (the market is generally very over bullish, sentiment wise) from having been brave while many were cowering at the negative hype and rotating to positions that look relatively prospective. For instance, I have been taking profits in the Semis (here and here for example), which are now over bullish with the herd stampeding in, and buying other items from Asia (ex-Japan) to India (each ongoing NFTRH+ trade ideas) to individual stock situations that look interesting.
In the precious metals, I tell you that I am not the one who has been a resolute bull with a “buy, hold, win” mantra. That would be my friend at IKN, who has distinguished himself so well this year not only in philosophy, but in the quality gold stock situations he covers. And yes, that”s a well deserved plug for a rarity in gold-sector-specific analysis.
In the precious metals, NFTRH simply continues to advise when risk is high (as with the recent short-term top amid rampant over bullishness) and when risk is favorable, as with an NFTRH update last Friday and last weekend”s (NFTRH 405) report. As part of #405″s “Wrap Up” segment…
“…over bullish sentiment is all gone (by Sentimentrader”s data, at least) in this bipolar sector. With the average gold bug now convinced of correction the sector seems to be shaping up for re-entry.”
There was one more hard down day and then all that negative sentiment manifested in a new bounce and potential new up leg.
We have our targets for the metals and the miners and given the mature state of the initial bull launch phase (as noted on March 4), I will continue to sell the surges and buy the pullbacks (especially when sentiment gets cleaned up as well as it did last week). Meanwhile, stop losses are easily observable in an up trend.
As we approach the end of summer and the rancorous political theater, market participants can be on alert for changes toward year-end and a return of volatility across most sectors. But for now, despite short-term risks building in stocks, we have passed 2016″s mid-point in great shape with markets generally performing per our indicators and thus, expectations.
Subscribe to NFTRH Premium for your 25-35 page weekly report, interim updates and NFTRH+ chart and trade ideas or the free eLetter for an introduction to our work. Or simply keep up to date with plenty of public content at NFTRH.com and Biiwii.com. Also, you can follow via Twitter @BiiwiiNFTRH.
 Yesterday, the Federal Reserve released their most recent monetary policy statement. How could it affect the gold market?
As widely expected, the Fed kept interest rates unchanged between 0.25 and 0.50 percent (traditionally, Kansas City Fed President Esther George dissented; she preferred to raise the target for federal funds rate by a quarter-point). The main reason for such a decision was again inflation which “has continued to run below the Committee’s 2 percent longer-run objective” and was “expected to remain low in the near term”.
However, the Fed sounded gently more hawkish. The FOMC members noted that “the labor market strengthened and that economic activity has been expanding at a moderate rate” and that “job gains were strong in June following weak growth in May. On balance, payrolls and other labor market indicators point to some increase in labor utilization in recent months”.
But probably the most important sentence from the statement is as follows: “near-term risks to the economic outlook have diminished”. It’s a signal that a rate hike in September is possible. However, the market odds of such a move actually diminished from 19.5 to 18 percent. It seems that investors did not buy the Fed’s message that a September hike is on the table. The truth is that if the Fed had really thought that the U.S. economy was strengthening, it would have hiked. Instead, it chickened out again, as it simply did not want to surprise the market. This is probably why gold gained after the Fed’s decision.
To sum up, the U.S. central bank kept its interest rates unchanged. It was a bit more hawkish, as it pointed out the strengthening labor market and reduced near-term risks. However, the Fed was not as hawkish as expected – it gave no indication about the possible timing of the hike. This is probably why the price of gold rose after the release of the statement. Some analysts say that September is a real option – although we cannot exclude such a scenario, we see it unlikely due to presidential elections later this year. The Fed’s inaction and the resulting flat expected path of the federal funds rate should be positive for the gold market, at least until the elections.
If you enjoyed the above analysis, we invite you to check out our other services. We focus on fundamental analysis in our monthly Market Overview reports and we provide daily Gold & Silver Trading Alerts with clear buy and sell signals. If you’re not ready to subscribe yet and are not on our mailing list yet, we urge you to join our gold newsletter today. It’s free and if you don’t like it, you can easily unsubscribe.
Disclaimer: Please note that the aim of the above analysis is to discuss the likely long-term impact of the featured phenomenon on the price of gold and this analysis does not indicate (nor does it aim to do so) whether gold is likely to move higher or lower in the short- or medium term. In order to determine the latter, many additional factors need to be considered (i.e. sentiment, chart patterns, cycles, indicators, ratios, self-similar patterns and more) and we are taking them into account (and discussing the short- and medium-term outlook) in our trading alerts.
Thank you.
Arkadiusz Sieron
Sunshine Profits‘ Gold News Monitor and Market Overview Editor
related:


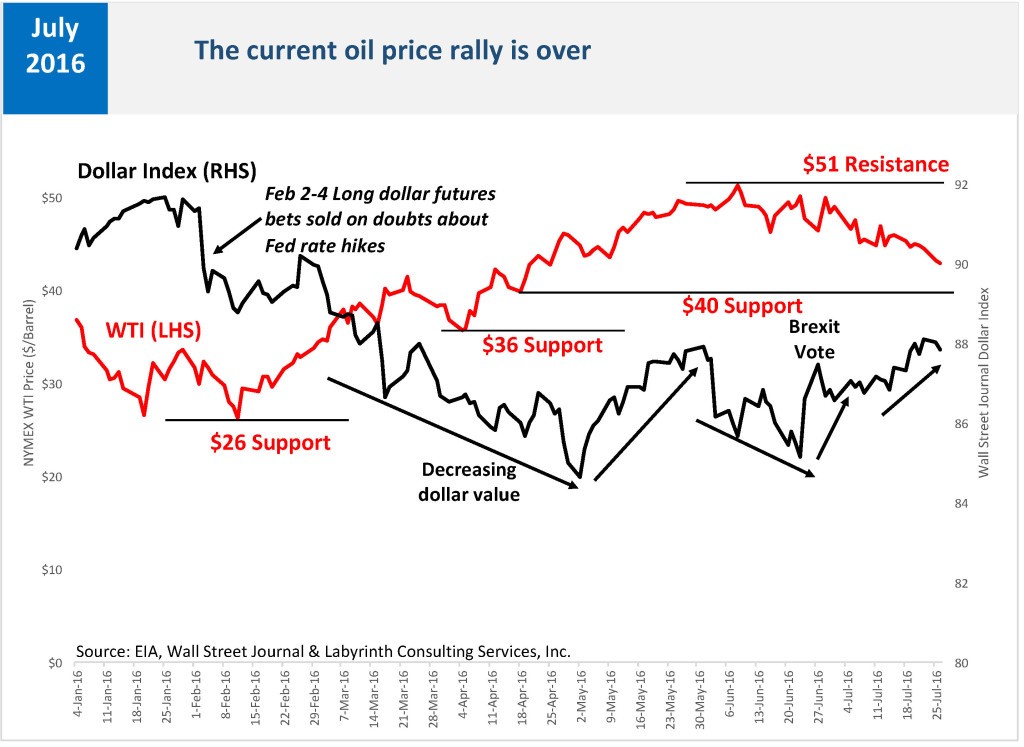
The current oil-price rally is over.
U.S. rig counts have surged as oil prices sink. Capital is driving the oil markets and it enables bad behavior by producers. That is why oil prices will stay low.
The oil-price rally that began in February is over. Prices rose from $26 per barrel to $51 by early June and are now below $42 (Figure 1). If they fall through $40, the next likely support level is at $36 per barrel.


-
I know Mike is a very solid investor and respect his opinions very much. So if he says pay attention to this or that - I will.
~ Dale G.
-
I've started managing my own investments so view Michael's site as a one-stop shop from which to get information and perspectives.
~ Dave E.
-
Michael offers easy reading, honest, common sense information that anyone can use in a practical manner.
~ der_al.
-
A sane voice in a scrambled investment world.
~ Ed R.
Inside Edge Pro Contributors

Greg Weldon

Josef Schachter

Tyler Bollhorn

Ryan Irvine

Paul Beattie

Martin Straith

Patrick Ceresna

Mark Leibovit

James Thorne

Victor Adair