
Timing & trends
Here we go again. Another Friday. Another attempted breakout above the 2100 level on the S&P 500. Over the last couple of months this has become a regular occurrence.
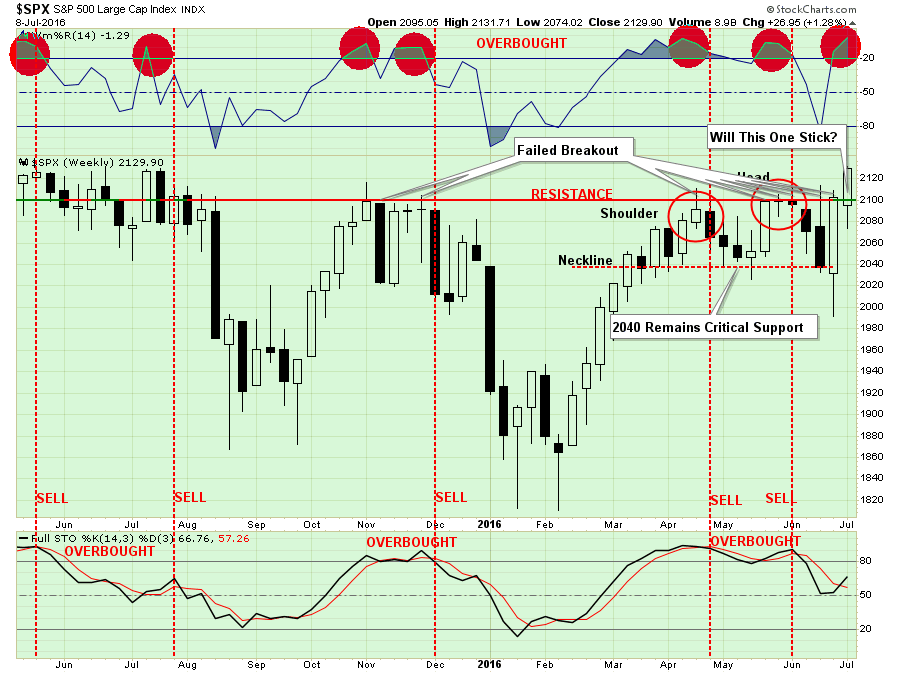
While the market is once again extremely overbought on a weekly basis, the employment report on Friday which showed a historically abnormal surge in June jobs growth, despite a weaker than expected wage increase and further negative revisions to May’s report, sent investors scrambling into the market. That push on Friday was enough to trigger a short-term buy signal and set the market up for a push to all-time highs.
However, don’t get too excited just yet. There are several things that need to happen before you going jumping head first into the pool.
also:
be sure to read Mike’s Interview Solid Quality Yield Recommendations

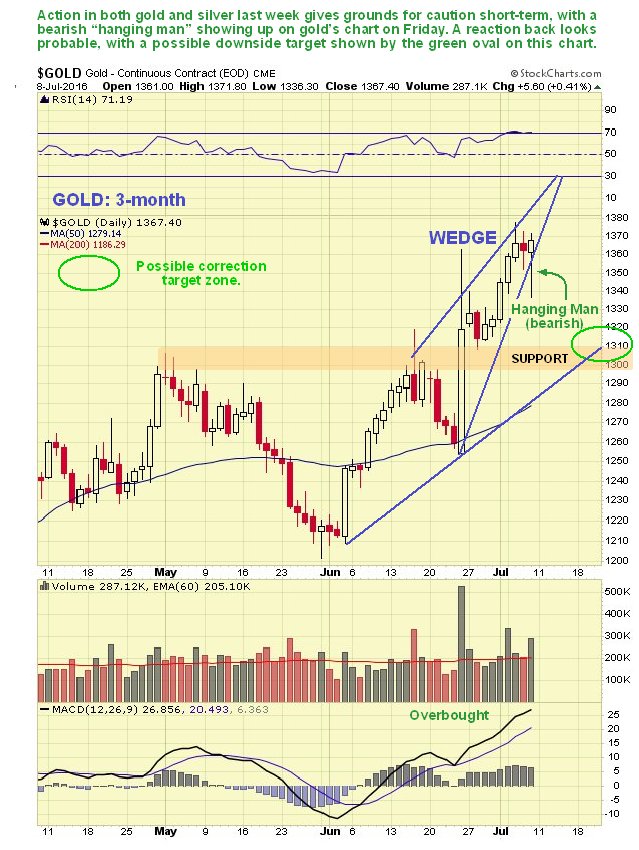
While I’m expecting some kind of pullback at the $1390-$1400 level, I don’t think gold’s intermediate cycle will top until at least retracing the 50% Fibonacci level and probably back to $1550 by September. This will almost certainly be driven by an aggressive moved down in the US Dollar as it really starts to accelerate into the next 3 year cycle low due sometime net summer or fall.
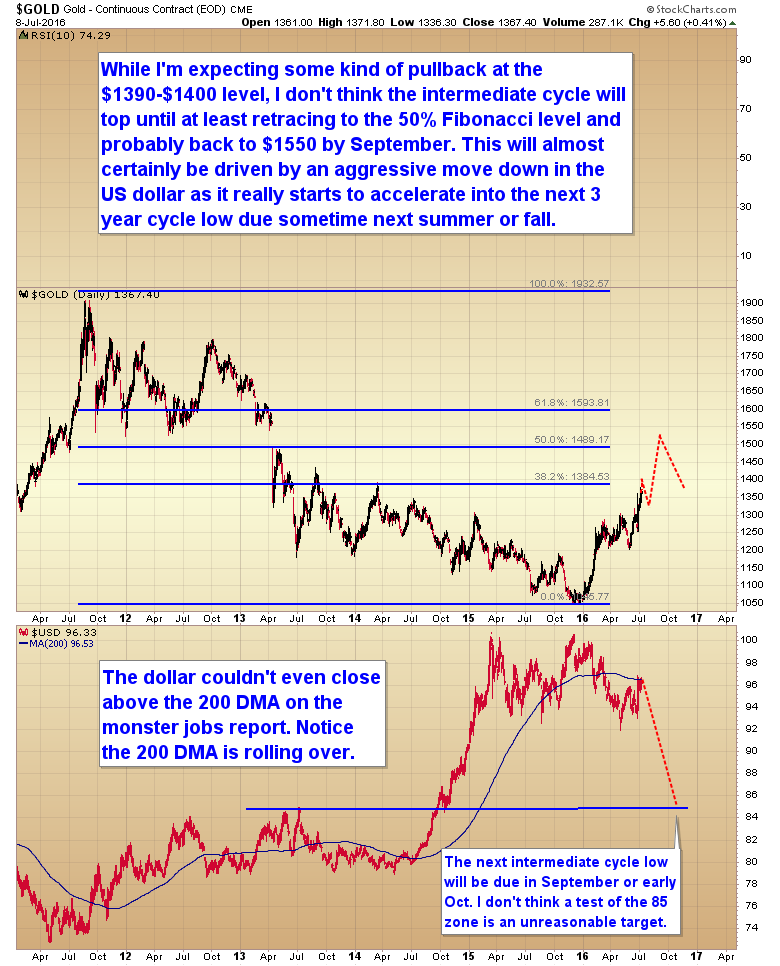
The dollar couldn’t even close above the 200 DMA on the monster jobs report. Notice the 200 DMA is rolling over.
The net intermediate cycle low will be due in September or early October. I don’t think a test of the 85 zone is an unreasonable target.
http://blog.smartmoneytrackerpremium.com/
related:

Today I like to share my thoughts about the S&P 500 index, the volatility index, and what I believe will be the trigger/event which sends stock markets around the world to new multi-year lows.
While the charts shown here are very simple there is a lot of information behind the scenes that backup the analysis/predictions on the charts below.
For example, the sentiment of the average market participant remains extremely bullish on the market. The majority of investors think and feel stocks will continue to rise in the coming year. Typically, when the majority of investors think the same thing it tends to be a contrarian signal that the opposite will soon take place.
Cycle analysis is telling us that the seven-year cycle, which is one of the most powerful cycles that reoccurs in the stock market is now topping. What does this mean? It means we should expect a 1 to 3-year stock market correction.
The market breadth has been slowly deteriorating over the past year. Fewer stocks are making new highs, and many leading sectors are already in bear markets.
So it is just a matter of time before the US large-cap stocks roll over, breakdown, and start a new bear market.
As of Friday, July 9 we’ve seen the stock market momentum show signs of a short squeeze, and also that the majority of market participants are in a panic running to buy stocks. In fact, the NYSE volume ratio shows that there are 18 shares being purchased to every 1 being sold on Friday. I consider a ratio over three to be an extreme level, meaning 18 is signaling a potential significant turning point in stocks in the coming week.
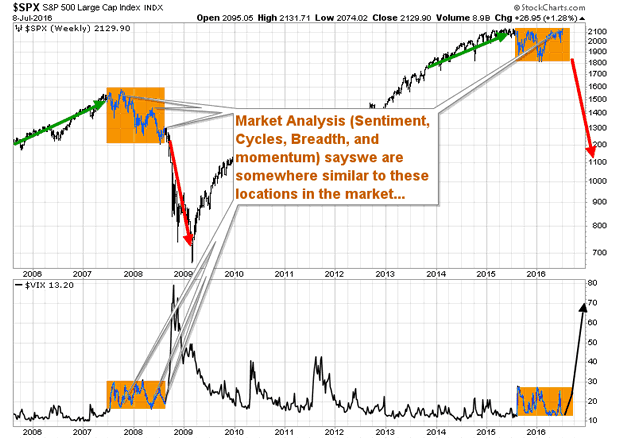
SP500 & VIX Weekly Comparison Chart
If you take a look at the chart below you can see where I feel the stock market is currently trading in terms of its 2007 to 2008 market top. The volatility index is also showing similar patterns to what we saw before the 2008 bear market.
Based on the current price action of the S&P 500 index and the volatility index it appears that a sharp decline in shares is likely to unfold in the coming weeks.
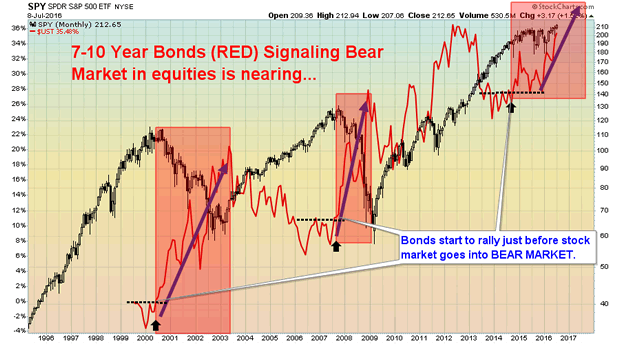
SP500 & Bond Price Comparison – Bonds rally before/lead Bear Markets
Take a look at the chart below. The red line is the price of US bonds. The black candlestick chart is the S&P 500 index which is the US large-cap stocks. As you can see the price of bonds start to rally way before the US stock market rolls over and sells off.
Why does this happen? I believe that the smart money is rotating their money slowly out of equities and into bonds in anticipation of the bear market collapse. Bonds act as a safe haven during times of weakness in both the economy and stock market.
US equities still have a long way to fall before they are technically in a confirmed bear market. The recent rally in bonds is just the beginning for what is to happen.
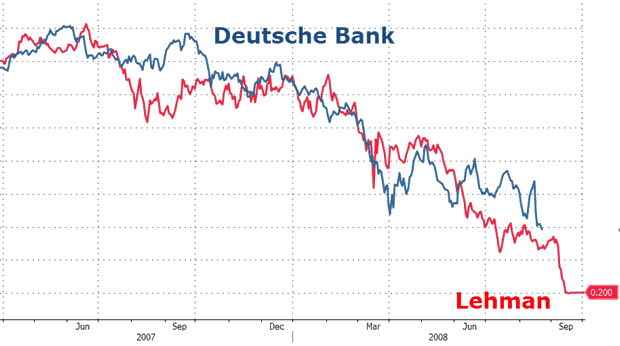
The Trigger/Event/Tipping Point for A Global Equities Crash
In a recent article called “Deutsche Bank to initiate the next financial crisis“, I wrote about how Deutsche Bank is going down the exact same road as Lehman Brothers. In short, both stocks are declining in a similar fashion in terms of share price.
But here is the kicker… If you thought Lehman Brothers was bad you haven’t seen anything yet. The big differences this time around with the banking crisis is that this is 40 times larger than Lehman Brothers and will directly affect almost all key countries and banks around the world. And this time, countries are in far worse shape financially than they were in 2008 during the Lehman Brothers bankruptcy.
My Concluding Thoughts:
In short, the US stock market is trying to hold up and convince investors everything is fine. While stocks are testing all-time highs I know as a technical analyst that the market is much weaker than it appears.
A lot of things are coming together to form a major market top but like all previous stock market tops, they require a lot of time to mature before they breakdown and new nominal highs are normal to see.
Chris at www.TheGoldAndOilGuy.com
related:
Over the longer-term the prospects for both gold and silver are very bright indeed, because of the inexorable global trend towards hyperinflation, driven by the stark reality that there is now no way back for the Keynesian extremists who have created the present shambles. Given the current debt structure, any serious attempt to “apply the brakes” will result in a total implosion and collapse of the system, which will disappear into a neutron star like black hole. They therefore have to keep ballooning the money supply and debt until the system is eventually consumed by a hyperinflation firestorm, which will be a more gradual process than a deflationary implosion, which would by comparison be an instantaneous event. This continued exponential debasement of fiat of course means that real money, gold (and silver), which holds its value, must rise in price exponentially to compensate.
Over the short to medium-term both gold and silver look set back to react back significantly, both for fundamental and technical reasons, and we will concentrate on looking at the latter in this update.
….read and view much more HERE
related:
Chart of the Day – Gold and the Dollar

The refusal to acknowledge the abject failure of the European welfare state economic model by public sector unions, politically connected businesses and the mainstream commentariat is foreboding. In their continuing drive to implement the same failed policies in Canada, they are essentially declaring acceptable entrepreneurship regulated out of existence, vast swathes of the populace unemployed and drawing cheques as well as rapidly spreading banking failures as in Italy, arguably the most dangerous of all…...
Also, don’t miss Solid Quality Yield Recommendations from featured guest Aaron Dunn. Several fine examples of higher yield investments with risks acceptable for conservative investment through to more aggressive portfolios
Below, Winston Churchill Quote:


-
I know Mike is a very solid investor and respect his opinions very much. So if he says pay attention to this or that - I will.
~ Dale G.
-
I've started managing my own investments so view Michael's site as a one-stop shop from which to get information and perspectives.
~ Dave E.
-
Michael offers easy reading, honest, common sense information that anyone can use in a practical manner.
~ der_al.
-
A sane voice in a scrambled investment world.
~ Ed R.
Inside Edge Pro Contributors

Greg Weldon

Josef Schachter

Tyler Bollhorn

Ryan Irvine

Paul Beattie

Martin Straith

Patrick Ceresna

Mark Leibovit

James Thorne

Victor Adair