
Wealth Building Strategies
Recently the Stock Market moves down are fast and deep. This shows a way to make money from falling stock prices, and the process of identifying stock market dogs to protect yourself from a rising market – Ed.
I get a lot of questions about short selling, probably because most investors have never done it.
Short selling is the sale of a stock that is not owned by the seller in anticipation that the stock’s price will decline, enabling it to be bought back at a lower price to make a profit. If you can identify stocks before they fall, you can make a bundle of money via short selling.
To help you understand the mechanics and opportunity of short selling, I want to walk you through my most recent successful short sale to help you decide if short selling is right for you.
On April 7 of this year, I sent out this alert to my Rational Bear subscribers, telling them to “short” Conn’s, Inc. (CONN).
Conn’s is a large furniture and appliance retailer, but what’s unusual about it is the fact that it both sells furniture/appliances and loans its customers the money to buy its furniture/appliances. Sort of like General Motors and General Motors Acceptance Corporation (GMAC).
On the surface, Conn’s appeared to be growing quite well by selling an increasing number of products, but it was doing so by extending credit to just about any deadbeat that walked through its doors.
You and I may not need to borrow money to buy a washing machine or a color TV… but 80% of Conn’s customers do. Those are the kind of people I grew up with, and while they may be decent people, they are not the kind of people I’d want to loan money to.
That strategy started to backfire when the Conn’s finance division reported a massive $43.2 million quarterly loss. At the time, I said, “Those credit losses are going to get worse.”
How did I know that?
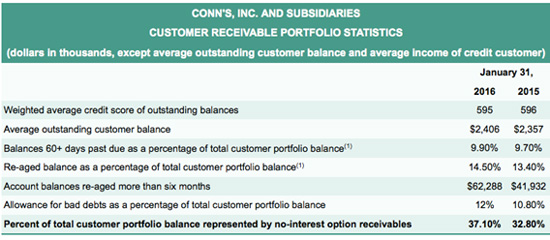
- The number of loans that were more than 60 days past due jumped to 9.9%.
- Most businesses reconsider their lending practices when bad loans skyrocket, but not Conn’s. Instead, it was loaning more than ever; accounts receivable increased by 16% to $743.9 million at the end of the first quarter.
- Conn’s increased its provision for bad debts by 11% to $64.8 million, but that wasn’t enough, considering the pace its customers were defaulting.
Those were serious red flags, but the biggest warning sign was the “creative accounting” Conn’s used to make its business appear better than it really was.
Accounting Trick #1: Re-Aging Bad Debt. There is a little-used but legal accounting practice called “re-aging” debt. It is used to reclassify deadbeat loans into not-deadbeat loans. Basically, when an account is re-aged, it is no longer considered to be past due.
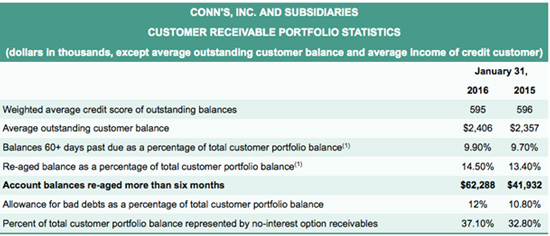
In the first quarter of 2016, Conn’s “re-aged” $21 million worth of loans—from $41.93 million to $62.29 million.
Accounting Trick #2: No-Interest Option Receivables. A typical loan payment is part principal and part interest, just like a home mortgage. However, when a struggling customer can’t afford to make the full payment, a loan company may let the customer get by just paying the interest on the loan.
But when a customer is really in trouble, a loan company could temporarily waive both principal and interest payments. In short… pay nothing!
Why would a loan company do this? Because it keeps the loan from being reclassified as a bad debt, which makes the loan portfolio look better than it really is.
In the first quarter of 2016, the percentage of Conn’s loans converted to no-interest loans rose from 32.8% to 37.1%.
Okay, here is what really counts: Nearly 80% of Conn’s sales are financed through its own in-house credit business.
My expectation was for one of two things to happen… and both of them were very bad:
Bad (but Fast) Outcome #1: Conn’s would tighten up its credit practices and extend much less credit. In that case, the 80% of its customers that couldn’t pay cash simply wouldn’t buy. Revenues would collapse, and Conn’s would report massive losses.
Bad (but Slow) Outcome #2: Conn’s would continue to make loans to anybody that could fog a mirror, and its credit losses from bad loans would skyrocket. Revenues would continue to show modest growth, but Conn’s would report massive losses from massive defaults.
Conn’s sort of let the cat out of the bag when it told Wall Street to tone down its full-year expectations. The company now expects revenues to grow by mid- to high single digits, well below Wall Street’s insane expectations for 13% sales growth, but I thought even that was too high.
Conn’s closed at $10.48 the day I sent out my trading alert, but its stock dropped like a rock on June 2, 2016, when it reported a much-bigger-than-expected loss of $0.31 per share—which shocked the Wall Street crowd that was expecting only a $0.06 profit!
The problem (no surprise) was that the number of deadbeat loans had increased and generated a $21 million operating loss, which pushed the bad-debt ratio from 14.25% to 15.25%.

That’s a huge number of deadbeat loans, which is why CEO Norm Miller said that Conn’s would have to make a commitment to “increased investment in credit risk management.”
Conn’s expects the rest of the year to get even worse. It lowered its mid-to-single-digit revenue growth forecast to low to mid-single digits.
And just for good measure, Conn’s fired its CFO and brought in a fresh face to tackle its financial woes.
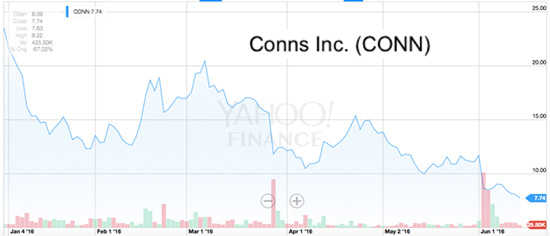
Conn’s shares plummeted on that news, and we closed out the Conn’s short sale with a 21% profit, which is pretty darn good considering that the stock market had done nothing but pretty much go straight up during this time (April 7 to June 2).
That’s a fat gain, but short selling can be even more lucrative when the next bear market comes around.
My goal of showing you the anatomy of the Conn’s short sale is not to pat myself on the back, but to show you the process of identifying stock market dogs and a way to make money from falling stock prices.
Short selling isn’t a complicated, esoteric practice reserved for hedge funds and institutional investors. It’s not only a valuable diversification tool that helps you make money, but a defensive bear market insurance policy. Give Rational Bear a risk-free 3-month try and see for yourself.
Tony Sagami
related: Short Selling: A Trader’s Guide

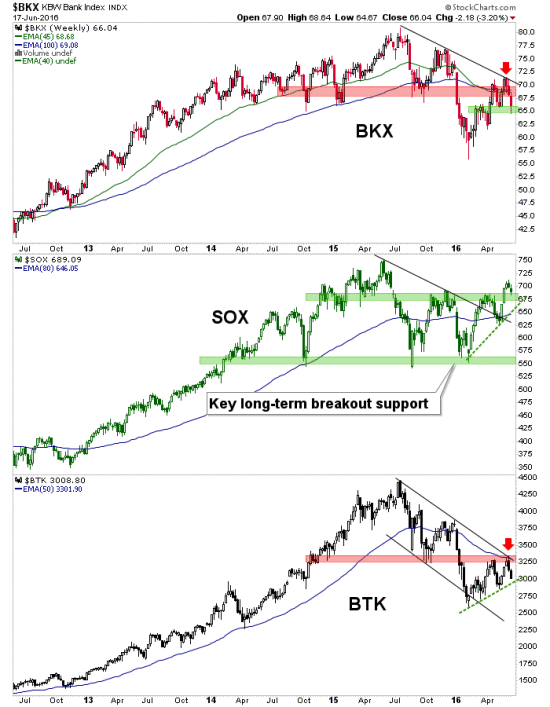
I felt squeamish in noting the Semi Equipment strength and its economic implications to you back in January of 2013 and in hindsight, these are the financial markets and there is no place for squeamish.
Booking, Billings and Book-to-Bill for May are a knock out. What’s more, we now have a 3 month trend in Semiconductor equipment bookings. With the strong billings as well, we probably have the makings of a good reporting season for Q2 (April-June) unless the world ends this month.
….for larger charts continue reading HERE
related: Early Warning On Trend Change

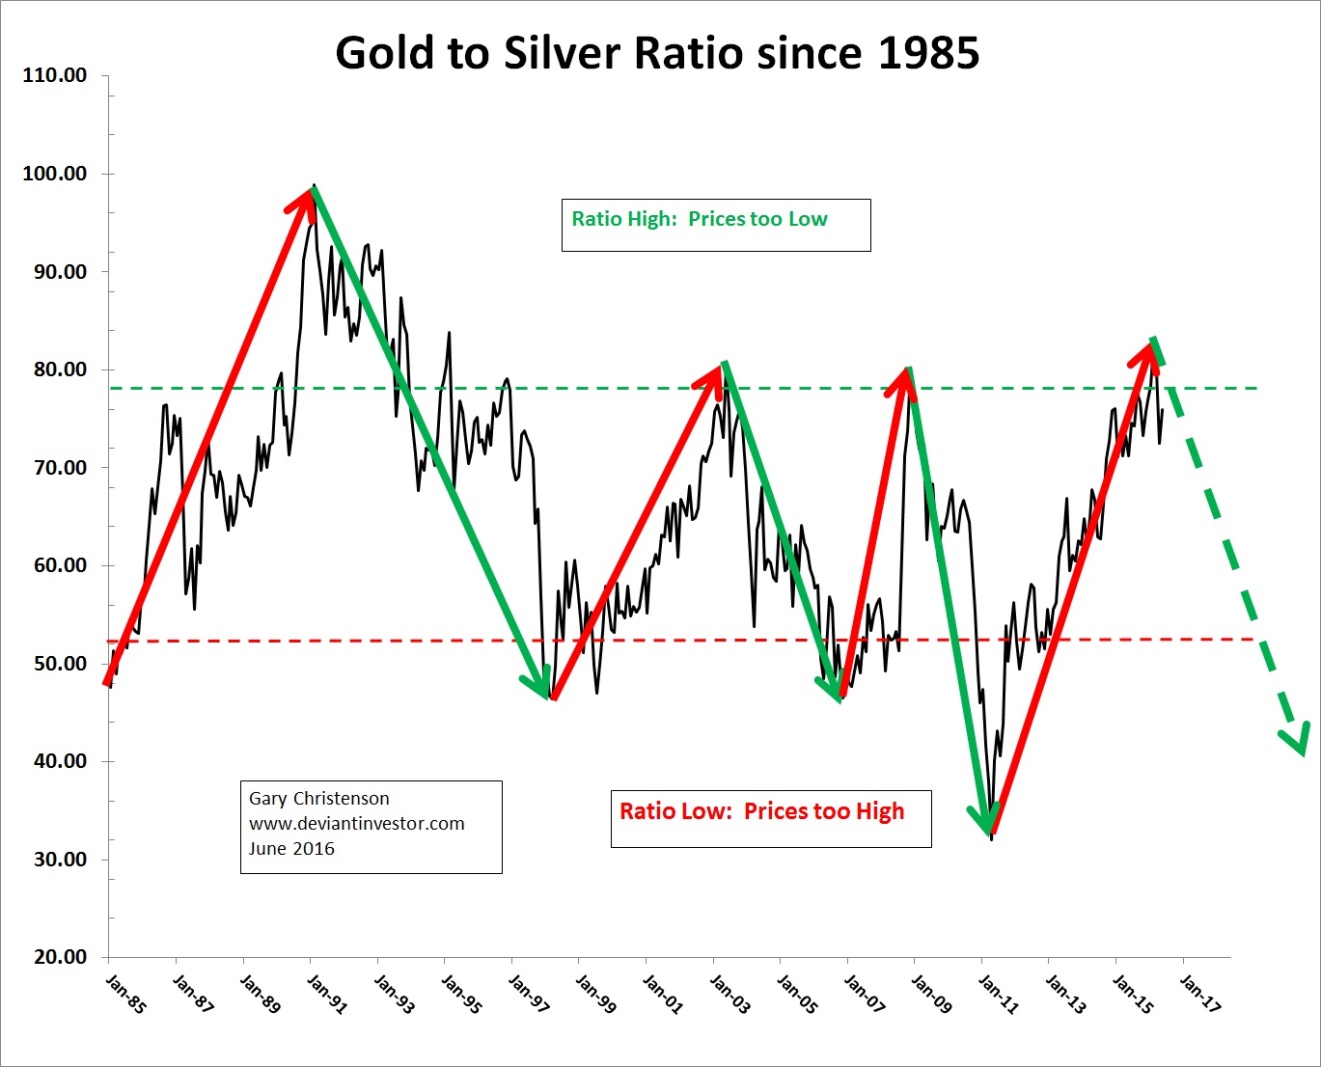
Examine the 30+ year graph of the gold to silver ratio – this is the Big Picture perspective.
The ratio moves from low to high and back to low in long term patterns. I have shown the large scale moves with red (up) and green (down) arrows.
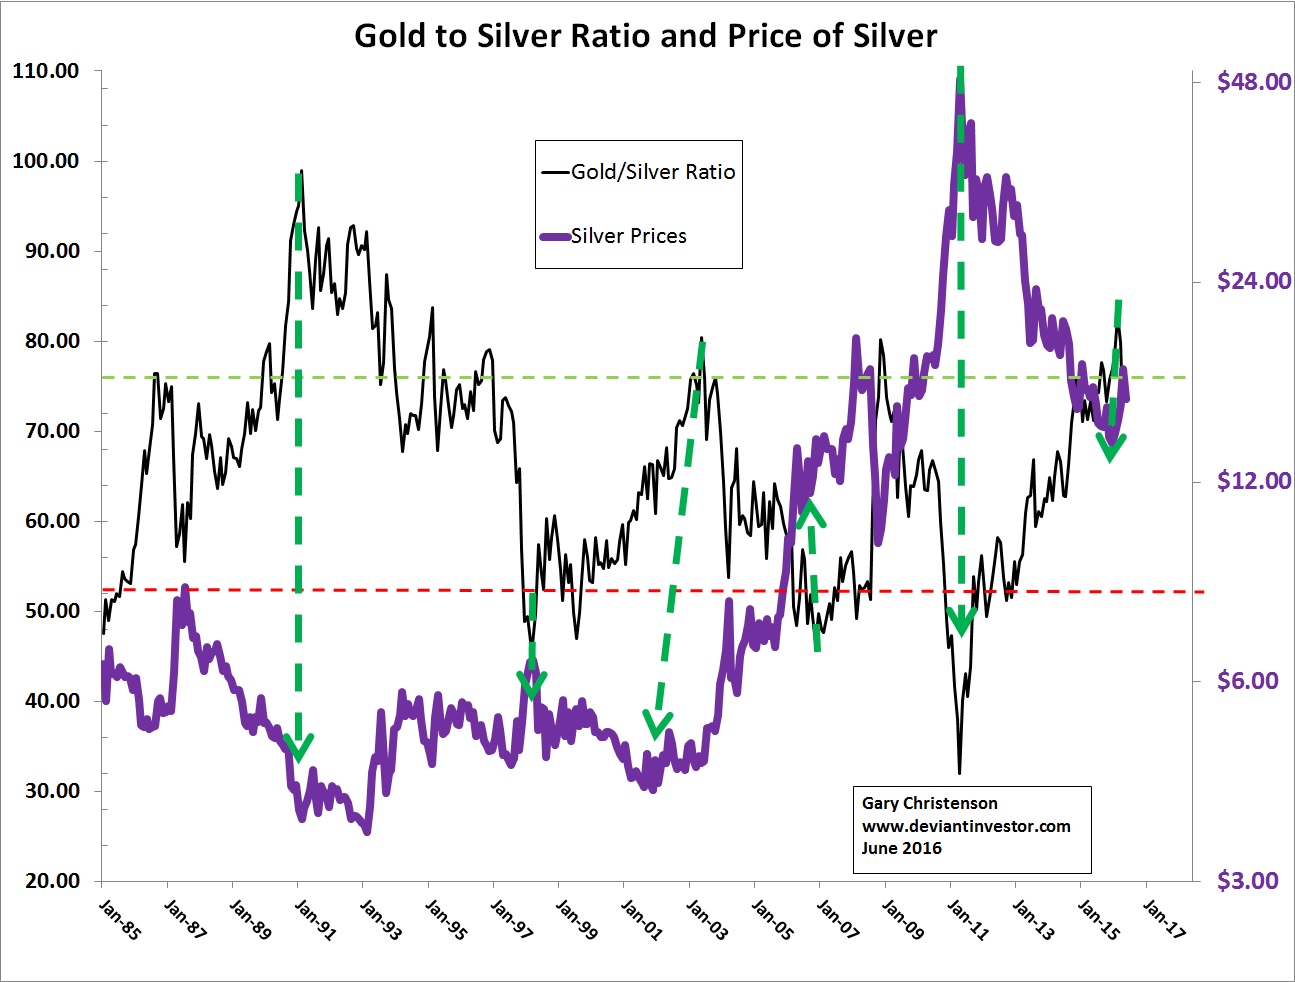
How does the Gold to Silver ratio indicate future prices? Examine the chart (below) of the ratio and silver. You can see a negative correlation between the ratio and the price of silver (gold also but not shown). When gold and silver prices are high, such as in 2011, silver has moved up a much larger percentage than gold, so the ratio drops into the 30 to 50 range. When prices are low, such as in December of 2015, silver has fallen far more than gold so the ratio is high – near or above 80.
Since 2001 there have been three major highs in the ratio, which corresponded with LOWS in gold and silver prices. I have placed green ovals around the ratios when they exceeded 75 on the monthly data chart.
Date Ratio Gold Price Silver Price
5/30/03 80.4 $364 $4.54
11/28/08 80.1 $816 $10.19
2/28/16 82.9 $1234 $14.89
Actual daily lows occurred in December 2015 at about gold $1,050 and silver $13.65 (ratio about 77).
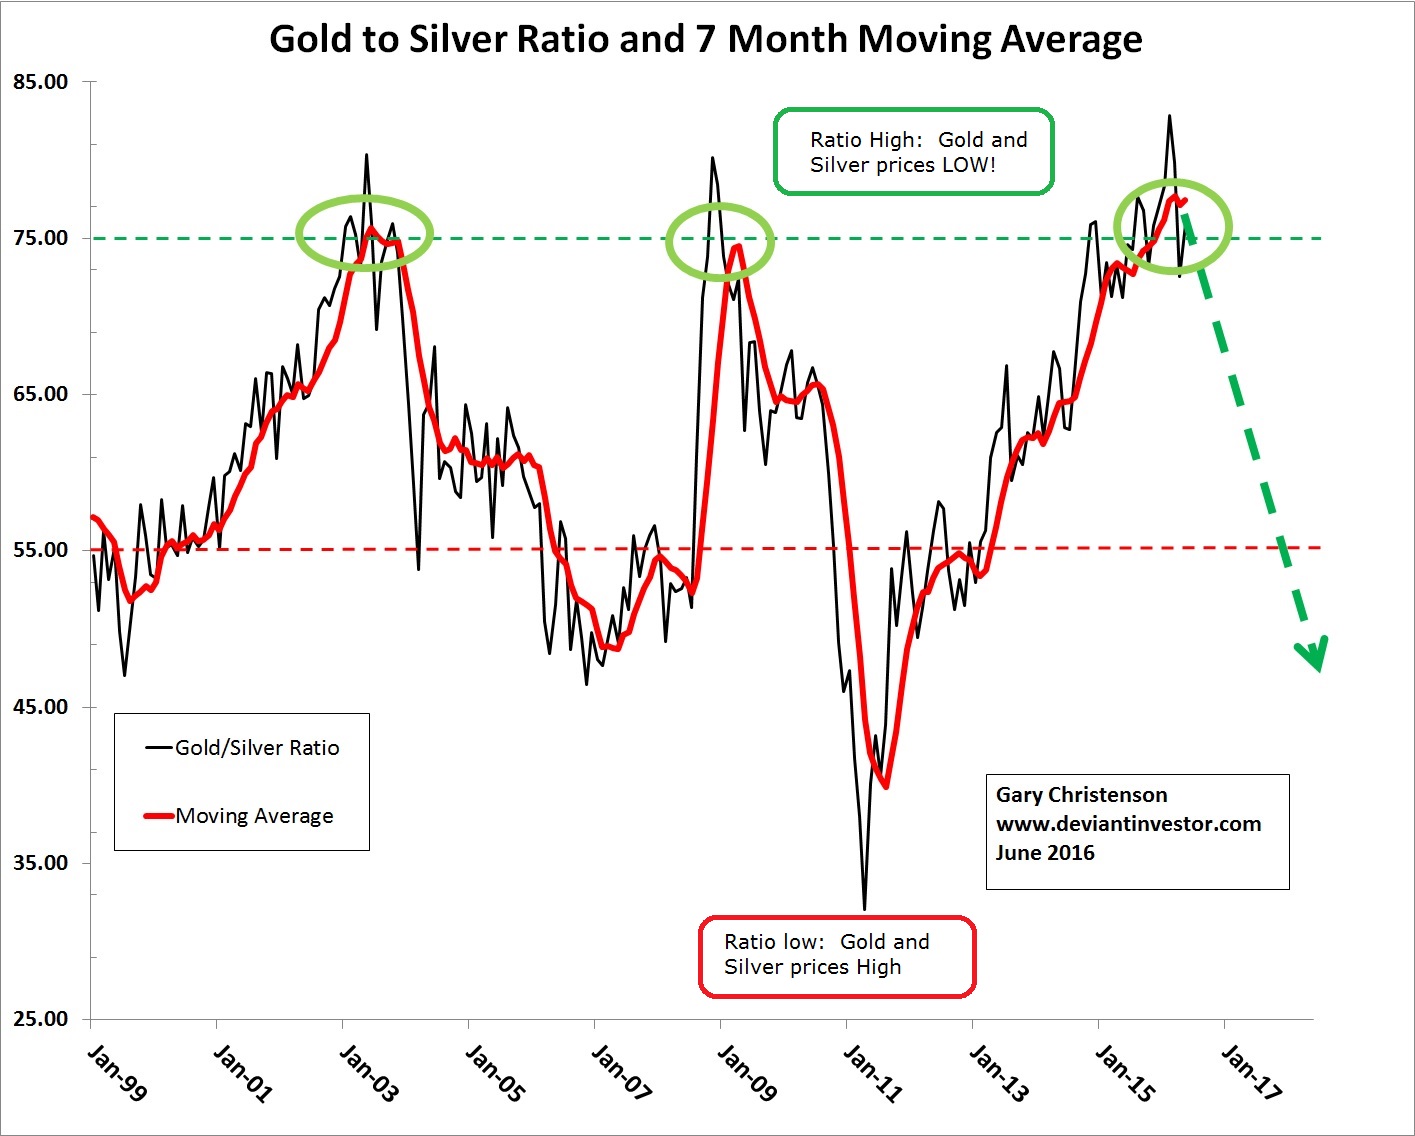
When the ratio exceeds 75 and subsequently crosses below the moving average, a long term buy looks safe and profitable. This is not helpful for short term traders. But if you are a stacker, then buy gold and silver when the ratio has reached an extreme, such as 75 or greater, and is declining.
Note that the ratio as of May 31, 2016 was 75.9 and declining from a high of 82.9 reached in February 2016, using monthly data. Per the gold to silver ratio and 30 years of history, 2016 has been a good time to buy gold and silver. The daily prices for gold and silver bottomed in December 2015 and should rally for several, probably many, years.
But Could Gold and Silver Fall Further?
- The Federal Reserve and other central banks could admit failure and “close up shop.” Okay, just kidding.
- Governments of the world might choose to balance their budgets, pay down debt, and act in a peaceful and responsible manner, both politically and fiscally. Okay, just kidding.
- Central banks could admit they are powerless to stop a deflationary implosion, agree to return to a gold standard, and watch $ Trillions of debt default, which might temporarily reduce gold and silver prices. Okay, a snowball’s chance in Death Valley in August …
There are few guarantees in life beyond death and taxes, but continued currency devaluations, increasing debt, and higher gold and silver prices seem inevitable. Act accordingly.
Bill Gross has mentioned a “supernova” explosion in the debt markets. If $10 – $40 Trillion in debt collapsed down to near its intrinsic value, the shock, panic, and fear could push gold and silver prices into the stratosphere. Act accordingly.
If the Fort Knox gold is gone … as I speculate in my novel “Fort Knox Down!” the prices for gold and silver could also rise spectacularly. Book is available at Amazon and gold and silver are available, for now, from the usual retailers.
Gary Christenson
The Deviant Investor
related:

Ability is of little account without opportunity – Napoleon Bonaparte.
We live in a world where the main driving force behind this illusory economic recovery is hot money and data manipulation. According to Government stats, inflation is nonexistent, but anyone with a grain of grey matter understands that this is not the real case. Rents, education and medical costs are soaring, and salaries are dropping when inflation is factored in. In simple words, you are working more and more for less and less. This is not the American dream; in fact, it sounds more like the American nightmare. The purchasing power of the dollar has been eroded dramatically over the years. According to the website usinflationcalculator.com, an item that set you back $20.00 in 1913 would cost you over $485 in 2016, for a cumulative rate of inflation of 2320%.

Source www.usinflationcalculator.com (click on image to go to the calculator to change the date and $ amount)
The main driver of chaos and instability is hot money; cut this supply and the economic recovery comes to an end. Central bankers are aware of this, and that is why they are embracing negative rates as it’s the only way to maintain this illusion. How long will they be able to pull this act off? They have been extremely adept at conning the crowd and even though many are awakening, the large majority is still deep in slumber.
A logical person looking at all the data would say the end is nigh, but this is the same line of thought that has governed these logical individuals for decades, and yet the illusion continues. Our Central bankers have not embraced negative rates yet (but they will), so from a relative stance, our bond market is offering yields that appear incredible when compared to Europe and Japan. Thus, this illusion of economic prosperity could last a lot longer than most experts are willing to admit. In fact, it is even conceivable that the US dollar could remain strong relative to other currencies even after we embrace negative rates because we will be joining the party late. And our rates even though negative will be relatively higher than those nations that have already jumped on the negative rate bandwagon.
Gold and Silver bullion should be viewed as a form of insurance against a future financial disaster, and it goes without saying that we will experience another disaster sooner or later. We are not advocating that you back the truck and load up on bullion. We are talking about a balanced portfolio and in a balanced portfolio it makes sense to allocate some funds to Gold and Silver bullion. Think of this insurance against another financial crisis; that has the potential to be larger than the 2008 financial crisis. You purchase Insurance not because you know something bad is going to happen, but if something bad happens you know you are covered.
Suggested strategy and Price targets for Gold
 Investors that have money that is idling around and Patience can use strong pullbacks to add to their existing positions. We tend to favour Silver more than Gold as the gains on a percentage basis will be far larger on Silver than Gold.
Once Gold closes above $2200 on a monthly basis, it will set the path for a test of the $3300-$3500 ranges. If there is a feeding frenzy stage and there usually is, then our high-end target for gold is $5,000. Those issuing targets of $20,000 and higher are getting ahead of themselves and in doing so, they are leading novice investors astray.
As life is action and passion, it is required of a man that he should share the passion and action of his time, at the peril of being not to have lived. Oliver Wendell Holmes

June 21, 2016
- Gold is the ultimate safe haven, and when global financial risks rise or fall substantially, enormous institutional liquidity can flow into gold, or out of it.
- Please click here now. Double-click to enlarge. That’s the hourly bars gold chart. In just a few weeks, gold surged from about $1200 to $1320, on Brexit fears.
- All of that upside gain can easily be unwound if the “stay” vote wins. The “unwind” would only be a short term event, partly because more key EU member states may soon launch their own referendums.
- Most retail investors tend to invest excessive amounts of capital in their trade ideas. That leads to dramatic swings in fear and greed that few investors are capable of withstanding.
- With gold, a drop from $1300 to $1200 and a subsequent rally to $1400 should not be something that creates significant fear or greed for any investor in the Western gold community.
- Heightened volatility is to be expected around events like the Brexit, especially as the US business cycle peaks and turns down.
- Please click here now. George Soros correctly argues that there could be substantial financial pain with a “Leave” victory in the Brexit vote. He fails to mention the word “freedom”.
- National elections and referendums are no longer about citizen freedom. They are only about economics. If a slave gets a bit more money, the slave is supposed to rejoice. Unfortunately, that doesn’t free the slave.
- Please click here now. In my professional opinion, India has the most corrupt government of all major industrializing nations.
- To enrich themselves, Indian politicians make extensive use of bribery, theft, and extortion. In contrast, I view India’s central bank chief, Raghuram Rajan, as… the Elliot Ness of India.
- His unbreakable integrity has been a major thorn in the side of the government. Influential Barron’s writers appear to believe his sudden official resignation over the weekend was a “hatchet job”.
- Consistently, Indian citizens are the world’s largest gold buyer class, and they also own the largest amount of gold. That’s because they understand better than everyone else that government power corrupts, and absolute power corrupts absolutely. It’s that simple.
- Will Western citizens ever learn to vote for gold before voting for their favourite government politician? Unfortunately, I think it will take another thousand years of dealing with corruption in government, before most Western citizens begin voting to make gold bullion their personal Prime Minister and President.
- In the big picture, the loss of Rajan in India is probably very positive for the price of gold. With a “yes man” installed as the head of the central bank, India will quickly join the rest of the world’s central banks in chopping rates and printing money. That will inspire Indian citizens to buy gold very aggressively.
- Please click here now. Double-click to enlarge this weekly bars chart of the Dow. I’ve highlighted the end of the year timeframe for 2013, 2014, and 2015.
- Investors who sold gold stocks aggressively at those times to get in on the upside action that had earlier occurred in the Dow are already disappointed. The Dow has essentially gone nowhere for three years. Value players have left the stock market building as the business cycle wanes, and they are not coming back. The Dow is probably running on fumes.
- Please click here now. Double-click to enlarge this fabulous GDX weekly chart. I adamantly told the entire Western gold community during “tax loss season” of each the past three years that gold stocks were making generational lows, and those tax-loss seasons (December) were critical buying areas.
- Without even mentioning the fantastic price action from the 2015 low, the simple fact is that GDX is up solidly, from both the 2014 and 2013 lows!
- Investors who use technical trading systems, COT reports, and other market timing theories to place large bets for or against gold will almost never beat the diligent value-oriented investor, and if they do, their victory will be very short-lived. The bottom line:
- While the Dow has essentially gone nowhere, GDX is up about 20% from its 2013 low, 35% from its 2014 low, and 100% from its 2015 low!
- Investors who want to build serious wealth that is retained must approach the market with intestinal fortitude and the search for value as their main weapons. Gold stocks offered stupendous value in 2013, 2014, 2015, and now in 2016, but the key question is, how many investors had the amount of intestinal fortitude required to take buy-side action?
- Please click here now . Double-click to enlarge this important quarterly bars chart of the XAU gold stocks index versus gold. It’s arguably the most important chart in the world, or certainly one of them.
- The twenty-year bear market in gold stocks against gold was caused by a “perfect deflationary storm”. That storm itself was caused by a bear market in money velocity and bank loan profit margins. The storm is ending. Inflation is beginning to creep higher, and doing so at a time when the US business cycle is peaking.
- Aggressive rate hikes (and arguably even one more) will crush the US stock market and incentivize commercial banks to pull money out of government bonds at the Fed. Rate cuts now won’t help the economy, so the next step is likely some kind of government infrastructure spending programs. That’s inflationary, and it’s going to fuel more institutional buying of gold stocks. Gold stocks are beginning what will probably become the biggest upside price movement in the history of financial markets!
Thanks!
Cheers
st
Jun 21, 2016
Stewart Thomson
Graceland Updates
website: www.gracelandupdates.com
related:


-
I know Mike is a very solid investor and respect his opinions very much. So if he says pay attention to this or that - I will.
~ Dale G.
-
I've started managing my own investments so view Michael's site as a one-stop shop from which to get information and perspectives.
~ Dave E.
-
Michael offers easy reading, honest, common sense information that anyone can use in a practical manner.
~ der_al.
-
A sane voice in a scrambled investment world.
~ Ed R.
Inside Edge Pro Contributors

Greg Weldon

Josef Schachter

Tyler Bollhorn

Ryan Irvine

Paul Beattie

Martin Straith

Patrick Ceresna

Mark Leibovit

James Thorne

Victor Adair