
Economic Outlook
We all know the debt load in the US economy is horrendous and unsustainable. The US government runs deficits of approximately $1 Trillion per year, even with interest rates at historical lows. Current official national debt exceeds $19 trillion, of which $13.9 trillion is public debt. Unfunded liabilities are much larger. Even a 7% average interest rate would require nearly $1 trillion per year for interest only debt service, thereby increasing national debt even more rapidly.
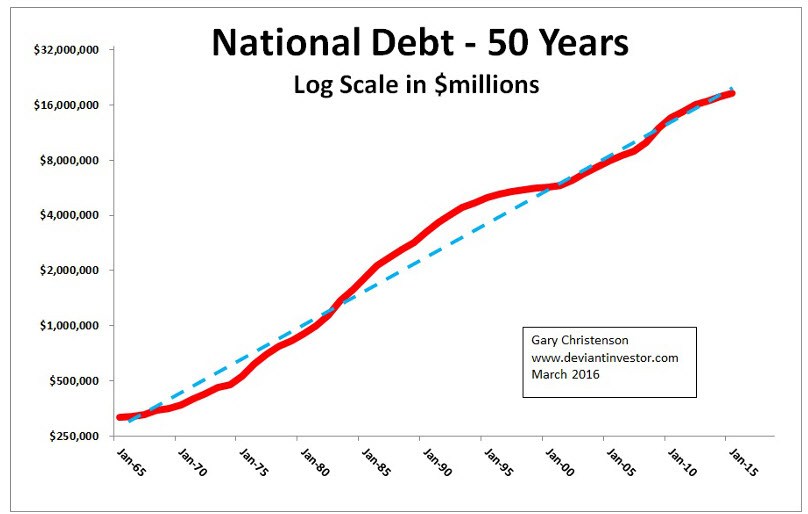
National debt has increased exponentially for the past 50 years. Expect the exponential increase to continue and accelerate, even with historically low interest rates.
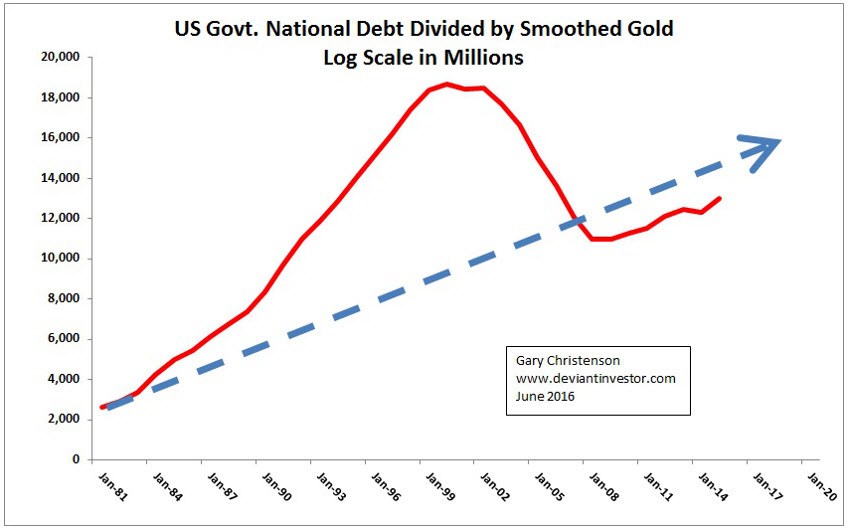
What if we priced national debt in “real money” – actual gold instead of the digital and paper stuff that can be created at the whim of a central banker?
I used the annual average of gold prices and heavily smoothed them with a 7 year moving average. Then I divided the national debt by the heavily smoothed gold prices.
The 35 year graph shows that, on average, national debt has increased rapidly, even when priced in gold. This should be cause for alarm – debt is increasing far too rapidly, and gold is underpriced.
The current national debt is equal to about 100 times the total value, at current gold prices, of the gold “officially” stored in Fort Knox. This should be cause for alarm.
What about transfer payments per the St. Louis Fed (FRED)? According to FRED the total transfers for social benefits in 2015 was about $1.959 trillion – or 10 times the value of the gold officially stored in Fort Knox. A 35 year graph is shown below. Of course transfer payments have steadily increased from $251 billion in 1981 to $1,959 billion in 2015, but even priced in gold the transfer payments have increased.

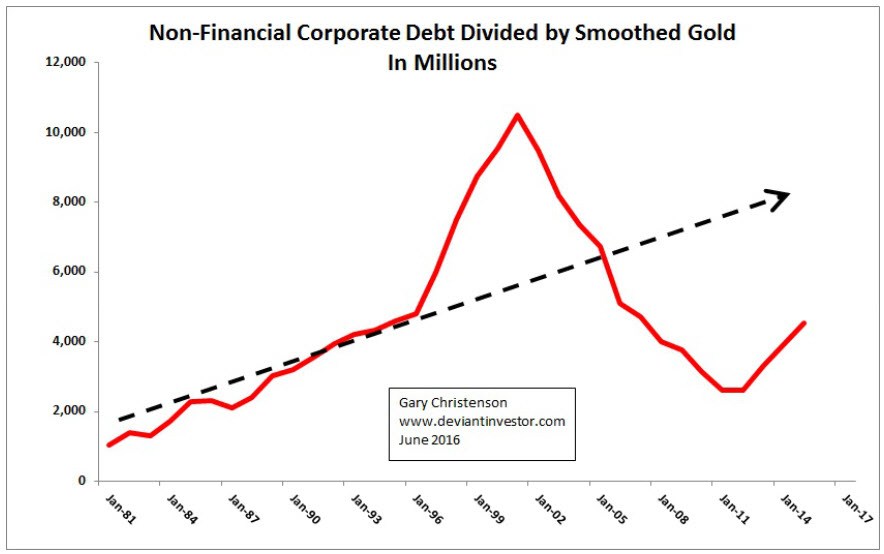
What about non-financial corporate debt? According to FRED that debt was $474 billion in 1981 and about $5.4 trillion in 2015. If the US economy falls into a recession what percentage of that debt will default? All of that debt is someone else’s asset, and if that debt defaults, those assets disappear. Cause for alarm…
What about wages as calculated by Social Security? The official average national wage in 1981 was $13,773 and in 2014 it was $46,481. I divided that official average wage by the heavily smoothed price of gold and produced this chart. National debt, corporate debt, and transfer payments are increasing more rapidly than average wages. Cause for alarm….

CONCLUSIONS
- Official national debt is massive and accelerating higher even though rates of interest paid to service that debt are historically low. The Fed will have difficulty raising rates.
- Non-Financial Corporate debt currently exceeds $5 trillion, thanks to low interest rates, QE, and stock buy-backs funded via debt. The next recession will be problematic for debt repayment to those who believe those debts are assets.
- Wages are increasing slowly compared to debt. Sustaining a standard of living via debt (individuals and governments) only works for a limited time. “Those trends are coming to an end…”
- The official horde of gold supposedly stored in Fort Knox is 147.3 million ounces, worth at current prices less than $200 billion, a tiny fraction of official national debt – debt which can’t be paid will be defaulted, either via inflation or repudiation. The price of gold will rise substantially as global currency values fall.
- Defaulting debt will be destructive to the value of the dollar as well as all other paper and digital currencies. Gold has no counter-party risk and will benefit accordingly.
From Bill Gross:
“For over 40 years, asset returns and alpha generation from penthouse investment managers have been materially aided by declines in interest rates, trade globalization, and an enormous expansion of credit – that is debt. Those trends are coming to an end…”
From Charles Hugh Smith:
“Leaders face a no-win dilemma: any change of course will crash the system, but maintaining the current course will also crash the system.”
Repeat: “Those trends are coming to an end…”
Gold and silver come to mind…
Gary Christenson
The Deviant Investor

 Oil prices jumped to their highest level in eight months on Wednesday, rising for a third consecutive session on supply disruptions in Nigeria and strong Chinese demand data.
There was also a larger-than-expected drop in U.S. crude inventories on Tuesday, indicating an easing of the global supply glut. A weak dollar, which hit a five-week trough against a basket of currencies on Wednesday, also boosted prices.
Related: Martin Armstrong: Oil at a Critical Juncture – Martin notes that if Oil breaks above the $49 level look for a rally to the $69-$70 area.”
 Stop me if you’ve heard this one before: A Fed official walks into a bar and says the economy is improving and rate hikes are appropriate. The patrons order another round to celebrate. Then disappointing data comes out, the high fives stop, and the Fed official ducks out the back…only to come back the next day saying the same thing. Anyone who pays even the smallest attention to the financial media has experienced versions of this joke dozens of times. Yet every time the gag gets underway, we raise our glasses and expect the punch line to be different. But it never is. Last week was just the latest re-telling.
For nearly a month the Fed’s bullish statements stoked optimism on the economy and raised expectations, based particularly on the most recent FOMC minutes, for a summer rate hike. But these hopes were dashed by the May non-farm payroll report, which reported the creation of only 38,000 jobs in May, the worst monthly performance in six years, based on data from the Bureau of Labor Statistics (BLS). The number missed Wall Street’s estimate by a staggering 120,000 jobs. If not for the 37,000 downward revision reported for April (160,000 jobs down to 123,000), May could have shown a contraction. This would have constituted a major black eye to the Obama Administration’s favorite talking point that its policies have led to 75 months of continuous job gains. (6/3/16, Democratic Policy & Communications Center).
To make the report even stranger, the plunge in hiring was accompanied by a drop in the unemployment rate to just 4.7%. Of course the fall in the unemployment rate was a function of another major drop in the labor force participation rate to just 62.6%, matching the June 2015 rate, which was the lowest level since the late 1970s (BLS). So the unemployment rate did not fall because the unemployed found jobs, but because they stopped looking. The market reaction was swift and sharp, as it always has been when a fresh shot of cold water has been thrown in the face of market boosters. The dollar fell hard and gold rose sharply.
But we can rest assured that despite any embarrassment that the Fed may be experiencing for having so gloriously misdiagnosed the current economic health, it will be right back at it in a few days, telling us about all the positive economic signs that are emerging and how it is ready and willing to start raising interest rates at the earliest opportune moment. Boston Fed president Eric Rosengren waited exactly 48 hours to start that campaign as he sounded bullish notes in a Monday speech in Finland. (6/6/16, Greg Robb, MarketWatch)
Given how many times this scenario has unfolded, leading to the point where even reliable Fed apologists like CNBC’s Steve Liesman have begun questioning the Fed’s credibility, one wonders what the Fed hopes to achieve by continuously walking into the bar with a new smile. But this performance is the only policy tool it has left. The Fed appears to believe that perception makes reality, so it will never stop trying to create the rosiest perception possible. It may view its own credibility as expendable.
There is also the possibility, however unlikely, that the Fed officials are not just trying to create growth through open-mouth operations, but that they actually believe that their policies are working, or are about to work. This would be as dogged a commitment to policy as medieval doctors had for bloodletting, which they thought was a useful therapy for a variety of ailments. Doctors at that time had all kinds of seemingly plausible reasons why the technique was effective. If the patient did improve after draining blood, it was taken as a sign of validation. But they would continue to apply the leeches even if the patient did not improve. Failure was simply a sign that that more blood needed to be drained. Similarly, central bankers consider ultra-low, and even negative, interest rates as an ambiguous stimulant that will create growth when applied in large enough doses.
But what if modern central bankers, much like medieval doctors, are operating on a wrong set of assumptions? We know now that draining blood creates conditions that actually decrease a patient’s ability to fight infection and recover. Perhaps, one day, bankers will come to a similarly delayed conclusion about how zero and negative interest rates have prevented a real recovery that would otherwise have naturally taken place.
That’s because artificially low interest rates send false signals to the economy, prevent savings and investment, and encourage reckless borrowing and needless spending. They prevent the type of business and capital investment that is needed to create real and lasting economic growth. But don’t expect bankers, or their cheerleaders on Wall Street, the financial media, government, or academia, to ever make this admission. They do not believe in the power of free markets. They believe in government. Such a leap is simply beyond their powers of comprehension.
But there is another cycle here that is much more influential on the current market dynamic and should be much easier to spot. When the Fed talks up the economy and promises rate increases, the dollar usually rallies. When the dollar rallies, U.S. multi-national corporate profits take a hit, and the market falls. When the market falls, economic confidence falls and puts pressure on the Fed to maintain easy policy. This is a loop that the Fed does not have the stomach to break.
Because the Fed waited more than seven years to lift rates from zero, the cyclical “recovery” is already nearing its historical limit, if it’s not already over. This could put the Fed into a position of raising rates into a weakening economy. Normally it does so when the economy is accelerating. Some identify this delay as the Fed’s only policy error. But had it moved earlier, the recession would have simply arrived that much sooner. The Fed’s actual policy error was thinking it could build a “recovery” on the twin supports of zero percent interest rates and QE, and then remove those props without toppling the “recovery.”
But despite all this, there are those who still believe that the Fed will deliver two more rate hikes this year. Given the anemic growth over the past two quarters, the recent plunges in both the manufacturing and service sectors, average monthly non-farm payroll gains of only 116,000 over the past three months (most low-wage, and part-time) and the stakes contained in the election that is just six months away, such a conclusion is hard to reach. Instead, I expect we will get the same bar gag we have been getting for the past year. Many of those who now concede that a June hike is off the table still believe July to be a possibility. I believe the Fed will go along with that hype until it can no longer get away with it…then it will start bluffing about September, or perhaps December.
The Fed has to keep talking about rate hikes so it can pretend that its policies actually worked. But the truth is that the Fed policies have not only failed, they have made the problems they were trying to solve worse, and raising interest rates will prove it. So the Fed resorts to talking about rate hikes, to maintain the pretense that its policies worked, without actually raising them and proving the reverse. This can only continue as long as the markets let the Fed get away with it or until the numbers get so bad that the Fed has to admit that we have returned to recession. That is the point where the Fed’s real problems begin.
Peter’s podcasts are available on The Peter Schiff Channel on Youtube.

The USDCAD looks just about ready to head back up which will be the next leg of the bear rally that commenced in early May 2016. Let’s check out the action using the weekly and daily charts.
USDCAD Weekly Chart

The horizontal line denotes the previous swing low set in October 2015 and we can see the recent low at 1.2461 breached that level thereby creating a lower low. I now believe price is tracing out a significant bear rally that still has plenty of time and price still to play out.
The Bollinger Bands show price has encountered some resistance around the middle band and has been sliding down with it over the past few weeks. I believe decision time is upon us and price will make a decision any day now to leave this middle band and head up to the upper band and beyond.
The PSAR indicator is bullish with the dots at 1.2723. This is my tight setting and these dots that represent support often act like a magnet for price and I expect the higher low to be right around the 1.2723 level. Considering it is my tight setting, it is quite possible price to stage a fake out move whereby price busts the dots before turning back up. It is really neither here nor there and today’s low of 1.2732 has so far held this support.
I have drawn a Fibonacci Fan from the January 2016 high to recent low. It shows price finding resistance at the 38.2% angle and trading back down in tandem with this angle with the angle now looking more like it is providing support. I expect price to lift off this angle at any time now and surge higher.
I have added Fibonacci retracement levels of the move down and I am targeting the final bear rally high to be at least up around the 61.8% level at 1.3839. The 76.4% level at 1.4165 is also worth considering.
The RSI showed a bullish divergence at the recent low and it looks to be building strength with a pattern of higher highs and higher lows.
The MACD indicator is bullish although the averages have come back together again and that is often the exact moment when a trend resumes.
Let’s now look in a bit closer with the daily chart.
USDCAD Daily Chart

The Bollinger Bands show price now pushing into the lower band and this should act like a rubber band once price decides to bounce back up, assuming it does of course.
I have drawn a Fibonacci Fan from the low to recent high and this shows price right around support from the 76.4% angle. It is this angle where I expect the pullback low to form.
I have added Fibonacci retracement levels of the recent move up and I am looking for a low to form around support from the 61.8% level at 1.2739. Today’s low of 1.2732 has marginally clipped that level so I would suggest it is alert stations for the bulls!
I have added moving averages with time periods of 100 (red) and 200 (black) and these have recently made a bearish crossover which adds support that this current move is a bear rally only.
The RSI is back in oversold territory while the MACD indicator is bearish although that is coming off a nice move up.
So, we just await a low followed by an impulsive reversal back up and I believe that will occur at any time now. One to watch!
related: The Easy Way to Prosper From the Coming Paper-Money Crisis
“no way are the metals or miners going straight up from here. No way are they on a rocket rise that will never look back. And no way should you jump on board with both feet. You’ll surely lose it all”
Gold’s bounced a bit, and now, everyone wants my head. They figure — again — that gold is ready to blast off to $1,300 … then $1,350 … then $1,500 and even higher, without ever looking back.
They say the background environment for gold — and other precious metals and mining shares — has never been more bullish.
I say, baloney! Yes, gold has bottomed, last December. Yes, gold, the precious metals and miners are in new bull markets that will see much higher prices and could last for years.
But no way are the metals or miners going straight up from here. No way are they on a rocket rise that will never look back. And no way should you jump on board with both feet. You’ll surely lose it all.
For one thing, gold is still extremely overbought. It would be very hard for gold to make much upside progress being so overbought.
For another, according to the most recent Commitments of Traders report (COT), gold and silver still have way too many speculative long positions open versus commercial short positions.
That’s a recipe for a hard fall, not a continued rally.
For yet another, the precious metals are entering the seasonally weak summer months, a period of lackluster physical demand around the globe.
And for yet another, Janet Yellen is still poised — in my opinion — to raise rates in June, rather than July. Even if I’m wrong, so what? Then she will likely raise rates in July.
Then, of course, there’s the U.S. dollar, which is still holding its own, biding its time, but ready to break out to the upside again, and soon.
I also urge you to take another look at the Artificial Intelligence forecast chart of gold that I showed you last week, repeated here.
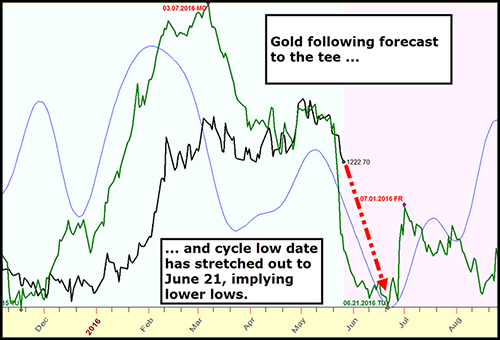
That forecast has not changed!
What about silver, platinum, and palladium?
All pretty much the same. They will follow gold’s lead.
What about the mining sector, which has started to pull back?
I’m as anxious as you are to load up on miners. But they too are extremely overbought and overvalued right now.
In fact, according to a recent report from Morgan Stanley Australia, miners are now extremely overvalued. Example: Newcrest Mining (NCM.Australia) trading at $21.76 Australian Dollars, compared to fair value of $A12.90. That’s 68% overvalued.
Northern Star Resources (NST.Australia) trading at $A4.74 compared to fair value of $A3.45. That’s 38% overvalued.
Morgan Stanley is right. Be patient: The pullback I have forecasted has started, is still on track, and should bottom later this month.
Then it will be time to load up!
Best wishes, as always …
Larry
http://www.moneyandmarkets.com
related: Given the correction Rambus Chartology has an excellent take on Gold Stocks: Be Prepared


-
I know Mike is a very solid investor and respect his opinions very much. So if he says pay attention to this or that - I will.
~ Dale G.
-
I've started managing my own investments so view Michael's site as a one-stop shop from which to get information and perspectives.
~ Dave E.
-
Michael offers easy reading, honest, common sense information that anyone can use in a practical manner.
~ der_al.
-
A sane voice in a scrambled investment world.
~ Ed R.
Inside Edge Pro Contributors

Greg Weldon

Josef Schachter

Tyler Bollhorn

Ryan Irvine

Paul Beattie

Martin Straith

Patrick Ceresna

Mark Leibovit

James Thorne

Victor Adair