
Timing & trends
Environment Canada has said that if the Oil Sands were completely shut down, carbon emissions would be cut by an infinitesimal 12/100th’s of 1 percent! Seems like a timely moment for a proper cost/benefit analysis of climate change action.
Make sure you check Mike’s latest on the Entitlement Craze

This past Friday, June 3rd, 2016, The Bureau of Labor Statistics released their most recent report regarding new employment data and nonfarm payroll employment which indicates that during May of 2016, it was the smallest increase seen in 28 months.
During May of 2016, there were 144,592,000 payroll jobs within the US, which was up by 1.6 percent, or equivalent to 2.3 million jobs, from May of 2015 (These are all not-seasonally-adjusted numbers).
That represents the smallest year-over-year increase that has been reported since February of 2014, at which time payroll jobs increased by 1.57 percent. The largest year-over-year increase, in recent years, was reported during July of 2015, when it was up by 2.18 percent:
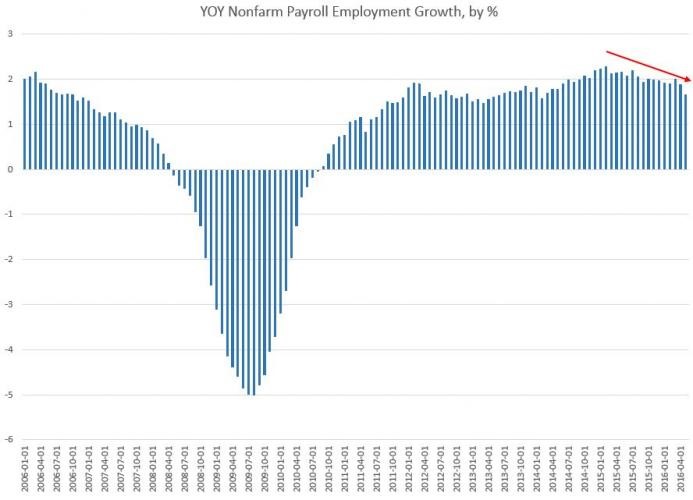
Since July of 2015, the general trend in growth has been down. This 1.6 percent remains well below where growth was during most of the 1990’s.
I am not fond of using the seasonally adjusted numbers, since they add an additional layer of ‘needless manipulation’. I do prefer to compare job growth, from the same time of year, over several years.
When I do this, I find that the job growth from April to May of 2016, was the lowest April-May growth total since 2009:
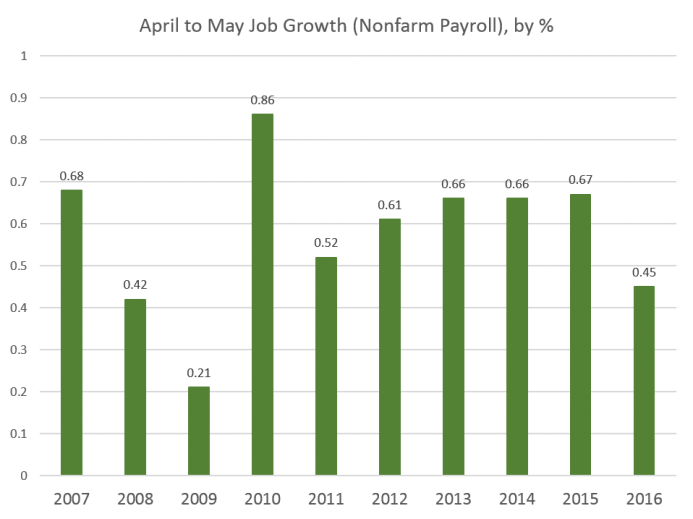
From April to May of 2016, there were 651,000 new jobs added, which is a significant drop from that same period of time, last year when 947,000 jobs had been added. Over the past decade, this current year of 2016, in this measure, beats out only 2008 and 2009, both of which were years of ‘economic decline’. Therefore, May of 2016 was the weakest May on record, for job growth, in eight years.
The Secretary of Labor, Tom Perez attempted to blame everything on the Verizon strike. That is a nice “spin”, however, the strike does not explain the obvious ‘decline’ in the year-over-year numbers! The strike might explain why the May numbers dropped off as much as they did, however, it cannot explain the ‘trend’. It is a bit of a stretch to blame this drop from April-May of 2015 to April-May of 2016 on the Verizon strike.
Mr. Perez, however, attempted some other, even less convincing, claims as well, stating that the U.S.’s insufficient mandates on paid family leave means that fewer women are entering the work force, and therefore pushing down the jobs totals. Is this IMPORTANT? The answer is NO! These bad numbers merely reflect our current poor economic situation, today!
In any case, the overall trend should not be a big surprise, as it has always has been weak. It has been dependent on the FED and their low interest rates. In recent quarters, the FED has finally been backed into a corner and has become hawkish. Realizing that more rate cuts are unlikely to occur any time soon, the economy is not receiving the usual FED-manufactured stimulus which investors and companies have both become accustomed to. With the FED talking about the need to raise ‘rates’, who can be surprised that the “recovery” is nonexistent?
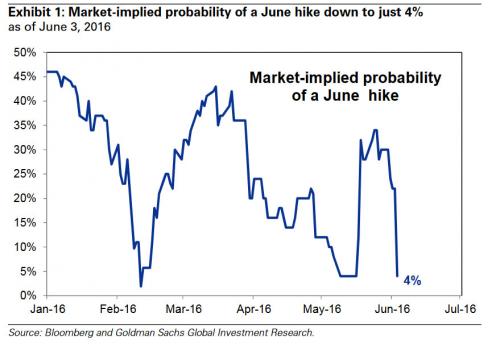
The financial news, of the past few weeks, had its cadre of regional FED Presidents attempting to sway markets into believing that the Central Bank was sure to ‘hike’ interest rates during this current month of June 2016.
The jobs report sent ‘shock waves’ throughout the entire financial system. The report printed a jobs number of just 38,000 new employees, which is the lowest single month since the height of the “Great Recession”.
What is even more ludicrous than this, is the fact that the unemployment rate fell to 4.7 percent seeing as 664,000 workers are no longer being counted and included, by the government, within the labor force.
The FED relies heavily on these ‘manipulated’ government jobs numbers, the idea of “data dependency” being used to determine when to ‘hike’ or ‘drop’ interest rates shows the incompetency of a body that supposedly employs hundreds of economists who are dedicated to discover the true state of the economy and of its’ economic data. This in turn, should provide Americans with the reality that not only does the Central Bank have any idea what they are doing, but, more often than not their policy decisions are based on ‘incorrect’ and ‘outdated’ models which have only served to make matters worse, since the “Credit Crisis of 2008”.
The majority of jobs created were either part-time or low-wage service sector oriented. You can bank on the fact that the FED is now more likely to lower ‘rates’ than they are to raise them, going forward!
Today, it is both unlikely and irrational for the FED to raise interest rates either now or in the near future, despite the Central Banks’ recent “moral suasion” on mass media, of a potential rate ‘hike’ occurring as early as this month or possibly next month. The FED continues to create policies in an attempt to protect the economy and stock markets through November of 2016 so as to “spin” the election in favor of Hillary Clinton. This is due to the uncertainty from the presumptive Republican candidate, Donald Trump, who may force the Central Bank into ending its’ mission to fuel ‘stock and housing bubbles’. I, myself, as well as many economists, are seeing the ‘Summer of 2016’ as a dangerous period of time where and when a financial, economic, or monetary ‘collapse’ could take place from any number of ‘flashpoints’. The actions that are now taking place, in the equity markets, are an indication that these ‘fears’ may very well be arriving much sooner than most analysts expect.
The economy is still performing ‘significantly’ below its’ potential:
The problem is that the FED, including other Central Banks, have waited too long and gone too far in their ‘zero interest rate’ policies and ‘quantitative easing’ programs. With all of this nonsensical talk coming from the FED, the debt default levels, especially for credit default swaps on the 10-year Treasury are NOW at their highest level since the FED raised rates by a quarter of a point, back in December of 2015.
The probability of a U.S. default of its’ debt has hit its’ highest point since the FED has hiked rates in December of 2015. This is indicated by the recent dynamics in credit-default swap (CDS) agreements. The expectations that the Central Bank may raise borrowing costs still further, in the coming months, will set off this ‘time bomb’. Since the FED has turned increasingly hawkish of their policy outlook since late April 2016, market volatility has increased, with stocks swinging between gains and losses and U.S. Treasuries sliding along slide with the dollar. “Systemic risks” stemming from the CDS transactions are rising amidst the unfavorable global financial environment. This is not only true in the U.S., but its’ counterparts are also subject to greater turmoil in the coming months, as possible FED hikes, “Brexit” concerns, U.S. elections and faltering global growth are all interconnected factors thereby contributing to the recent spikes in U.S. CDS spreads.
If things follow the FED script, I imagine that next months’ payrolls will exceed ‘tapered down’ expectations and consequently, there will be an upward revision of Mays’ numbers. Will this continue sending the market into exuberance? NO! However, the FED officials will then restart the rate ‘hike’ talks with just enough offsetting uncertainties to mislead everyone while trying to keep the market ‘bubble’ from ‘bursting’.
The financial system is like a giant game of poker with all the major player holding a seven and two off suite (worst hand you can have), yet they are all-in with their chips (money & policies) trying to bluff their way out of this mess.
Things are going to be very crazy over the next 6-12 months and beyond, but until the US large cap stocks breakdown and start a bear market expect tough trading and investing.
Chris Vermeulen
related:
Canada’s Monetary Policy Stuck Between a Rock and a Hard Place

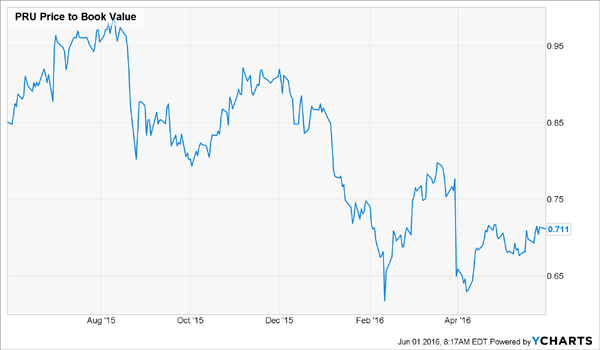
To say Prudential Financial (PRU) is cheap would be a huge understatement. The stock trades at just 71% of book value and 8.3-times forward earnings, ridiculously low levels for a company that generated $14.7 billion in free cash flow (FCF) in the last 12 months. That’s 42% of PRU’s $35-billion market cap!
…continue reading for 2 more Dividend payers HERE
also:
Negative Interest Rates Set to Propel the Dow Jones to the Stratosphere?

“The Fed seems to be constantly changing its focus from one meeting to the next. They seem to regularly promise hikes, only to back off at the last second. Fed statements often seem stale, reflecting where the economy and markets were a couple months ago, rather than current conditions. They say their 2% inflation target is not a ceiling, and yet they only plan to bring inflation back to 2%. They argue that the risks to the outlook are very asymmetric—with rates near zero they have limited anti-recession ammunition—and yet their inflation target is symmetric. This is policy transparency?”
 ….read more from ZeroHedge HERE
related:
Canada’s Monetary Policy Stuck Between a Rock and a Hard Place

As you go about your everyday life, it’s easy to forget how big the economic problems we face really are… and how desperate our political leaders have become to safeguard the existing system.
That’s because of human psychology. It’s called the “normalcy bias.” It explains why, if you don’t heat up the water too fast, the “frog” never jumps out of the pot before it starts to boil. People (the frogs) have a hard time believing that tomorrow won’t be a lot like today. It can be almost impossible to open your mind enough to think about how the world might look a year from now… or five years from now… if there’s a serious economic crisis.
That’s what I believe is going to happen. I’ve written about the problems I see in the world economy over the past year or so. I’ve described the potential for $1.7 trillion in corporate-bond defaults, a credit crisis I’ve said would be “the greatest legal transfer of wealth in history.”
If you don’t agree with me, then all of these warnings might make me sound like a crazy person. I probably sound crazy to a lot of people… at first. But I put the bug in their ear. Slowly, they start seeing what’s happening. It takes time. But I believe, more and more, you’re starting to see these things for yourself. It’s getting harder to believe that everything is fine.
Meanwhile, I don’t advocate selling everything you own and moving to New Zealand. Nor do I even recommend selling all of your stocks. I am telling you: Keep your head up and your mind open to the risks. What’s about to happen isn’t just a normal market correction or even a bad bear market. What’s about to happen is a once-in-a-century debt-default cycle that could destroy the world’s existing paper-money standard.
Think that’s nuts? OK, maybe it is. But take a minute and look at this chart…
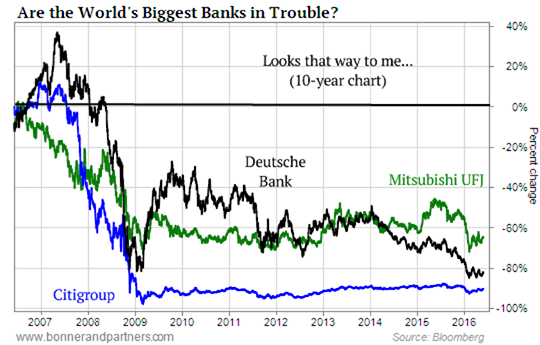
This chart isn’t hard to figure out. It simply compares the largest, most systematically important banks in the world: Mitsubishi UFJ (MTU), Deutsche Bank (DB), and Citigroup (C). Their share prices are down 66%, 80%, and 90% over the past 10 years.
How is that possible?
I’d like for you to ask yourself two simple questions: First, if you believe that everything in the world’s economy is basically fine and operating normally… how could the three most important banks in the world all be falling apart? Ask a reasonably well-read and knowledgeable person – like your broker, or the friend you always talk with about investments – what the 10-year return has been on the three largest banks in free-market capitalism. I guarantee they won’t come anywhere close to the correct answer.
That’s normalcy bias in action. People constantly disregard any facts or data points that don’t match their underlying assumptions, especially when those data points would disrupt a long-held belief or worldview. Let me say this as plainly as I can: If our global financial system were working normally, the returns on these major, immensely important piles of capital would at least be positive.
Here’s the second question I want you to think about carefully: How far will these banks have to fall before you think seriously about taking all of your savings out of the banking system? If these banks fail, the system will fail. And how much faster will you make the decision to pull your cash if these banks begin charging you to hold your cash in their bankrupt vaults?
Now… let me back up for a second.
The reason these banks have struggled for an entire decade isn’t hard to understand. You don’t need to be an economist. If you have been alive for the last 20 years, you know what happened…
A tremendous amount of credit was created out of thin air around the world. You can measure it in plenty of ways: total debt to GDP, the size of financial earnings as a percentage of GDP, debt service as a percentage of household income. I could bury you in numbers… but they all mean the same thing.
For an entire generation, most people in the world’s major, wealthiest economies consumed far more than they produced, resulting in a debt bubble of mind-boggling, epic proportions.
This process of unlimited credit creation is hitting the wall of economic reality. Wages haven’t grown. Productivity hasn’t grown as fast. And various economic tricks to extend even more credit – like increasing international trade, manipulating currencies, and printing money – are running out of steam. Thus, this massive, global bubble is beginning to deflate. Before that can happen, though… credit has to stop expanding. That’ll be the first sign that the real collapse is happening.
As you’ll recall, a lot of the credit created in our economy relied on ever-increasing housing prices. Fannie Mae and Freddie Mac were the primary guarantors of the bubble in the U.S. – a total of $5 trillion in credit was created in about a decade on just two balance sheets.
Lately, though, credit has only been expanding in far less secure ways. Globally, credit has been expanding by lending to corrupt emerging markets (like China, Brazil, and Russia). In the U.S., credit has been piled onto the backs of college students and subprime auto lending (nuts!). Sovereign debt around the world has technically been expanding, too… But as you know, that’s a rigged game where the national treasuries offer bonds and the central banks buy them with newly printed money.
And so… the world economy has moved from making loans on good collateral (sound residential mortgages) to lending billions to corrupt dictatorships, unemployed college students, and subprime auto-buyers. Oh, we’re also growing credit by printing money. No wonder those major banks are falling apart. I’d be willing to bet a huge amount of money that the folks auditing the banks’ loan books don’t keep their cash in those banks.
In various ways, all of these bad loans end up on the balance sheets of the world’s biggest banks. The means of transmission are varied: The loans are securitized, they’re sold, they’re “swapped.” These loans and their underlying collateral end up in a myriad of different derivative products. In short, they’re everywhere. These loans are at the heart of the financial system we use to drive the world economy. And today, they’ve transformed the global economy into a mountain of hugely inflated value… a giant pile of steaming, worthless garbage.
So what happens when suddenly, for no discernable reason at all, everyone decides to stop pretending otherwise?
When that happens, the authorities will have three choices. They can…
- Inflate away the bad debt by devaluing the currency and propping up the banking system with newly printed money and trade surpluses. That’s the International Monetary Fund’s playbook. It’s what Japan has tried to do for 30 years. And it seems like that’s what America and Europe are going to try now, too. Or…
- Write off the bad loans, shut down the bad banks, and suffer a severe (but short) crisis. That’s the sound-money option. (Nobody does that anymore, because depositors in the bad banks would lose everything… and they vote.) Or…
- Simply repudiate a lot of the debt and stiff the creditors, like Russia did in 1998 and Iceland did in 2008. (That option works best if you have foreign creditors… like Argentina did in 2002.)
Nobody knows what’s going to happen when most of the world’s wealthiest and largest economies try option No. 1 at the same time. But let me hazard a guess: The outcome isn’t going to be good for people who saved all of their money in paper currencies.
And that brings us to gold. As you may know, gold had its best quarter since 1986. The metal’s spot price was up more than 16% in the first quarter of 2016. Yes, this could be simply a random price move. But I don’t think so.
My friend Dr. Steve Sjuggerud has done careful studies of what moves of this magnitude mean in the market for gold. His research analyst Brett Eversole published the results of one of their most recent studies in the March 8 DailyWealth. Their work shows that given gold’s recent price moves, they would expect gold to move 19% more over the next 12 months.
Keep in mind, that’s based on the last 40 years of trading during normal market conditions… not a period that features a global financial crisis like the kind I expect. So it’s a good time to buy gold, even if the crisis we expect doesn’t materialize.
Gold does best when real interest rates are negative. The reason is easy to understand: Gold is the ultimate hedge against the loss of purchasing power in paper currencies. If governments can’t offer a real rate of return for holding their bonds, then investors aren’t being protected against inflation. And as a result, they flee to gold.
Negative interest rates would greatly exacerbate this logical market preference… and that’s exactly why gold has been soaring lately. As Steve explained in the March 15 DailyWealth…
When both gold and paper money pay zero-percent interest, investors prefer gold over paper. Right now, paper money is paying you zero [or even less]… It’s time for people to own gold.
We now stand on the precipice of one of the biggest bull markets in gold the world may ever see.
I personally believe the price of gold could be more than 10 times what it is today. And certain gold stocks could go up 10, 20, or even 50 times their current prices.
Regards,
Porter Stansberry
Founder, Stansberry Research
For an offer from Stansberry Gold Investor, click here
related from Larry Edelson:

-
I know Mike is a very solid investor and respect his opinions very much. So if he says pay attention to this or that - I will.
~ Dale G.
-
I've started managing my own investments so view Michael's site as a one-stop shop from which to get information and perspectives.
~ Dave E.
-
Michael offers easy reading, honest, common sense information that anyone can use in a practical manner.
~ der_al.
-
A sane voice in a scrambled investment world.
~ Ed R.
Inside Edge Pro Contributors

Greg Weldon

Josef Schachter

Tyler Bollhorn

Ryan Irvine

Paul Beattie

Martin Straith

Patrick Ceresna

Mark Leibovit

James Thorne

Victor Adair