
Stocks & Equities

Ever since August 2014 the S&P 500 has been trading in a relatively tight range of roughly 18%. That’s one of only five times it has traded in a range of less than 20% over a period of 22 months. Looking at the chart, 2005 and 2006 were the last times to see a range this tight. Of course, that was nearing the end of that bull market, but the two times before were the mid-1990s and late 1984. Both of those occurrences were simply a break in multiyear bull markets.”
…read entire article with charts HERE
related: Negative Interest Rates Set to Propel the Dow Jones to the Stratosphere?

According to Faber, gold mining stocks and drillers are the way to go. His reasoning is pretty simple: gold prices move opposite to the greenback, which means “more money printing” could boost any stock related to precious metals. Faber on the latest developments in Gold, Silver, Platinum and Palladium Prices.
related: A Golden Opportunity

SWOT Analysis: Global Demand for Gold Is Highest Ever For a First Quarter
– Strengths
- Investors seek safe haven investments in a time of economic fragility and uncertainty caused by negative interest rates, reports China Daily. The article continues by pointing out that buying U.S. Treasuries or other sovereign debt from Western countries has also become a “less attractive option for central banks because of their low yields.”
- This week the World Gold Council reported that in the first quarter of 2016 global demand for gold was 1,290 tons – the highest ever for a first quarter
- The best performing precious metal this week was silver, down 1.82 percent.
- According to data from the Commerce Department on Thursday, orders for U.S. capital goods declined unexpectedly in April for a third straight month, reports Bloomberg. With American manufacturers continuing to pull back, this could indicate a lesser chance for the Federal Reserve to raise rates in June.
- The global manufacturing purchasing managers’ index (PMI) is on track to decline in May, reports Cornerstone Macro. The research group believes this is a likely outcome given declines in the May Japanese and eurozone manufacturing PMIs, as well as a probable decline in the U.S. manufacturing PMI. Cornerstone points out a handful of important global tailwinds in its report including low interest rates and healthy U.S. growth, but says there are even more headwinds that include a China slowdown, excess emerging market debt and a Brexit risk, to name a few
– Weaknesses
- The worst performing precious metal for the week was platinum, down 4.40 percent.
- Gold traders are bearish for a second week – the first successive week since mid-April – as bets increase on an interest rate move from the Fed, reports Bloomberg. The Fed Funds futures show the odds of a rate increase by July seen at 52 percent, up from 48 percent at the end of last week.
- Following a pause in the dollar’s rally this week, Bloomberg reports that gold snapped six days of losses, rebounding from the lowest level in seven weeks. The article continues, stating that gold is still headed for the biggest monthly drop since November on speculation the U.S. Federal Reserve will increase U.S. borrowing costs as early as next month, denting demand for bullion.
- As Venezuela’s economic crisis deepens and the government faces concerns that it could struggle to honor bond payments, the country held the biggest gold sale by a central bank in eight years, reports Bloomberg. According to data from the International Monetary Fund, Venezuela cut its gold reserves by 16 percent in the first quarter, following a 24 percent reduction in 2015.
– Opportunities
- The Fed may be bluffing on a rate hike, according to Mark Matthews, Head of Investment Research at Julius Baer Group. In an interview with the Economic Times, Matthews discusses the Fed’s history of contradicting itself, most recently on its stance back in February and March. “I think they did not like the fact that the market was not pricing in any rate hikes this year,” Matthews said. “They wanted to have some implicit threat of a rate hike in the market and they have largely achieved that now.”
- Analysts at RBC Economics have come out stating that despite the “surprisingly hawkish” minutes from the Fed, raising rates in June is “nearly impossible.” In a report released Tuesday by RBC, the group stated “We think a lot of things have to align in order for the Fed to justify a lift at the July confab. September is still complicated by Money Market reform, and November falls right on top of the U.S. presidential election.”
- Deutsche Bank, in a recent note, says that by preparing markets for future interest rate hikes, the Federal Reserve potentially hampers its ability to actually carry out those hikes in the future, reports Business Insider. The article continues by stating, that said in another way, “The Fed appears stuck in a negative feedback loop wherein suggestions that higher rates are coming create the unsettled conditions that ultimately force the Fed to keep rates right where they are.
– Threats
- UBS believes that gold is set to “roll over,” reports Bloomberg, forecasting bullion to drop back to $1,150 an ounce. The yellow metal could tumble as the U.S. dollar “erodes demand with the Federal Reserve opting for not one, but two rate increases before the year-end,” according to UBS Group AG’s wealth-management unit. Not everyone sees a retreat in gold however. Citigroup raised its year-end target by $100 to $1,250 an ounce, reports Bloomberg.

- In an interview with CNBC this week, Dennis Gartman cautioned investors on when he believes they should come off the sidelines for gold. He says the time to be bullish on gold is not until after the first interest rate hike of the year. Assuming that a rate increase will happen in 2016, he thinks investors should avoid the precious metal in the near term, as he expects an active market to remain after the central bank acts, reports CNBC.
- Retailers in Hong Kong are forecast to see the worst downturn in gold sales in at least 15 years, reports Bloomberg. Fewer mainland shoppers are spending less money on jewelry, the article continues, and China’s economic slowdown and anti-corruption campaigns have hurt luxury retailers in Hong Kong with visits by Chinese tourists.
Frank Holmes – US Global Investors
related: Clash of Titans Propels Gold

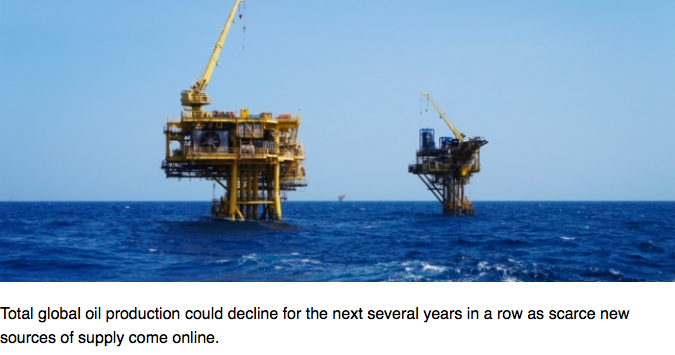
Total global oil production could decline for the next several years in a row as scarce new sources of supply come online.
According to data from Rystad Energy, overall global oil output will fall this year as natural depletion overwhelms all new sources of supply. But the deficit will only widen in the years ahead due to the dramatic scaling back in spending on new exploration and development.
Statoil says that global capex is set to fall for two years in a row, and is on track to fall for a third year in 2017 as more spending cuts are likely. “For the first time in history, we’ve seen cutting of capex two years in a row and potentially we risk a third year as well for 2017,” Statoil’s Chief Financial Officer Hans Jakob Hegge told Bloomberg in a recent interview. “It might be that we see quite a dramatic reduction in replacing the capacity and of course that will have an impact, eventually, on price.”
Oil companies are making painful cuts to spending, which will translate into much lower production than expected in the years ahead.
Although markets have dealt with the supply overhang for the better part of two years, the surplus could flip to a deficit as early as this year, as declines exceed new sources of production by a few hundred thousand barrels per day. That widens to more than a million barrels per day in both 2017 and 2018. To be sure, there are extremely large volumes of oil sitting in storage, which will take a few years to work through. That will prevent any short-term price spike even if depletion surpasses new production. But Statoil’s CFO said the world could start to see supply problems by 2020.
According to a separate report from SAFE, a Washington-based think tank, the oil industry has cut somewhere around $225 billion in capex in 2015 and 2016, which will lead to global supplies 4 million barrels per day lower in 2018-2020, compared to what market analysts expected as of 2014.
Of course, these figures are not inevitable. A sharp rise in oil prices would spur new investment and new drilling. In other words, deficits create profit opportunities for drillers, ushering in new supplies. The price acts as a self-correcting mechanism.
The problem is that, unlike many other industries, resource extraction is extremely volatile, with supply responses very delayed. Many oil projects, after all, take years to develop. Supply overshot demand, crashed prices, and in response, supplies will undershoot demand in the next few years. The industry has always suffered from booms and busts, and there is little reason to think that it will change, at least in the short run.
But we tend to have a myopic view on what to expect. When oil prices go up, people buy fuel efficient cars. When they go down, SUVs are back in style. When the world is dealing with too much supply, market watchers predict oil prices will stay low for years to come. If spot oil prices suddenly rise, forecasts are revised sharply upwards.
Here’s another example: the WSJ reports that oil prices are entering a “sweet spot,” a range between $50 and $60 per barrel that could finally be good for the global economy – low enough to provide consumers with a bit of a stimulus, but high enough to keep the industry and capital spending afloat. Also, crude at $50, as opposed to $30, can provide a bit of inflation to the deflation-beset economies in Europe and Japan. “Crude between $50 and $60 would be the absolute sweet spot,” Mark Watkins, regional investment manager at U.S. Bank Wealth Management, told the WSJ. “Everybody wins there.”
That is all well and good, but who expects oil to trade between $50 and $60 for any lengthy period of time? If there is one thing that we have learned over the past two years, it is that nobody has a crystal ball on prices. And if the industry indeed cuts capex for three consecutive years, at a time when demand continues to rise, the one thing we can be sure of is more volatility.

“Technically Speaking” is a regular Tuesday commentary updating current market trends and highlighting shorter-term investment strategies, risks, and potential opportunities.

Given the markets were closed on Monday, the analysis from this past weekend’s missive did not change. The important takeaway from that analysis was:
“A couple of week’s ago I discussed the rather clear “head and shoulders” technical pattern that we developing in the market. These patterns often suggest deeper corrections if they complete by breaking neckline support. A “gray rhino”if there ever was one.
The good news is the rally this past week terminated that formation by breaking the very short-term downtrend line as shown below.”
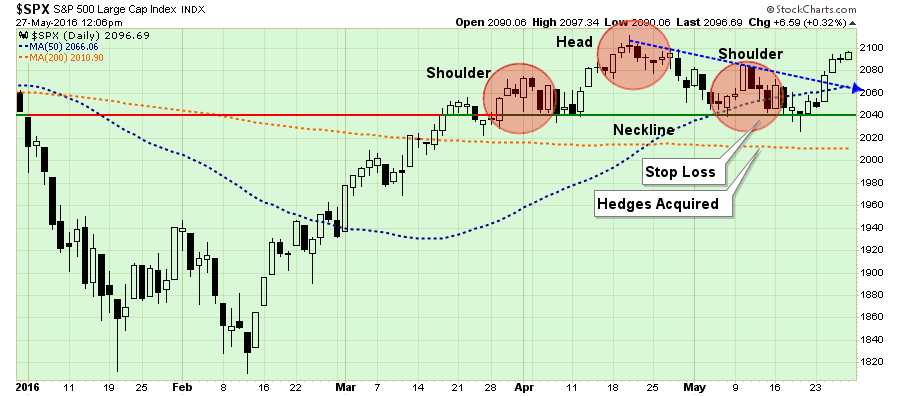
“While the market did nullify the more bearish short-term pattern, it is important to note that the market has not done much more than that.
All that really happened last week, as shown in the chart below was an oversold bounce on deteriorating volume confined to an overall market downtrend.”
….more analysis and 10 charts HERE
related: Negative Interest Rates Set to Propel the Dow Jones to the Stratosphere?


-
I know Mike is a very solid investor and respect his opinions very much. So if he says pay attention to this or that - I will.
~ Dale G.
-
I've started managing my own investments so view Michael's site as a one-stop shop from which to get information and perspectives.
~ Dave E.
-
Michael offers easy reading, honest, common sense information that anyone can use in a practical manner.
~ der_al.
-
A sane voice in a scrambled investment world.
~ Ed R.
Inside Edge Pro Contributors

Greg Weldon

Josef Schachter

Tyler Bollhorn

Ryan Irvine

Paul Beattie

Martin Straith

Patrick Ceresna

Mark Leibovit

James Thorne

Victor Adair