
Gold & Precious Metals
This year’s first quarter is one for the history books. Not only did gold appreciate at its fastest pace in 30 years, but demand for the yellow metal was the strongest it’s ever been on record.
Let me repeat that: the strongest it has ever been.
Demand surged 21 percent from the same period a year ago, according to the latest World Gold Council (WGC) report. Most of this demand was driven by investment, with net inflows into gold ETFs reaching 363.7 tonnes, a seven-year high.

Meanwhile, demand for bars and coins shot up 55 percent year-over-year, from 11.8 tonnes to 18.3 tonnes. Appetite for American Eagles coins jumped 68 percent.
Bad News Is Good News for Investors Who Have Diversified with Gold
Uncertainty over the world economy, not to mention central bank policy, continues to act as a major catalyst for demand, heating up the Fear Trade. With many countries currently locked in a global race to see who can devalue their currencies the fastest, investors are seeking better, more reliable stores of value, and gold is happy to oblige.
 This was the message shared by Wayne Allyn Root, the “Capitalist Evangelist,” whose presentation I had the pleasure to see at the MoneyShow last week in Las Vegas. The week before last I said I would be speaking at the event, which was founded in 1981 by my dear friend Kim Githler, and I had no idea how popular Root really was. A businessman, politician and author, Root was the vice presidential candidate for the Libertarian party in 2008 and this year endorsed Donald Trump for president. At the MoneyShow, he packed the room with 1,400 people. Whole crowds turned out to hear him sermonize on entrepreneurship, individual rights and the importance of owning tangible assets such as precious metals and rare coins as a hedge against inflation and today’s uncertain financial markets. Owning gold, he said, is no longer a luxury but a necessity.
One of Root’s most interesting data points is just how much purchasing power the dollar has lost since 1913, the year the Federal Reserve was created: A million dollars then is worth about $25,000 today. Gold, on the other hand, has not only held its value but appreciated. One million dollars in gold in 1913 would now be worth more than $60 million.
Other huge names that presented at the MoneyShow included Gary Shilling, Art Laffer and Craig Johnson, a Piper Jaffray CFA and President of the Market Technicians Association. I had an enjoyable dinner with Craig, who called the current rally a “FOMO” rally. (I only recently learned, from my niece, that FOMO stands for “fear of missing out” and is widely used on social media.)
Another illuminating presentation I’d like to mention was conducted by IBD’s Amy Smith, who convincingly spoke on how the 2016 elections might change the stock market. The most actionable takeaway was that most blue chip stocks have typically done well no matter who occupies the White House, confirming my own attitude that, at the end of the day, it’s the policies that matter, not the party. The most compelling example she used was Netflix, whose stock has been a steady climber throughout both Bush 43 and Obama’s presidencies.
A reasonable, well-positioned portfolio, then, consists of strong, entrepreneurial names; gold (I always recommend a 10 percent weighting: 5 percent in gold stocks, 5 percent in physical bullion); and short-term, tax-free municipal bonds, which have historically done well even in times of economic turmoil, such as the tech bubble and the financial crisis.
Follow the Smart Money
The smart money is indeed flowing into gold right now. Earlier this month I shared with you the fact that hedge fund manager Stanley Drukenmiller, notable for having one of the best money management track records in history, cited gold as being his family office fund’s number one allocation. Druckenmiller is joined by billionaire Paul Singer, whose hedge fund oversees $28 billion. In his letter to clients last month, Singer wrote: “It makes a great deal of sense to own gold… Investors have increasingly started processing the fact that the world’s central bankers are completely focused on debasing their currencies.”
About a third of global debt right now comes with a negative yield.
Elsewhere in the letter, Singer suggested that gold’s phenomenal first quarter, in which the metal rose 16.5 percent, is “just the beginning.” Further loss of confidence in central bankers’ ability to jumpstart growth could take the metal even higher.
This is the assessment of Paradigm Capital, who wrote in a recent report that “a standard gold price rally, a percentage exceeded or achieved in four of five major upcycles since 1976, would take us to around $1,800 ounces over the next three to four years.”
Lucara Diamond Sparkles Brightly

It seems only natural to follow a discussion on gold with one on diamonds. Just as gold demand is largely driven by the Love Trade, especially in India and China during religious and cultural festivals, diamonds rely largely on celebratory lifestyle events such as engagements, weddings and anniversaries.
Lucara Diamond has given us another reason to celebrate.
The Vancouver-based company was founded by billionaire Lukas Lundin, an old friend. We believed in his vision to build a profitable diamond company in South Africa, and we were one of its earliest investors. In any case, Lucara just sold an incredible 813-carat diamond for $63 million, a new record for a rough gem. Known as “The Constellation,” the rock was discovered in the company’s Karowe mine, located in Botswana, the second largest diamond producer following Russia. In 2013, diamonds accounted for more than 80 percent of the small African country’s export earnings and 26 percent of its GDP.
As part of the deal, Lucara retains a 10 percent interest in the diamond, allowing the company to continue to profit from the stone after it’s been polished and cut.
The Constellation’s record might be short-lived, however. Another Lucara diamond—the 1,109-carat “Lesedi La Rona,” the second largest diamond ever discovered—is scheduled to be auctioned off next month at Sotheby’s and could very well fetch an even higher price.
We’ve been very happy with Lucara’s leadership and performance. So far this year, its share price has appreciated 75 percent and is now trending at a nine-year high.

The mid-tier company posted a stellar first-quarter net income of $17.1 million, up 185 percent from the same period a year ago. Total sales averaged $649 per carat, compared to $278 per carat in 2015. This is especially impressive considering overall diamond prices have declined more than 10 percent over the last 12 months, according to the Zimnisky Global Rough Diamond Price Index, mainly due to subdued demand and excess supply.
Frank Holmes
CEO and Chief Investment Officer
U.S. Global Investors
related: Massive Silver Rally During The Coming US Dollar Collapse

 The oil market has been heating up in recent weeks, and even Goldman Sachs revised its forecasts higher for oil prices this year. That was mostly due to supply-side changes, such as the wildfire in Canada and Nigeria’s oil disruptions. Even though these issues are likely to have already impacted oil inventories, the oil market still faces several hurdles that could keep oil prices from rising much higher than their current levels of around $50.
related: Saudi Arabia’s Oil-Bust Cash-Flow Debacle Begins to Bite

“There is ABSOLUTELY NO INDICATION yet that we are in a bearish trend poised to break last year’s low in the Dow. Another retest of support – YES.” – Martin Armstrong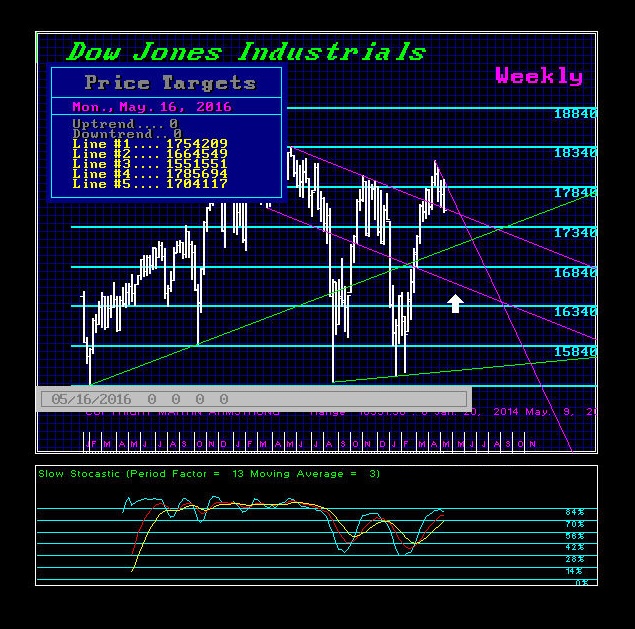
The Dow does not need to break last year’s low, as that was accomplished in the NASDAQ and S&P 500. Nothing has changed there. The entire interest rate issue has far too many people brainwashed. No doubt, they would initially sell. However, the market will rise with higher interest rates as it has always done. Therefore, as shorts build, we can easily create a bear trap and that will be the fuel to rally again. This is the churning we are in until it appears at least after September.
This time, we have a far more serious problem with where to put money – big money. Stocks are the modern-day version of what gold used to be decades ago when you could jump on a plane with a suitcase full of gold and sell it wherever you landed. Today, metal detectors prevent that from taking place. Stocks are being used to move money, but they must be the high-end shares that are traded globally (see article posted on Egypt).
There is ABSOLUTELY NO INDICATION yet that we are in a bearish trend poised to break last year’s low in the Dow. Another retest of support – YES. This is the churning pattern. Breaking last year’s low would ONLY be indicated with a monthly closing beneath 16000 prior to August. Then we are merely extending this entire mess and not altering the long-term outcome.
That said, we have a more important number for month-end at 17579 followed by 17210. A May closing below 17210 would signal a possible test of the 16000 level in the months ahead.
Nevertheless, the first Minor Weekly Bearish Reversal in the Dow lies at 17434, which we flirted with on Thursday. We need a closing below this today to suggest a correction is unfolding. However, make no mistake about it, the next critical area is 17120, which happens to be a Daily and Weekly Bearish Reversal. That is the level to watch for a serious short-term break.
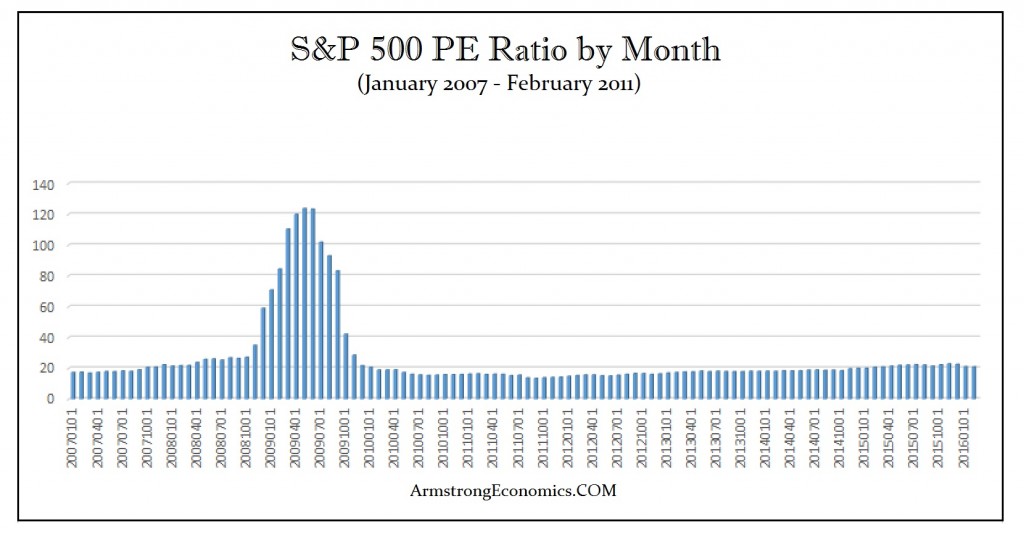
Keep in mind that people continue to think this market is “rich” in price and they are concerned about earnings. Those ideas are so out of touch with reality. The PE Ratioreached 50:1 in 2000 during the DOT.COM bubble, but it exceeded 120:1 during the 2007-2009 meltdown because blue chips are the place to secure money. The market is by no means “rich” from a historical perspective. We are not in some standard investment scenario. A 3% dividend is huge with negative interest rates in cash. Bonds are a disaster and have nowhere to go but down. So how is the market “rich” when there is no other alternative? This is why money has flowed into real estates, ancient coins, metals, and equities. We must look at the alternatives here and the idea of selling stocks must be followed with deciding where to put your cash. Banks or government bonds? Come on. Where’s the rational thinking here?
…more from Martin: Trading Volumes Decline as Hoarding Rises Due to Uncertainty

 Bonds: Hedge funds profited this week on their big short in the 5-year, correctly betting on higher short-term rates. Commodities: Money managers aggressively sold copper. They continue to buy gold and sugar. Currencies: Institutions and hedge funds have a large net long position on in the Euro. Stocks: Hedge funds remain super short the Nasdaq.
…click HERE for full Analysis and more charts

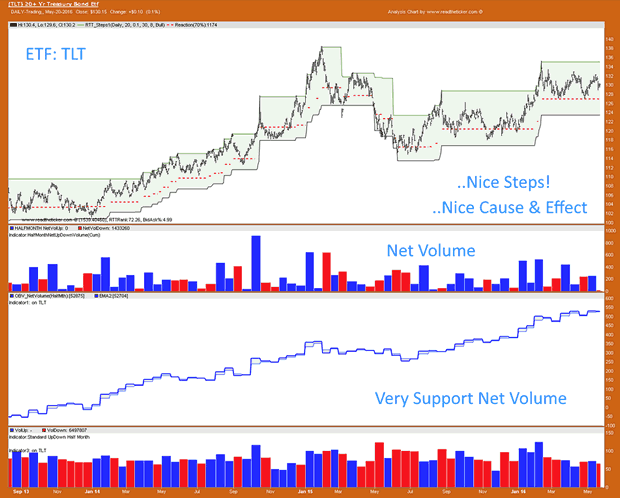
The TLT includes US Bonds maturing between 20 and 30 years. The TLT chart shows no fear of the US FED raising rates. It looks strong and higher prices should be expected in the months ahead. Higher prices means lower average bond yield or lower interest rates are expected. Simply the folks supporting the TLT price do not believe the FED is on a long term rate hike plan.
The chart below is showing off RTT NetVolume tools.(RTT = readtheticker)
Investing Quote…
“Anyone who buys or sells a stock, a bond or a commodity for profit is speculating if he employs intelligent foresight. If he does not, he is gambling.” ~ Richard D Wyckoff
“To me, the ‘tape’ is the final arbiter of any investment decision. I have a cardinal rule: Never fight the tape!” ~ Martin Zweig
“It’s not what you own that will send you bust but what you owe.” ~ Anon
“In the short run, the market is a voting machine, but in the long run it is a weighing machine.” ~ Benjamin Graham
“If past history was all there was to the game, the richest people would be librarians.” ~ Warren Buffett
Also:

-
I know Mike is a very solid investor and respect his opinions very much. So if he says pay attention to this or that - I will.
~ Dale G.
-
I've started managing my own investments so view Michael's site as a one-stop shop from which to get information and perspectives.
~ Dave E.
-
Michael offers easy reading, honest, common sense information that anyone can use in a practical manner.
~ der_al.
-
A sane voice in a scrambled investment world.
~ Ed R.
Inside Edge Pro Contributors

Greg Weldon

Josef Schachter

Tyler Bollhorn

Ryan Irvine

Paul Beattie

Martin Straith

Patrick Ceresna

Mark Leibovit

James Thorne

Victor Adair