
Timing & trends
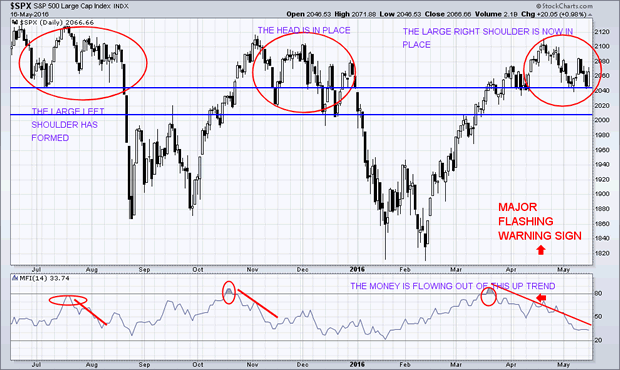
Currently, a ‘sharp fall’ is now anticipated within the equity markets! This decline will be accompanied with ‘new volatility’. There is a great deal of ‘uncertainty ‘within the U.S. markets. Currently, we are viewing a ‘textbook’ ‘head and shoulders pattern’ in the SPX and is going to be a big inflection point we look back on months from now.
There are less and less stocks that are participating in the recent move upwards which suggest a technical breakdown is likely to happen.
The ‘cycles’ of the SPX have recently confirmed that we have now witnessed the ‘highs’. The ‘top’ is currently in place and I expect that the ‘negative trend’ will continue to persist.
See my live analysis charts and forecast click here
The ‘smart money’ has been exiting the equity markets during the last few weeks with strong waves of selling volume taking place on a consistent basis.
Yesterday morning, Monday, May 16th, 2016, I alerted my subscribers to two new positions to enter into so as to take advantage of during this next significant market move and change in volatility.
Consequently, consumers have already started to slow down in their spending. They will change their past behavior, and, as a result, will begin to save (whatever funds that they may still have) as stocks start to fall in value along with the average investors retirement accounts. The present day spending behavior will come to a grinding halt in due time!
Before “The Great Credit Crisis of 2007-2008”, the ‘smart money’ exited the equity markets in November of 2006. And it appears that the NDX-100 and the Russel 2000 are leading the ‘charge’ downward once again for the pending market correction.
We are, once again, repeating this same technical pattern, now!
Concluding Thoughts:
In short, the first chart I showed in this article paints a very clear picture of where stock prices are headed – Lower.
Large cap stocks over the past year have been making lower lows and lower highs. The most novice of traders knows what that means… It means, we are in a down trend.
There are many ways to take advantage of what is about to unfold next, but how you play it really depends on how much money you have to play with and the level of risk tolerance you have.
Also: Rick Rule Warns Of U.S. Dollar Troubles And Says The Gold Bull Is Headed Much Higher
I share a few ways I am taking advantage of this with followers of my newsletter at: www.TheGoldAndOilGuy.com

 Way back in 2008, Warren Buffett made a million-dollar bet with Ted Seides of Protégé Partners that he could beat the hedge fund manager’s performance over a 10-year period using a single handpicked mutual fund. At the time, if you recall, hedge funds were the “bomb” and many investors wanted access to managers who could supposedly beat the market as our economy lurched into the Financial Crisis.
Fast forward to today and this bet has rattled the hedge fund industry to its core. I’d even go so far as to say it might help kill it. But that’s not the real story.
What you need to understand is that headlines the media will run when Buffett wins two years from now will not be correct: index funds are not better than hedge funds. More importantly, they never will be.
Something else has made all the difference… and believe me, Buffett knows exactly what it is.
More precisely, he knew from the very get-go why he wouldn’t lose.
Here’s what you need to know when it comes to your money.
Buffett’s bet is pretty simple when you take it at face value, which is probably what Seides did when he accepted the bet that a single, simple index fund that invests in the S&P 500 would outperform five handpicked, actively managed “fund of funds” Protégé selected.
Buffett chose the Vanguard 500 Index Fund Admiral Shares, while Protégé selected five “funds of funds” that, in turn, held positions across a wide variety of specialized portfolios in other hedge funds – hence the name. Practically speaking, Buffett went for the “meat and potatoes” while Protégé opted for a five course gourmet dining experience.
Eight years in and with two years to go, the Admiral Shares have returned 65.67%, while Protégé’s funds have tacked on only 21.87%. I love underdogs as much as the next guy, but there’s a snowball’s chance in hell that Protégé can win at this point.
Many people believe the underperformance is because hedge fund fees are so high, and they’re not entirely off base.
Admiral Shares, for example, charges 0.05% a year, while hedge funds commonly charge 2% of assets under management and skim 20% of the profits right off the top. Effectively, this structure means the “breakeven” for hedge fund investors is far higher.
To that end, a recent Fortune article on Buffett’s bet pointed out that the S&P 500 has returned approximately 6.5% a year for the past eight years, but that a hedge fund using the fee structure I’ve just outlined would have to post numbers north of 9% a year to generate an equivalent amount of money for investors.
Unfortunately, Protégé chose “funds of funds,” so there’s another layer of fees which in this case was around 3% a year, also according to Fortune. That means the hurdle needed to beat the Admiral Shares effectively jumps to at least 12% a year.
But again, fees are a red herring.
The real reason Buffett is winning his bet is something else entirely – Buffett chose to concentrate his assets. As one of the world’s most successful investors, he understands that diversification actually drives returns toward the mean and effectively reduces them over time. So he goes out of his way to avoid it.
Normally, Buffett does that by learning a lot about one or two key companies and investing accordingly. In this, however, I think he knew that the United States stood on the cusp of a massive capital realignment.
Certainly his public commentary at the time reflected that. So, too, did his investment choices. If you recall, he paid $5 billion to buy into Goldman Sachs Group Inc. (NYSE: GS) and another $300 million to pick up shares of General Electric Co. (NYSE: GE).
Having spent 65 years as a professional investor, I believe Buffett understood that money would flow into large-cap companies because they offered the most upside and were collectively priced at the deepest discount by virtue of the Financial Crisis. That meant he could pick a single index fund and get away with it.
Further, Buffett prefers to buy when there’s a discount to intrinsic value, because that means there’s a built in margin of safety in case things don’t go as expected with whatever he’s buying. In 2008, that thinking applied to the entire market, not just specific stocks.
But most of all, Buffett knew he was buying real businesses with real potential and real upside. And that’s why he could make a single choice, and why he knew it would pay off over such a long time horizon.
To paraphrase the great man himself, the scorecard for investment decisions will be provided in business results over time, not by prices on any given day.
related: Another famous investor Jim Rogers on “Buying Panic”

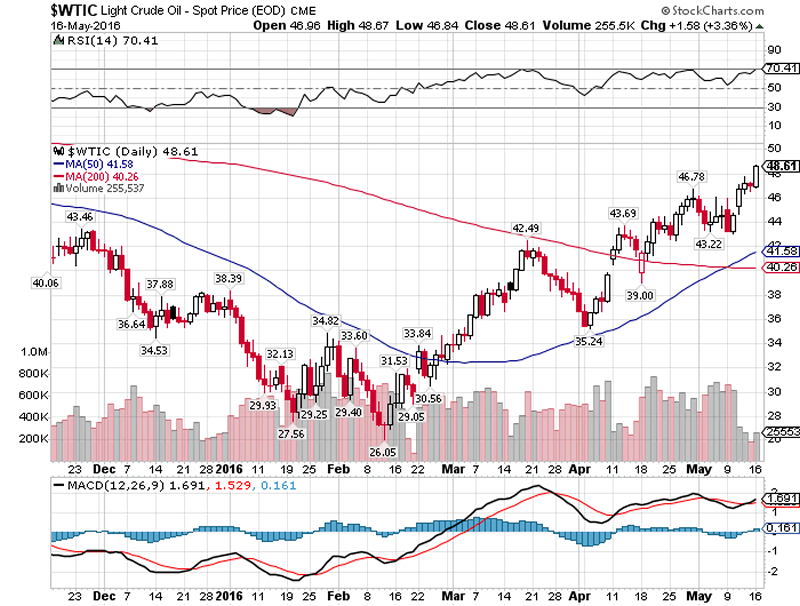
Implications for Stock Market – “the oil price has clawed it’s way back relentlessly through a series of critical levels of first $30, $35, $40, and most recently popping above $45 to stand at a high for the year of $48! Nearly DOUBLING in THREE MONTHS!”
At the start of the year the prevailing mood in the oil market was not just one of gloom and doom but of catastrophe as the oil price sunk below $30, skidding by the middle of February to virtually touch $25, a period during which many prominent analysts and investment banks such as Goldman Sachs all of whom were bearish on the prospects for oil prices this year some even suggesting that the oil price could sink to as low as $10 (Standard Chartered) which meant that the oil producers large and small, the frackers and even a string of nations such as Russia, Nigeria and Venezuela were on the fast track towards going bust as their oil profits that financed their state spending budget deficits evaporated.
We’ll barely 4 months on and the oil market has gradually transformed from that of imminent $10 apocalypse to one of hopeful recovery as the oil price has clawed it’s way back relentlessly through a series of critical levels of first $30, $35, $40, and most recently popping above $45 to stand at a high for the year of $48! Nearly DOUBLING in THREE MONTHS! And now all those who failed to see this coming are now forecasting higher prices i.e. one of the biggest oil bears of the year, Goldman Sachs now reckons the oil supply glut has evaporated and oil prices are going to reach $51, WOW crude oil has already risen to $48!
These are the SAME fools who have been banging the drums all year for an sub $20 oil price, but now AFTER the oil price has DOUBLED are proclaiming themselves as being bullish! This illustrates an important point! Goldman Sachs and the REST are nothing more than snake oil salesmen! They clearly don’t make money trading as you or I understand it to be, for if they did they would be back to being just as bankrupt as they were during the financial crisis. Instead they make their money by doing dubious deals such as that which bankrupted Greece, by means of hiding their debt!
Crude Oil Price Trend Forecast 2016
In terms of my oil price forecast for 2016, my in-depth analysis of Mid January forecast expectations for the crude oil price to bottom by early February at approx $25, the actual bottom came in at $26 and within the time window for a final bear market bottom as the following video analysis and article excerpt illustrate:
17 Jan 2016 – Crude Oil Price Crash Triggering Global Instability, Trend Forecast 2016
Crude Oil Price 2016 Forecast Conclusion
My forecast conclusion is for the crude oil price to trade within three distinct trading ranges for 2016 of $20 to $40, $35 to $50 and $62 to $40. Furthermore the trend pattern imposed onto the trading ranges implies that a bottom is likely by early February 2016 at around $25, followed by a trend higher into Mid year towards $50, a correction into September, followed by a trend towards $62 before succumbing to a correction during December to target an end year price of approx $48 as illustrated by the following forecast graph.
Crude Oil Price Forecast 2016 Implications for Stock Market Trend
My latest video analysis seeks to update what has transpired since, and whether the crude oil price remains on track to to continue trending towards $60 before the end of this year, and what this means for the stock market that I have consistently stated should track the crude oil price rally higher, whilst many if not most have long since convinced themselves that stocks were not only in a bear market but that a crash was always liniment! So found out the prospects for oil and the stock market in my latest video analysis –
related: The Oil Crash Is Over
Victor on the importance a May 3rd turnaround in the US Dollar, the most influential and strategic currency traded, and the near term direction of Gold & the CDN Dollar. He also describes a positioning risk tool that he uses a lot in determining where other markets are going.
also:
Mike with Ozzie Jurock and 2 Hot Properties as well as new regulations in real estate that are coming
 About Victor Adair:
Victor Adair has been trading commodities for 35 years and has held several senior jobs in the brokerage community. He is now senior vice president and derivatives portfolio manager for MF Global Canada Co., a unit of MF Global Ltd., the leading broker of exchange-listed futures and options in the world. He currently trades on behalf of a group of high net worth individuals and corporations. He’s also a market analyst and frequent speaker at investment conferences throughout North America.
Quite a surprise when Gold fell into a bear market in reaction to the Fed’s 2011 QE III – the nearly unlimited money-printing blitz. A historical review tells us when we can expect inflation and another important underlying force that you need to understand….
Inflation?
The most frequently asked question I seem to get, even these days, is: “Larry, don’t you see hyperinflation for the U.S. in the years ahead?”
So let me clarify my position, here and now. There was a time when I expected the U.S. economy would eventually experience hyperinflation.
But when the price of gold failed to react to the Fed’s QE III announcement of virtually unlimited money-printing in September 2011 and the yellow metal entered a bear market, I knew something had radically changed.
So I further researched the known periods of hyperinflation in the world. And I found something that completely changed my view: There has never been a major core economy that has died at the hands of hyperinflation.
There was the Weimar Republic, of course, but it was not a core economy for the world. There are the hyperinflations of Zimbabwe, Brazil, Argentina, Venezuela now and countless other small economies that were never at the core of the global economy.
 And upon further study, I found that even the Roman Empire, certainly a core economy during its reign, didn’t even die of hyperinflation.
It died largely because of abuse of power by politicians, which drove citizens away from the Empire; because of rapidly rising taxation, which had the same effect; and because of a corrupt treasury and justice system that tracked down and confiscated citizens’ wealth, largely to fund increased military campaigns, which were hoped to revive the Roman economy. Sound familiar?
Was there high inflation in Rome before it fell? Yes, but nothing of the sort of hyperinflation like we subsequently saw in Weimar Germany or any of the countries I mention above.
So, then, what does the U.S. economy face? Further disinflation, eventual reflation or something else?
My view, and I am not hedging my answer or talking out of both sides of my mouth: We face a combination of further disinflation in the short term, followed by a rather large jump in inflation a few years from now.
How high will inflation eventually go? Hard to say, but I wouldn’t be surprised if, say, three years from now, we see 20% or even 25% inflation for a very brief period of time.
But I highly doubt we will ever see inflation in the thousands or even millions of percent. It’s just not possible in a core economy. For many different reasons.
Whether we have deflation or inflation is also the wrong way to think about the U.S. economy these days. The reason? Ever since we abandoned the gold standard, inflation and deflation have become two sides of the same coin.
In other words, they are both present in the economy at the same time. You can have certain goods and services and even asset classes deflating, while others are inflating. It’s as simple as that.
For instance, the price of LED TVs has crashed in the past year or so, as have the prices of laptop computers and many other goods.
So it’s not a matter of one or the other, it’s a matter of what sector is inflating and why, versus which sectors are deflating and why.
Nevertheless, there’s another important underlying force that you need to understand, another one that resulted from the abolishment of the gold standard.
A certain level of general, system-wide inflation is always baked into the cake. It’s due, again, to the fact that we no longer have a gold standard, but it’s also due to many other forces, such as population growth, limited availability of natural resources, the constant desire for people to improve their lives and more.
This is important to understand, because it’s the chief reason prices will be higher a year from now, five years from now and even 10 years from now … no matter what the U.S. or global economy does.
And it’s also why investing in gold — just after it experiences a short-term disinflationary trend — is an ideal strategy to jump on.
Speaking of gold. It looks good now. But you don’t want to buy it at these levels. Gold’s new bull market is just getting started. Let it prove itself by first pulling back — which it will do, to below $1,200 …
Then back up the truck. Ditto for other precious metals and especially mining shares.
Best wishes,
Larry
related: Billionaire George Soros Cuts U.S. Stocks Position – Buys Barrick Gold

Click here to download a free report from Larry
Larry Edelson, one of the world’s foremost experts on gold and precious metals, is the editor of Real Wealth Report and Supercycle Trader.
Larry has called the ups and downs in the gold market time and again. As a result, he is often called upon by the media for his investing views. Larry has been featured on Bloomberg, Reuters and CNBC as well as The New York Times and New York Sun.

-
I know Mike is a very solid investor and respect his opinions very much. So if he says pay attention to this or that - I will.
~ Dale G.
-
I've started managing my own investments so view Michael's site as a one-stop shop from which to get information and perspectives.
~ Dave E.
-
Michael offers easy reading, honest, common sense information that anyone can use in a practical manner.
~ der_al.
-
A sane voice in a scrambled investment world.
~ Ed R.
Inside Edge Pro Contributors

Greg Weldon

Josef Schachter

Tyler Bollhorn

Ryan Irvine

Paul Beattie

Martin Straith

Patrick Ceresna

Mark Leibovit

James Thorne

Victor Adair