
Gold & Precious Metals
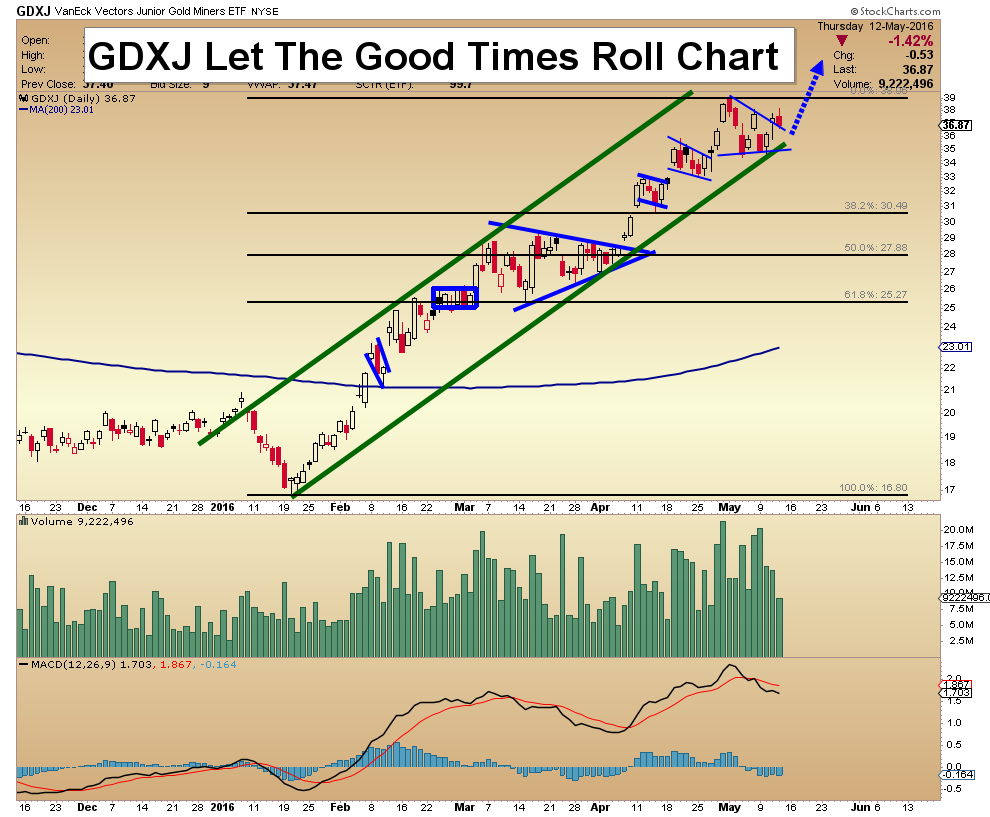
US Bonds, Dollar, & Stock Market Video Analysis
Precious Metal ETFs Video Analysis
Trader Time Swing Trades Video Analysis
SFJ & SF60 Key Stocks Video Analysis
Today’s videos and charts above (double click to enlarge)
Thanks,
Morris
website: www.superforcesignals.com
Related: Fresh Gold Buy Signal Now – M/T Ed.

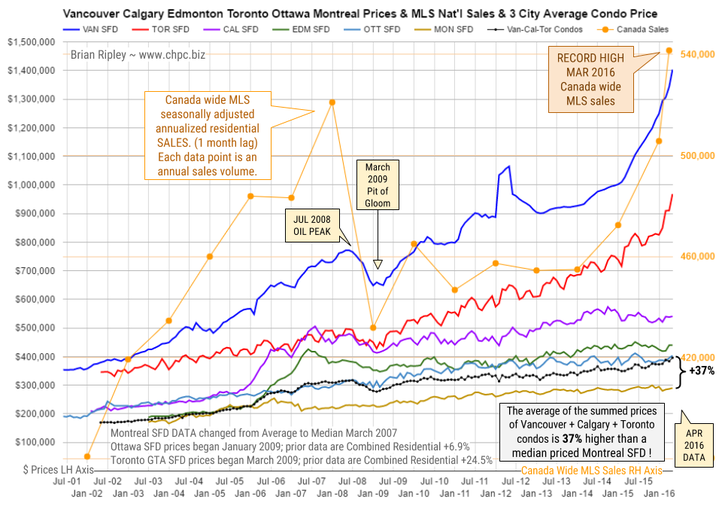
Canadian Real Estate smashes upwards to all-time record highs while Oil, Stock Market and Precious Metals are all remain down from their peaks.
The chart above shows the average detached housing prices for Vancouver, Calgary, Edmonton, Toronto*, Ottawa* and Montréal* (the six Canadian cities with over a million people).
….read the entire analysis HERE
related:
Vancouver Blows Toronto Out of the Water in every category from condo’s to single family dwellings

Todd Market Forecast for Thursday May 12, 2016
DOW + 9 on 250 net declines
NASDAQ COMP – 23 on 1000 net declines
SHORT TERM TREND Bullish
INTERMEDIATE TERM TREND Bearish
STOCKS: Today was disappointing. It opened up sharply, but waffled around. A couple of things may have been at work.
First, jobless claims were up sharply and there is some concern about the retail sales figure to be released on Friday. A lot of retail stocks have been taking it on the chin.
GOLD: Gold was down $11. The dollar rebounded.
CHART: The market is very choppy and indecisive right now. It can’t seem to break down or up. Seasonality suggests that it will break down below the support line (arrow), but we have some very high put call ratios which argue the other way.
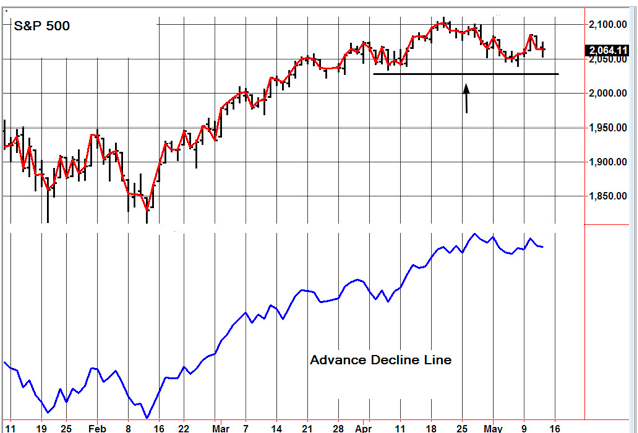
BOTTOM LINE: (Trading)
Our intermediate term system is on a sell. (related, a technical index flashes a Danger Signal – CBOE Volatility Index – Money Talks Ed.)
System 7 We sold the SSO at 64.28 for a loss of 80 cents. Stay in cash.
System 8 We are in cash. Stay there.
News and fundamentals: Jobless claims were 294,000, worse than the expected 267,000. On Friday we get retail sales, PPI final demand and consumer sentiment.
Interesting Stuff: The use of mathematics has brought rigor to economics. Unfortunately, it has also brought mortis — Attributed to Robert Heilbroner
TORONTO EXCHANGE: Toronto was down a fraction.
BONDS: Bonds fell back somewhat.
THE REST: The dollar was up. Silver was lower. Crude oil was mildly higher.
Bonds –Bullish as of April 27.
U.S. dollar – Bearish as of March 7.
Euro — Bullish as of March 7
Gold —-Bearish as of May 9.
Silver—- Bearish as of May 9.
Crude oil —- Bearish as of April 4.
Toronto Stock Exchange—- Bullish from January 22.
S&P TSX Venture Fund — Bullish from January 29.
We are on a long term buy signal for the markets of the U.S., Canada, Britain, Germany and France.
|
|
Thu. |
Fri. |
Mon. |
Tue. |
Wed. |
Thu. |
Evaluation |
|
Monetary conditions |
0 |
0 |
0 |
0 |
0 |
0 |
0 |
|
5 day RSI S&P 500 |
26 |
37 |
40 |
68 |
47 |
46 |
0 |
|
5 day RSI NASDAQ |
18 |
29 |
37 |
61 |
43 |
38 |
0 |
|
McCl- lAN OSC. |
-126 |
-82 |
-95 |
-15 |
-75 |
-87 |
0
|
|
Composite Gauge |
11 |
6 |
11 |
5 |
15 |
11 |
0 |
|
Comp. Gauge, 5 day m.a. |
11.4 |
10.4 |
11.2 |
9.2 |
9.6 |
9.6 |
0 |
|
CBOE Put Call Ratio |
1.20 |
1.19 |
1.14 |
1.09 |
.94 |
1.27 |
+ |
|
VIX |
15.91 |
14.72 |
14.57 |
13.63 |
14.69 |
14.41 |
|
|
VIX % change |
-1 |
-7 |
-1 |
-6 |
+8 |
-2 |
0 |
|
VIX % change 5 day m.a. |
+0.8 |
-1.2 |
+0.2 |
-2.4
|
-1.4 |
-1.6 |
0 |
|
Adv – Dec 3 day m.a. |
-786 |
+5 |
+153 |
+726 |
+132 |
+124 |
0 |
|
Supply Demand 5 day m.a. |
.55 |
.62 |
.54 |
.66 |
.55 |
.59 |
0 |
|
Trading Index (TRIN) |
1.25 |
.94 |
1.32 |
.61 |
.94 |
1.32 |
0
|
|
S&P 500
|
2051 |
2057 |
2059 |
2084 |
2064 |
2064 |
Plurality +1 |
INDICATOR PARAMETERS
Monetary conditions (+2 means the Fed is actively dropping rates; +1 means a bias toward easing. 0 means neutral, -1 means a bias toward tightening, -2 means actively raising rates). RSI (30 or below is oversold, 80 or above is overbought). McClellan Oscillator ( minus 100 is oversold. Plus 100 is overbought). Composite Gauge (5 or below is negative, 13 or above is positive). Composite Gauge five day m.a. (8.0 or below is overbought. 13.0 or above is oversold). CBOE Put Call Ratio ( .80 or below is a negative. 1.00 or above is a positive). Volatility Index, VIX (low teens bearish, high twenties bullish), VIX % single day change. + 5 or greater bullish. -5 or less, bearish. VIX % change 5 day m.a. +3.0 or above bullish, -3.0 or below, bearish. Advances minus declines three day m.a.( +500 is bearish. – 500 is bullish). Supply Demand 5 day m.a. (.45 or below is a positive. .80 or above is a negative). Trading Index (TRIN) 1.40 or above bullish. No level for bearish.
www.toddmarketforecast.com – Available Mon- Friday after 6:00 P.M. Eastern, 3:00 Pacific.
No guarantees are made. Traders can and do lose money. The publisher may take positions in recommended securities.

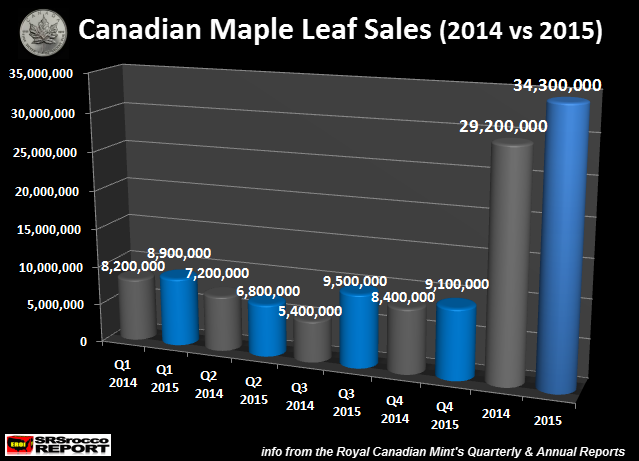 North American silver investment via its domestic supply suffered another large deficit in 2015. How big was the deficit? It was huge, surging 70% compared to 2014… and this only includes silver investment from two Official coin sales.
Let me explain. We need to start off by showing the total Canadian Silver Maple Leaf sales for 2015. The Royal Canadian Mint finally published their 2015 Annual Report in which they stated that sales of Silver Maples jumped 18% from 29.2 million (Moz) in 2014 to 34.3 Moz in 2015:
related:
Larry Edelson says: Beware of Gold Rally
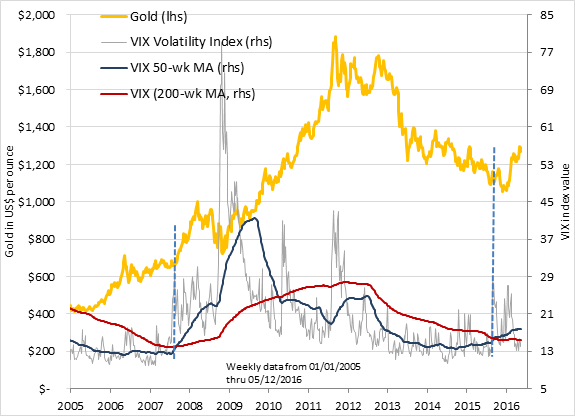
With gold under pressure this morning on the back of stronger stock markets, the strengthening US dollar and up-tick in US bond yields some focus on the primary US dollar gold price pressure factors is warranted. The primary gold bearish factors have been shifting in 2016, but are far from reversing. They include:
– Expectations of an extended Fed tightening cycle
– The strong US dollar
– Above average stock market returns
– Low volatility (VIX)
….for analysis on each of these points above go HERE
related:
For an alternate view go to Stewart Thomson’s: Fresh Gold Buy Signal Now


-
I know Mike is a very solid investor and respect his opinions very much. So if he says pay attention to this or that - I will.
~ Dale G.
-
I've started managing my own investments so view Michael's site as a one-stop shop from which to get information and perspectives.
~ Dave E.
-
Michael offers easy reading, honest, common sense information that anyone can use in a practical manner.
~ der_al.
-
A sane voice in a scrambled investment world.
~ Ed R.
Inside Edge Pro Contributors

Greg Weldon

Josef Schachter

Tyler Bollhorn

Ryan Irvine

Paul Beattie

Martin Straith

Patrick Ceresna

Mark Leibovit

James Thorne

Victor Adair